Stress Analysis of the Vertical Tail Root
Fitting Bracket and Calculation of Fatigue
Damage Due To Fluctuating Side Loads
Chinmayee M J 1, Dr. Thammaiah Gowda2
P.G. Student, Department of Mechanical Engineering, AIT, Chikmagalur, Karnataka, India1
Professor, Department of Mechanical Engineering, AIT, Chikmagalur, Karnataka, India2
ABSTRACT: Vertical tail (VT) is one of the important components in the airframe structure connected to the fuselage structure. VT experiences side loads due to rudder deflection. VT is attached to the fuselage through attachment brackets. The joint locations between the major components of the aircraft are considered to be critical locations. The current project includes the stress analysis of the vertical tail root fitting bracket and modifying the design if necessary. Bracket connects the fuselage and VT. Loads received by the VT will get transferred to fuselage at the root. It is almost like a cantilever action, which induces maximum bending moment at the root. Attachment bracket with surrounding structural elements will be considered in the stress analysis. Finite element method is adopted in the stress analysis of the structure. Stress analysis will be carried out at the high tensile stress location to capture the stress concentration and gradient stress field near the fasteners. Since the VT experiences fluctuating side loads, fatigue crack will initiate at the maximum tensile stress location. Fatigue damage calculation will be carried out using linear damage theory. S-N curve for aluminum alloy material obtained from the literature will be used.
KEYWORDS: Vertical tail, Root-fitting bracket, Side load, FEM, Fatigue.
I. INTRODUCTION
The empennage also known as the tail or tail assembly, of most aircraft gives stability to the aircraft. Most aircraft feature empennage incorporating vertical and horizontal stabilizing surfaces which stabilizes the flight dynamics of pitch and yaw respectively. The vertical stabilizer maintains the stability of the aircraft about its vertical axis. This is known as directional stability. The trailing end of the stabilizer is typically movable, and called the rudder; this allows the aircraft pilot to control yaw. The rudder is the small moving section at the rear of the stabilizer that is attached to the fixed sections by hinges. Because the rudder moves, it varies the amount of force generated by the tail surface and is used to generate and control the yawing motion of the aircraft. .Vertical stabilizers box has two or multi spar with control panels. The root of the box is terminated at the aft of the fuselage junction with fitting or splices or the box spar terminates on bulkhead in the aft fuselage. Loads on the vertical tail are caused by rudder deflection, aileron deflection, lateral gust and asymmetric engine trust [1]. Side loads are produced by the rudder deflection. In case of 2 spars VT the front spar carries more load than the rare spare of the total side load. Side load from the spar is transferred to the bulkhead of the fuselage through attachment bracket. So bracket area is very critical area. Much catastrophic failure in VT is caused due to the increase in stress in this bracket area than the ultimate tensile strength [2].
Fatigue life is crucial in the stress concentration areas, where fatigue cracks are usually initiated. In most metal airframes stress concentrations are related to joints between elements. The most common technique for joining metal
airframe is riveting. In a typical aviation structures there are between several thousands and several millions rivets,
depending on the size of the aircraft. Fatigue cracks of structural components of aircraft are results of operating tensile stress. When considering riveted joints, circumferential stresses occurring in the joined elements near the rivets play a crucial role. The stress field around the rivet is the result of stresses generated during riveting (and other processes) and the stress occurring during the operation. Fatigue life estimation can be done by using Palmgren-Miner rule. It is also known as the Miner’s Linear Cumulative Damage Theory, is widely used in the analytical fatigue analyses. The basic philosophy of this theory is that the fatigue damage introduced by a given stress level is proportional to the number of cycles at that stress level divided by the total number of cycles to failure at that stress level. It is given by
1
i
fi
K
i n D
N
(1) Where, n
i = Applied number of cycles, Nfi = number of cycles to failure, K= stress levels.II. RELATEDWORK
There were many research being carried out on failure of lug joints, fatigue crack growth behaviour, fatigue life estimation. Here are few papers referred in this project and listed below.
P. M. S. T. de Castro et. Al [3] Presented “Damage Tolerance of Aircraft Panels” which investigates Damage tolerance analysis and provided information about the effect of cracks on the strength of the structure. Damage tolerance evaluation must include a determination of the probable locations and modes of the damage due to fatigue, or
accidental damage. Vignesh T et. Al[4] investigated Static stress and fatigue analyses have been done for vertical
stabilizer of a typical trainer aircraft at +4g factor condition. Design modelling of component is done using CATIA V5 software. Static stress analysis has been done using Patran and Nastran software. Aluminium 7075 T6 material which has high fatigue strength has been used in vertical stabilizer. From the static stress analysis, maximum principal stress value has been found out which is less than the yield strength of Al 7075 T6. The maximum principal stress value has been used in fatigue calculation and the obtained analytical result shows the safe number of factored fatigue life hours for the component. The result predicted in this work concludes the efficient number of factored fatigue life hours for the vertical stabilizer which would reduce the service cost of the component and ensures structural safety to the component. R Ravi kumar et. Al[5] investigated the landing gear space structure is idealized as a statically determinate structure and a stress analysis is performed using Strength of Material approach. The stresses developed because of loading on the structural members of the landing gear are calculated. A finite element model of the landing gear structure is developed and analysed. The FEA stress and deformation results are compared with that obtained from “SOM” approach. Fatigue life to crack initiation is estimated for a critical lug of the landing gear unit by considering the constant amplitude landing cycles. Goranson [6] investigated the fatigue issues in aircraft maintenance and repairs, ensuring structural integrity of Boeing jet transports. Designing for continued structural integrity in the presence of damage such as fatigue or corrosion is an evolutionary process. His work focused on methods with special emphasis on practical fatigue reliability considerations. Durability evaluations are based on quantitative structural fatigue ratings which incorporate reliability considerations for test data reduction and fleet performance predictions. Fatigue damage detection assessments are based on detection reliability estimates coupled to damage growth and residual strength evaluations. J.E Moon [7] investigated the Cumulative fatigue damage in lugs with and without interference-fit bushes. Fatigue tests have been carried out under constant and variable amplitude loading conditions and local stress measurements have been made using the Companion Specimen Method
III.OBJECTIVEANDMETHODOLOGY
current work stress analysis is carried out on the attachment bracket of 108 seating capacity aircraft. The metrology to determine maximum stress location in the vertical tail root fitting bracket is as shown in the flowchart below.
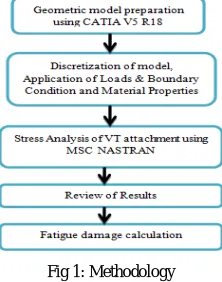
Fig 1: Methodology
Figure 1 show the metrology used in this project. Here Conceptual model is modelled using CATIA V5 R18. The CATIA model is imported to PATRAN. This model is coarse and fine meshed according to the requirement. The boundary conditions are added. To that material properties are added. This is exported to the NASTRAN to solve the problem. Then the solved file is imported to PATRAN to view results. Here static stress analysis is carried out. From Analysis maximum stress location is determined. To this location fatigue damage calculation is carried out to predict when the crack is going to initiate which helps to know when the inspection should be carried out.
Fig 2: (Left) Empennage. (Right) Spar VT spars with lug attachment and bulkhead
Figure 2 shows Empennage showing its different parts and also the Vertical tail with attachment bracket along with the bulkhead of the fuselage. In the aircraft considered for analysis the vertical tail has two spars. Front spar and rare spar. Front spar carries 55% of the side load. In this project Front spar along with attachment bracket and bulkhead is considered for analysis.
Fig 3: (Left) Exploded view of vertical tail root fitting bracket (rotated 900). (Right) Detail view A Table 1: Detail of components considered for Analysis
Components no Material
Spar 1 Al 2024-T3
C bracket 2 Al 2024-T3
L bracket 4 Al 2024-T3
Bulkhead 2 Al 2024-T3
Rivet 116 AL 2117-T4
Figure 3 shows the exploded view of the vertical tail root fitting bracket. Detail A shows the part in the bracket area. There are mainly five components considered for analysis. Its quantity and material used for analysis is shown in the table 1. Side loads which are caused due to rudder deflection are transferred from skin to the spar. The side loads is transferred from front spar to the bulkhead of the fuselage by means of attachment bracket. So the bracket area is expected to have maximum stress. The Catia V5 R18 Vertical tail root fitting bracket model is imported to MSC PATRAN. It is meshed according to the requirement. All the four components except rivet are coarse and fine meshed.
Fine meshed is done at the area where there are holes. Here RBE3 (Rigid Body Constrain) MPC’S are used because for
analysis to constrain the points near the rivet hole and to transfer the load through the rivet. RBE3 MPC’S are used in the bracket area where spar and C bracket are connected using rivets. The hole is represented only in the spar and C bracket where maximum stress is expected. In other location holes are represented by nodes. Here rivets are represented by beam elements.
Fig 4
Fig 4: FE Model of VT Attachment. Table 2: Summary of FE details
Figure 4 shows finite element model of VT root fitting bracket. Table 2 shows finite element detail. It shows number of
elements, nodes and MPC’S used. After preparation of FE model next step is boundary condition. The lower bottom of
the bulkhead is completely constrained. The side force acts on the spar. The amount of load acting on it is needed to be calculated.
IV.LOADCALCULATION
Design load factor = 3g
Total load experienced by vertical tail in 3g condition=437 kg (4512.6 N/mm2)
Span of the front spar = 2740mm
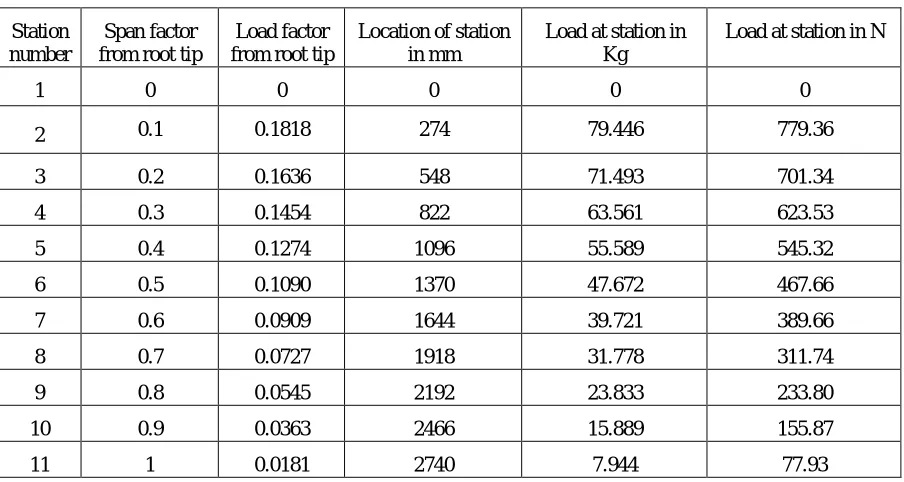
The input for calculating load is load factors and span factor. Location of stations on spar is given by
Span Factor at station x total length of the spar (2) Load at a particular station is given by: Load Factor at that station x total load at 3g (3).
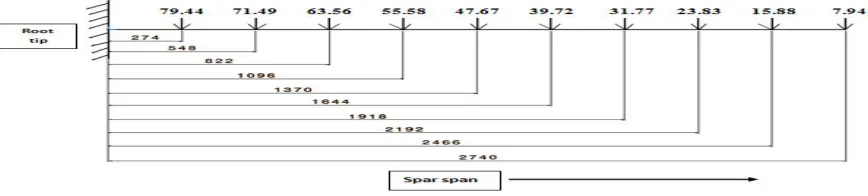
Figure 5: Loads at each station in front spar
Group Elements Nodes MPCS
Spar 24483 25745 -
C bracket 2803 2977 -
L bracket 168 224 -
Bulkhead 3798 4072 -
Rivet 148 698 40
Total 31400 33716 40
Figure 5 shows the force acting at corresponding stations. There are total 10 stations. Maximum bending moment for
above case is found to be 478.12 X 10³ kg-mm (4690357.2 N-mm).
Table 3: Loads corresponding to station in the front spar
Table 3 shows the span factors, load factors and the load acting at the corresponding stations. To find load to be applied at free end
Moment = Force x distance (4) Force = 478.12 X 10^ 3 / 2740 = 174.49 kg (1711.75 N)
To convert point load into uniformly distributed load: UDL at free end = load at free end / total length at free end
UDL = 1.143 kg/mm (11.21 N/mm)
1.143 kg/mm is applied at the free end of the spar thought the length in Y direction. After application of boundary condition, material properties are added. And it is solved.
V. RESULTS
Conceptual model of VT root fitting bracket is analysed, initially when the loads and boundary condition were applied
the maximum tensile stress of 102 Kg/mm2 (1000.62 MPa) is obtained at the rivet hole at the bottom flange of the spar.
It was found that maximum tensile strength in C bracket and spar. As tensile yield strength of Aluminium 2024 T3 material was 345 MPa the design was not safe.
Since Load Area
(5) As loading condition and desired stress is fixed only variable is area and also stress is inversely proportional to area, the thickness of the bracket was increased from 4mm to 8mm in the conceptual model. As 4mm increase in the thickness of the bracket was permissible. And again analysis was carried out. It was found that maximum tensile stress was 81.2
Kg/mm2 (796.572 MPa). As tensile yield strength of Aluminium 2024 T3 material is 345 MPa thus the design was not
safe. The only option is to increase the area. As future increase in the thickness of the bracket is not possible the width Station
number
Span factor from root tip
Load factor from root tip
Location of station in mm
Load at station in Kg
Load at station in N
1 0 0 0 0 0
2 0.1 0.1818 274 79.446 779.36
3 0.2 0.1636 548 71.493 701.34
4 0.3 0.1454 822 63.561 623.53
5 0.4 0.1274 1096 55.589 545.32
6 0.5 0.1090 1370 47.672 467.66
7 0.6 0.0909 1644 39.721 389.66
8 0.7 0.0727 1918 31.778 311.74
9 0.8 0.0545 2192 23.833 233.80
10 0.9 0.0363 2466 15.889 155.87
of the spar at the hole location are increased from 4mm to 8mm. The length of the increased thickness is 200 mm from the root tip. And rest of the spar thickness is maintained 4mm and again the analysis was carried out. Maximum stress
at the rivet hole of the bottom flange was found to be 33.2 Kg/mm2 (326 MPa). Hence the design is safe. The maximum
stress obtained is within the tensile yield strength 345 MPa for Aluminium 2024 T3 material, so the structure is in safe condition. The maximum stress was found to be in the rivet holes of the bottom flange of I spar. Figure 6 shows stress contour of the VT with the attachment bracket when the thickness of C bracket and I spar are 8mm. The middle figure shows the maximum stress location in the assembly. Figure in the right shows the distribution of stress in the rivet hole
where maximum stress is found to be 33.2 Kg/mm2 (326 MPa).
Figure 6: (Left) Stress contour of the VT attachment bracket. (Middle) Maximum stress location at the bottom flange (right) Detail B: Stress distribution at maximum stress location
VI.VALIDATION
The maximum stress 33.2 Kg/mm2 (326 MPa) was found at the rivet hole in the bottom flange of the I spar which is at
the distance of 2575.73 mm from the free end. It can be represented as in the figure 7.
Figure 7: Maximum stress location
The maximum bending moment at section A –A is 449.31x10^3 Kg-mm (4407731.1 N-mm). Moment of Inertia for
section A-A is 9.668520x10^6 mm4. Here net area is considered.
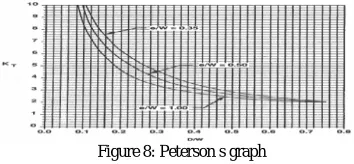
Figure 8: Peterson s graph
Figure 8 shows Peterson s graph which is used to determine stress concentration factor (Kt). From above graph
Kt=6.8.The maximum stress by SOM approach is 30.6 Kg/mm2 (301 Mpa).
The difference in the SOM and FEM results is nearly 7.8% which is acceptable. Detail B
A
VII. FATIGUEDAMAGECALCULATION
Fatigue life estimation can be done by using Palmgren-Miner rule. It is given by the equation 1. S N curve of AL 2024 is used to determine number of cycles to failure. To use S N curve alternating stress and stress ratio is required.
Alternating stress is given by,
max min 2
a
(6)
.
a
a
C F
(7) Equation 7 shows alternating stress with correction factor.
Correction factor (C.F) considered are Surface Roughness= 0.8 and Reliability in Design = 0.897. Stress ratio is given by,
min
max R
(8)
Table 4: Stress amplitude and stress ratio values at various ranges of “g” conditions
Table 4 shows different “g” ranges corresponding Minimum, Maximum, Alternating stresses and Stress ratios. Number of cycles to failure is calculated using S-N diagram of 2024-T3 aluminum alloy as shown in figure 9.
Figure 9: S-N diagram of 2024-T3 Aluminum alloy
Since AL 2024-T3 is used in spar where maximum stress location is found, thus S-N diagram of 2024-T3 Aluminum alloy is used to determine cycles to failure. Induced number of cycles is the input. Since the intersection of the alternating stress and ratio is below 10^7 cycle curve. The stress level of this operating range is below fatigue limit or endurance limit so; the material does not fail and can be cycled infinitely. In the case of 0.5g to 0.75g the applied stress level is below the endurance limit of the material, the structure is said to have an infinite life. If this is the load spectrum for the entire life of the aircraft the crack will not initiate at this operating range. Same holds good for 0.75g to 1g, 1g to 1.25g and 1.25 g to 1.5g operating ranges. By using equation 1 damage is calculated and tabulated.
Range of “g” Min. Stress σmin (MPa) Max. Stress σmax (MPa)
Alternating Stress σa Stress
Ratio R
in KSI in MPa
0.5 to 0.75 54.28 81.42 2.74 18.91 0.67
0.75 to1 81.42 108.56 2.74 18.91 0.75
1 to 1.25 108.56 135.7 2.74 18.91 0.80
1.25 to1.5 135.7 162.84 2.74 18.91 0.83
0 to1.75 0 190 19.19 132.38 0
0 to 2 0 217.13 21.93 151.28 0
Table 5: Fatigue cycle using S-N graph for given range of ’g’
Table 5 shows different g conditions, no of cycles to failure obtained from S-N diagram and damage accumulation. Total damage accumulated for all load case is given by
D = D1+D2+D3+ D4+D5+D6+D7= 0.0218
For 7290 induced cycles the total Damage accumulation is 0.0218, it is less than 1, Therefore crack will not initiate at the location of maximum stress in the VT attachment for the given load case and the fatigue load spectrum.
For no of cycles at which the crack initiate is
334.40 7290
0.0218 10 ^3 cycles
Thus the crack gets initiated when it reaches 334.40 10 ^ 3 cycles. So inspection should be carried out when it reaches its
value.
The fatigue life can be determined by,
Considered 1 block =100 flight hours, Total number of block required for crack initiation when damage fraction is equal to 1 is, the total number of load blocks 1/0.0218=45.87 Blocks. Therefore for 45.87 blocks the total flight hours are 45.87 x 100 = 4587 flight hours. The cracks get initiated after 4587 flight hours at maximum stress location of the VT attachment. So the inspection should by carry out before the aircraft crosses the 4587 flight hours.
VIII. CONCLUSION
Conceptual model had high stress when compared to the tensile yield strength of Aluminium 2024 T3 material.
Design modifications were done and the maximum stress was found to be 326 MPa at the rivet hole of the bottom flange of I spar. Hence the design is safe. The maximum stress obtained is within the tensile yield strength 345 MPa for Aluminium 2024 T3 material, so the structure is in safe condition.
The fatigue calculation is carried out for an estimation of life to crack initiation. Palmgren-Miner rule is used for damage tolerance calculation. The damage accumulation obtained is 0.0218. The value of damage fraction is much less than 1.According to Palmgren-Miner rule the damage fraction is less than 1, Therefore the crack will not get initiated. Therefore material is safe. The cracks get initiated after 4587 flight hours at maximum stress location of the VT root fitting bracket. So the inspection should by carry out before the Aircraft crosses 4587 flight hours.
REFERENCES
[1] Michael Chun and Yung Niu, “Airframe Structural design”, vol.2, pp. 59-65 , 1989.
[2] Aviation investigation report-A05F0047, “Loss of rudder in flight”, AIRBUS A310-308, Florida, 06 march 2005.
[3] P. M. S. T. De Castro1, S. M. O. Tavares1, V. Richter-Trummer1, P. F. P. De Matos2, P. M. G. P. Moreira3, L. F. M. Da Silva1 “Damage Tolerance Of Aircraft Panels” Revista Da Associação Portuguesa De Análise Experimental De Tensões, Issn 1646-7078.
[4] Vignesh T, Hemnath B.G, Chinagounder c, Caesar “Static Stress and Fatigue Analysis on Vertical Stabilizer of a Typical Trainer Aircraft” International Journal of Innovative Research in Science, Engineering and Technology, Vol. 3, Issue 4, April 2014.
[5] R ravi kumar, K dash, S r basavaraddi “Design and analysis of main landing gear structure Of a transport aircraft and fatigue life estimation For the critical lug”, International Journal of Mechanical and Production Engineering, Volume- 1, Issue- 4, Oct-2013.
[6] Goranson Ulf G., “Fatigue Issues In Aircraft Maintenance and Repairs”, Elsevier Int. J. For Fatigue Vol. 20, No. 6, year 1997, pp. 413–431 .
[7] J.E Moon "Fatigue behaviour of BS 2L65 Alumimium Alloy pin loaded lugs with interference fit bushes" Reports and memoranda no. 3835, november 1977, pp 2-18.
Range of g No. of Applied
Cycles ni No. of cycles to Failure Nf
Damage accumulated
D
0.5 to 0.75 2000
00.75 to1 400
01 to 1.25 100
01.25 to 1.5 150
00 to 1.75 2500 127X10^3 0.0196
0 to 2 2000 10^6 2x10⁻³