Copyright1999 by the Genetics Society of America
The Detection and Measurement of Recombination From Sequence Data
J. Maynard Smith
School of Biological Sciences, University of Sussex, Brighton BN1 9QG, United Kingdom
Manuscript received March 22, 1999 Accepted for publication June 7, 1999
ABSTRACT
There are two types of recombination that we may wish to detect: rare recombinants between members of different populations or species and repeated recombination within a population. Methods appropriate in the former context are inappropriate in the latter because they depend on recognizing the existence of runs of nucleotides with similar ancestry. If recombination is sufficiently frequent, no such runs will be present. Several methods, including the homoplasy test and the incompatibility test, are described that are appropriate for detecting repeated recombination and for measuring its importance, relative to mutation, in causing genetic change. The sensitivity of these tests is investigated by simulating populations with varying frequencies of mutation and recombination and calculating the various statistics on samples.
T
HIS article is concerned with the use of DNA se- quences is incompatible with the hypothesis of clonal descent: in this article, “clonal” is taken to mean repro-quence data to detect and measure the role ofho-duction without genetic recombination. In principle, mologous recombination in natural populations. Its
these methods can be used not only to detect recombi-most obvious relevance is to bacteria, which vary from
nation but also to measure its importance, relative to the clonal to the effectively panmictic (Maynard Smith
mutation, in generating change. The effectiveness of andSmith1998;Suerbaum et al. 1998) and in which
these tests is investigated by applying them to simulated recombination is decoupled from reproduction.
How-populations of varying size, mutation rate, and recombi-ever, the methods are also relevant to eukaryotes in cases
nation rate. in which the role of recombination is uncertain—for
example, between mitochondrial genomes (
Eyre-Walkeret al. 1999;Hagelberget al. 1999) and in
organ-RARE OR UNIQUE RECOMBINATION
isms whose reproduction is apparently parthenogenetic.
The main point to be made is that there are two Several methods exist for detecting runs of nucleo-very different contexts in which we may wish to detect tides with similar ancestry.Stephens(1985) examined recombination. Methods appropriate in one context sites that are associated with particular phylogenetic may be ineffective in the other. We may be seeking partitions of the set of sequences into two groups: thus either (i) unique or rare recombination between mem- a site is associated with a partition if it has one allele in bers of genetically different populations—for example, one subset and a different allele in the other. He de-between different species or de-between different parts of scribes statistical tests to determine whether a set of the genome; or (ii) repeated recombination between sites associated with a particular partition are clustered. homologous sites in members of a single population. Sawyer(1989) gives a more general method for decid-Unique or rare events lead to linked runs of nucleo- ing whether the differences, or similarities, between a tides within a sequence whose ancestry is different from pair of sequences occur in runs: the method can also other nucleotides in the same sequence. Several meth- be applied to a set of sequences.
ods exist for detecting such runs: they are described If a visual inspection of the polymorphic sites in a set
only briefly. of sequences suggests that one or more recombinational
With repeated recombination, such runs may not ex- events have occurred, the maximum chi-square method ist or may be hard to detect. If recombination is frequent (Maynard Smith1992) will locate the most likely posi-enough, the sites within a gene will be in linkage equilib- tions of the crossovers and test their statistical signifi-rium: that is, there will be no association between neigh- cance. The method was used to identify the role of boring nucleotides. Even with rates of recombination horizontal gene transfer in the spread of antibiotic resis-far too low to generate linkage equilibrium, it is shown tance in Streptococcus (Dowsonet al. 1989) and
Neisse-that methods aimed at detecting runs of nucleotides ria (Sprattet al. 1992).Hein(1990) showed how maxi-with similar ancestry are ineffective. Methods of de- mum-likelihood methods can be used to locate the tecting repeated recombination are described. Ulti- position of crossovers.Holmeset al. (1999), in an
analy-mately, they depend on the fact that, if there has been sis of recombination in Dengue virus, described a maxi-mum-likelihood method that can be used if a putative recombination, the pattern of variation in a set of
recombinant and two parental sequences are suggested to synonymous third sites: little information is lost. If there are S synonymous sites, all equally likely to change, by the data.
Sneathet al. (1975) proposed a method that depends it is easy to calculate exph, the expected number of homoplasies with clonal reproduction, given v polymor-on identifying incompatible pairs of sites. They cpolymor-onsid-
consid-ered protein sequences, but the method is equally appli- phic sites. If sites are not equally likely to change, an estimate of exph requires an estimate of Se, the effective
cable to nucleotide sequences and is discussed here in
that context. Two sites are incompatible if they cannot site number, defined as follows. Consider two identical copies of a gene, obeying the same evolutionary rules, be incorporated into a phylogenetic tree without
assum-ing that one of the sites has changed twice. If each site and let each undergo a random substitution. Let psbe
the probability that the two substitutions are identical. is present in the data set in only two states, as is typical
for nucleotide data, the pair are incompatible if all four Then Se51/ps. Clearly, if all sites are equally likely to
change, Se5 S; otherwise, Se,S.
genotypes, 00, 01, 10, and 11, are present. An
incompati-bility matrix can be plotted for a set of sequences, for For synonymous sites, codon bias is the most likely reason why the probability of change should vary be-all phylogeneticbe-ally informative sites (that is, sites at
which both alleles are present in at least two strains). tween sites. Given a known pattern of codon usage, Maynard Smith and Smith describe a method for calcu-If there are n informative sites, an n 3 n matrix is
plotted, with black squares for incompatible sites. lating Se: applied to Escherichia coli, this gives Se50.73
S for genes with a very high codon adaptation index Jakobsen and Easteal(1996) describe a program to
construct incompatibility matrices and to test whether and Se 5 0.83 S for genes with a medium high index
(data fromBulmer1988). Alternatively, Secan be
esti-incompatible sites cluster. Jakobsen et al. (1997)
de-scribe a program that plots partition matrices: in effect, mated using an outgroup. Further difficulties arise if some sites are hypermutable. Methods for detecting this is a visualization of Stephens’ method described
above. It is not clear that this offers any advantage over hypermutability, if it exists, are described by Eyre-Walkeret al. (1999): in general, such methods require
eyeballing a simple listing of polymorphic sites,
com-bined with using the maximum chi-square method to an outgroup.
If the observed number of homoplasies, obsh, is sig-test the significance of possible recombinants.
All the methods described in this section depend on nificantly greater than exph, the plausible explanation is recombination. The extent of recombination is mea-the existence of runs of polymorphic sites with a similar
ancestry. They are therefore unsuitable for detecting sured by the “homoplasy ratio,” repeated recombination within a population.
H5(obsh2exph)/(shh2exph),
where shh is the number of homoplasies for a
popula-REPEATED RECOMBINATION WITHIN tion with the observed variation at each site, but in A POPULATION
linkage equilibrium (estimated by randomizing the al-leles at each site between sequences and recalculating There are several methods for detecting repeated
re-combination. First, the logic of these tests is described, h). H is a number whose expectation varies from 0
(clonal) to 1.0 (complete linkage equilibrium). and then their sensitivity is investigated by applying
them to simulated populations. The incompatibility ratio: If more than a very few
recombinational events have taken place in the ancestry
The homoplasy test:This test was described by
May-nard SmithandSmith(1998). It can be applied to a of a set of sequences, patterns in the incompatibility matrix become hard to interpret. However, for a given set of sequences of a single gene or of several unlinked
genes from the same strains. The logic is as follows. degree of polymorphism, recombination increases the proportion of incompatible sites. This suggests the use Construct a maximum-parsimony tree for a set of
se-quences. If there are v polymorphic sites, and t steps in of the incompatibility ratio, (IR) as a statistic, where IR5(number of pairs of sites that are incompatible)4 the tree, then h5t2v is the number of homoplasies,
or double events. If, as is usual, there are several equally (number incompatible in a shuffled matrix). The data set is the matrix of phylogenetically informative sites, parsimonious trees, this does not matter because it is
only the total number of steps that matters. If descent and, as for the homoplasy ratio, a shuffled matrix is one in which, at each site, the alleles have been randomly is clonal and the number of sites infinite, then h5 0.
If there has been recombination, however, in general shuffled between strains.
IR has one advantage and one disadvantage
com-h.0. This fact was used byHudsonandKaplan(1985)
to estimate recombination rate. pared to H. The advantage is that it is easier to calculate
the proportion of incompatible sites than to find a maxi-Difficulties arise when mutation is so common that
there can be repeated mutations at the same site. If so, mum-parsimony tree, particularly for a large data set. The disadvantage is that its expected value for a clonal there may be homoplasies even in a clonal population.
TESTING FOR RECOMBINATION IN
from clonality. However, if the effective site number Se
SIMULATED POPULATIONS
is very large compared to the number of polymorphic
sites, then the expected number of incompatible pairs Values of the three statistics, H, IR, and Sawyer’s ratio, in the absence of recombination is close to zero, and were calculated for samples drawn from simulated
popu-this difficulty does not arise. lations. Simulations were carried out as follows:
The index of association:A third possible measure is
1. Each population was haploid, of N individuals (vary-related to the index of association, (IA), which has been
ing from 50 to 1000), each with 100 sites equally used to analyze multiple-locus enzyme polymorphism
likely to mutate between two alleles, 0 and 1 (thus (Brownet al. 1980;Maynard Smithet al. 1993). This
the simulations are of single-nucleotide polymor-is based on Vobs, the variance of the genetic distance
phisms for which only two nucleotides are usually between pairs of strains, compared to Vexp, the
corre-found at a site). Each new generation was formed sponding variance in a shuffled matrix. The expected
by sampling with replacement from the previous one. value of the ratio Vobs/Vexp is 1.0 for complete linkage
2. In each generation, m mutations occurred, each at equilibrium and.1.0 if recombination is absent or
in-a rin-andom site in in-a rin-andom individuin-al. frequent. It is most useful as a measure of departure
3. In each generation, r recombinations occurred. A from linkage equilibrium because its expected value is
random donor and recipient were chosen, and all then known, and an expression for its error variance
sites beyond a random crossover point were ex-has recently been published (Haubold et al. 1998).
changed. It is less useful for detecting departure from clonality
4. For each set of parameter values, starting from a because its expected value in clonal populations is
un-population with only 0 alleles, a foundation popula-known unless Seis very large relative to the number of
tion was formed by iterating 3N generations. Starting polymorphic sites. A second difficulty with IA is that its
from this foundation population, five simulations expected value for a clonal population increases with
were made, each of 3N further generations. the number of loci analyzed.Burtet al. (1999) suggest
5. From each final population, two random samples a related statistic, which increases monotonically with
(usually of 20 or 30 individuals) were drawn, and
IA, but whose expectation is independent of the number
statistics calculated. of loci analyzed.
The coefficient of linkage disequilibrium:Lewontin Different statistics were calculated on different simu-(1964) suggested the coefficient D5 (PAB· Pab2PAb· lated populations. This was not necessary but arose
be-PaB)/(PAB· Pab1PAb· PaB), where PABis the frequency of cause the investigation of H was completed before the
AB haplotypes, and similarly for Ab, aB, and ab, as a investigation of IR started.
measure of departure from linkage equilibrium. Be- In Figure 1, the statistics are plotted against R/M, cause the choice of the symbols A and B is arbitrary, it where R is the probability that a particular site in a gene is customary to take the absolute value of D, a number is altered by recombination and M the probability that whose expectation varies from 0 ( linkage equilibrium) the site is altered by mutation. The use of this measure to 1 (complete association).Conwayet al. (1999) have of recombination is discussed further below.
recently used D to demonstrate recombination from Figure 1A shows Sawyer’s ratio, a measure based on population data in Plasmodium falciparum. They show Sawyer(1989). This test depends on the sum of squares that values of D significantly different from zero are of the lengths of runs in the data; Figure 1A shows the frequent for bases ,1 kb apart (demonstrating the ratio of this sum calculated for the real data and for a power of the test to detect disequilibrium) but absent for randomized matrix with the same allele frequencies at sites further apart. The method is appropriate provided each site. A value of 1.0 indicates that there is no ten-that none of the frequencies of the four gametic types dency for differences to occur in runs. As expected for are too low: with rare alleles or small samples, values of frequent recombination, a test based on the occurrence
D51 will occur by chance, even with frequent recombi- of runs is unable to distinguish between clonality and nation. Conway et al. analyzed samples varying from complete linkage equilibrium, although for low values 66 to 124 isolates from single geographic regions and of R/M the ratio is usually.1.0.
included only loci at which the frequency of the com- Figure 1B plots the homoplasy ratio, H. The value mon allele did not exceed 0.9. Provided that data of rises continuously with R/M. Although the range of this type are available, the method is an effective one, values for a given r and m is rather large, no overlap but it lacks sensitivity applied to more restricted data occurred between values for R/M 50, 20, and 80. At sets. For the samples of 20 or 30 individuals from the least one can use H to distinguish between no recombi-simulated populations analyzed below, it failed to distin- nation, some recombination, and linkage equilibrium. guish between linkage equilibrium and clonality (data H5 0.5, a value not atypical for bacteria, implies that
TABLE 1
confirm the conclusion of Guttman andDykhuizen
(1994) that, in E. coli, recombination is more important Effect of mutation rate on the incompatibility ratio in
than mutation in generating genetic change in bacteria clonal populations
in the short term.
Finally, Figure 1C plots IR. Like H, this statistic rises Incompatibility ratio (IR)
Mutation Polymorphic
rate (m) sites (v) Mean Range
2 17.4 0.127 0–0.353
4 31.0 0.128 0–0.422
8 47.3 0.158 0.065–0.270
16 68.1 0.357 0.197–0.469
Population size is 100; number of sites is 100; sample size is 30.
continuously with R/M, but, as expected, its value in clonal populations is not zero. Table 1 shows how, in a clonal population, the value varies with different levels of genetic variability. Without an estimate of its expected value in clonal populations, the test cannot be used to distinguish between clonality and low levels of repeated recombination unless an “infinite sites” assumption is justified, in which case any incompatible pairs are evi-dence for recombination.
Note that recombination was reciprocal as for chro-mosomal genes of eukaryotes. Recombination in pro-karyotes differs in two respects: it is nonreciprocal and involves the insertion of relatively short pieces of DNA. It was not practicable to simulate nonreciprocal recom-bination because it would have a large effect in reducing genetic variability, given the small population sizes: this effect would be negligible in the large populations char-acteristic of bacteria. However, the results for H and IR should hold for bacterial populations. Populations were simulated in which short regions of 50 sites were recipro-cally exchanged. H and IR were then plotted against
R/M, with results (not shown) very similar to those in
Figure 1. There is, however, one context in which the prokaryotic type of recombination is likely to have re-sults different from the eukaryotic type. This is for the rate of decline in linkage disequilibrium with distance, which will depend on the size of the pieces transferred: this problem is worth further investigation.
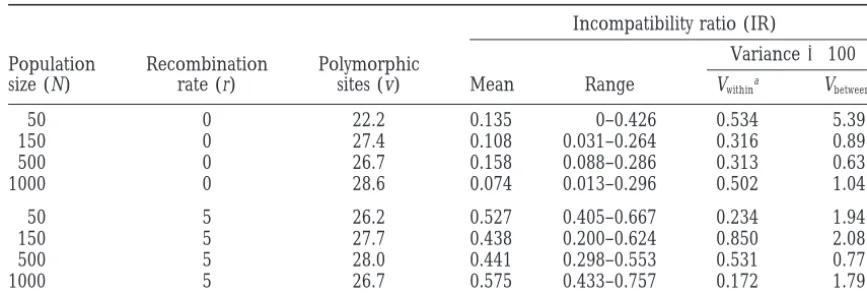
The effect of population size on the variance of these estimates is of some interest. Table 2 shows the effect on IR of varying N in clonal populations and in populations
Figure1.—Statistics calculated for simulated populations. Each point is the mean value of 10 samples, 2 from each of five populations; vertical lines indicate the range of values. Population size, N:h, 50;s, 100; ,, 200. Each population was run for 6N generations before sampling. Sites per gene, 100; sample size, 20; R, number of changes in a gene caused by recombination; M, number of changes caused by mutation.
R and M are summed over all individuals and generations.
TABLE 2
Effect of population size on estimates of the incompatibility ratio
Incompatibility ratio (IR)
Variance3100 Population Recombination Polymorphic
size (N) rate (r) sites (v) Mean Range Vwithina Vbetweenb
50 0 22.2 0.135 0–0.426 0.534 5.39
150 0 27.4 0.108 0.031–0.264 0.316 0.89
500 0 26.7 0.158 0.088–0.286 0.313 0.63
1000 0 28.6 0.074 0.013–0.296 0.502 1.04
50 5 26.2 0.527 0.405–0.667 0.234 1.94
150 5 27.7 0.438 0.200–0.624 0.850 2.08
500 5 28.0 0.441 0.298–0.553 0.531 0.77
1000 5 26.7 0.575 0.433–0.757 0.172 1.79
Sample size is 30; number of sites is 100; mutations per generation is 4.
aThe differences between two samples from the same population. bThe differences between five simulated populations.
with some recombination; similar results (not shown) the number of homoplasies depends onR(s2 d)h. In
the limit, when a whole gene is transferred, d5s, and
were obtained for the effect on H of varying N. The
variance between populations does not decrease with N. no homoplasies are caused.
A similar approach can be adopted for reciprocal For clonal populations, this is not unexpected. Statistics
such as H and IR depend on the form (topology and recombination with a single crossover point. The recom-bination event separated the gene into a shorter piece, branch lengths) of the phylogenetic tree. This does not
become uniform as the population gets larger. If one length d, and a longer piece, length s 2 d. Again, H
will depend onRdh, but, because the event is reciprocal,
imagines looking at the (true) phylogenetic tree of a
large population in successive generations, its form each crossover contributes 2dh to R. In plotting Figure 1, R was taken as the number of site changes caused by would not remain constant. Consider, for example, the
coalescence time of all members of a clonal population. recombination in the shorter gene region, summed over all chromosomes, and divided by Ns, where N is the This will usually increase by one in each generation but
occasionally decrease by some large number. That is, population size and s the number of sites per gene. The expected value of R/M can be calculated as fol-the tree changes discontinuously. It is fol-therefore not
surprising that statistics that depend on the tree (as do lows. Let the per generation mutation rate 5 u; the
probability that a site in two random individuals is occu-both H and IR) vary between large populations with the
same parameters. It was, at least to me, more surprising pied by a different allele5h; and the per gene
recombi-nation rate 5 sc. Then M 5 u and R 5 P (a gene
that the variance of IR does not decline with N in
popula-tions with recombination. undergoes a recombination event) 3 P (a particular
site is included in the inserted region) 3 h 5 sch/4. What do the statistics H and IRmeasure? In Figure
For a haploid population with only two alternative alleles 1, H and IR are plotted against R/M, where R is the
per site, h 52Nu/(11 4Nu), and the expected value probability, per generation, that a nucleotide will
of R/M is Nsc/2(1 14Nu). change because of recombination and M is the
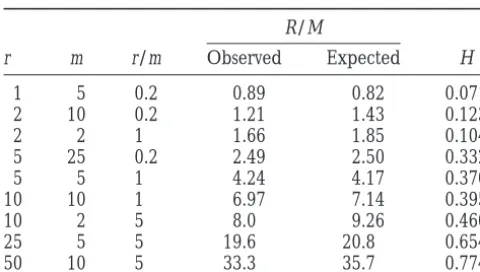
probabil-Table 3 shows expected and observed values of H and ity that it will change by mutation. M is simply the per
R/M for simulated populations with varying rates of
base mutation rate, but R is more complicated because
mutation and reciprocal recombination. With one mi-it depends not only on the recombination rate but also
nor exception, H increases monotonically with R/M. on the genetic distance between recombinants. In a
Simulations (not shown) of populations with reciprocal bacterial context, with one-way insertion of DNA
frag-exchange of short regions confirmed that H is a function ments, it is easy to interpret R. Imagine an insertion of
of R/M. Thus the answer to the question at the head length d into a region of length s. If d,s/2, the new
of this section is that H is a measure of R/M. gene will, at least approximately, occupy the same
posi-tion in a phylogenetic tree as it did before inserposi-tion, and the d inserted nucleotides may contribute homoplasies,
CONCLUSIONS
depending on the number of changed sites introduced:
TABLE 3 population is unknown unless an infinite sites model is appropriate for the data being analyzed.
Homoplasy ratio in simulated populations with
The homoplasy ratio, H, is a number whose expecta-varying values ofrandm
tion varies from 0 (clonality) to 1 (complete linkage equilibrium). It can therefore be used as a measure of R/M
the rate of recombination. But just what rate is being r m r/m Observed Expected H
measured? In simulated populations with a range of
1 5 0.2 0.89 0.82 0.071 values of recombination and mutation rates, H is a
func-2 10 0.2 1.21 1.43 0.123
tion of R/M, where M is the probability that, in a short
2 2 1 1.66 1.85 0.104
time interval, a nucleotide will alter as a result of
muta-5 25 0.2 2.49 2.50 0.332
tion, and R is the probability that it will be altered by
5 5 1 4.24 4.17 0.370
a recombination event. In a bacterial population, R is
10 10 1 6.97 7.14 0.395
10 2 5 8.0 9.26 0.460 easy to interpret because recombination events usually
25 5 5 19.6 20.8 0.654 consist of the insertion of a short region of DNA. The 50 10 5 33.3 35.7 0.774 value of R will depend on the frequency of such events,
the length of the inserted regions, and the genetic
dis-Population size is 100; number of sites is 100; sample size
is 20. tance between donor and recipient. In eukaryotes, inter-pretation is less obvious. Recombination gives rise to two new sequences, each consisting of a region from ognizing the presence of runs of linked nucleotides each parent. Which parent, then, is to be regarded as with distinct ancestries. Incompatibility and partition the “donor” of novel nucleotides? The answer is that matrices can be used to give a visual impression that such the shorter of the two regions is to be treated as “do-runs are present before statistical testing (Jakobsenet nated” DNA. Although an intuitive justification for this al. 1997). However, it is not clear that such matrices procedure can be given, the real justification is that, if
offer any advantage over the more obvious procedure R is calculated in this way, H proves to be a monotonic of inspecting a printout of all informative sites in a set function of R/M.
of sequences. The statistical significance of any runs sugested by such an inspection can be tested by the
maximum Chi-square method (Maynard Smith1992)
LITERATURE CITED
or in other ways.
Brown, A. H. D., M. W. FeldmanandE. Nevo, 1980 Multilocus Such procedures are already familiar. The main point
structure of natural populations of Hordeum spontaneum. Genetics of this article is to point out that they are ineffective in
96:523–536.
detecting repeated recombination between the mem- Bulmer, M.,1988 Are codon usage patterns in unicellular organisms determined by selection-mutation balance? Genetics 96: 15–26. bers of a population because repeated recombination
Burt, A., V. KoufopanouandJ. W. Taylor,1999 Population genet-breaks up the runs of linked nucleotides on which they
ics of human-pathogenic fungi, in The Molecular Epidemiology of depend. In the limit, in a population in linkage equilib- Infectious Diseases, edited byR. C. A. Thompson.Chapman & Hall rium, there is no association between neighboring nu- (in press).
Conway, D. J., C. Roper, A. M. J.Oduola, D. E. Arnot, P. G.
Krems-cleotides and hence no runs.
neret al., 1999 High recombination rate in Plasmodium falci-Several methods of detecting repeated recombina- parum. Proc. Natl. Acad. Sci. USA (in press).
tion are described here, and their effectiveness is com- Dowson, C. G., A. E. Jephcott, K. R. GoughandB. G. Spratt,1989 Penicillin-binding protein 2 genes of non-lactamase-producing, pared on simulated populations. The homoplasy test
penicillin-resistant strains of Neisseria gonorrhoeae. Mol. Microbiol. (Maynard SmithandSmith1998) compares the ob- 3:35–41.
served number of homoplasies in a maximum-parsi- Eyre-Walker, A., N. H. SmithandJ. Maynard Smith,1999 How clonal are human mitochondria? Proc. R. Soc. Lond. Ser. B 266: mony tree of the sequences with the number expected
477–483. in the absence of recombination. It has the advantage
Guttman, D. S.,andD. E. Dykhuizen,1994 Clonal divergence in that the number of homoplasies expected in an equally Escherichia coli is a result of recombination, not mutation. Science variable clonal population can be estimated so that the 266:1380–1383.
Hagelberg, E., N. Goldman, P. Lio, S. Whelan, W. Schiefenhovel
evidence for recombination can be tested. It has the
et al., 1999 Evidence for mitochondrial DNA recombination in drawback, however, that it depends on finding a maxi- a human population of island Melanasia. Proc R. Soc. Lond. Ser. mum-parsimony tree for the data, which is time consum- B 266: 485–492.
Haubold, B., M. Travisano, P. B. RaineyandR. R. Hudson,1998 ing and inaccurate for large data sets. This difficulty
Detecting linkage disequilibrium in bacterial populations. Genet-can be met by analyzing a subset of, say, 30 sequences. ics 150: 1341–1348.
An alternative is the incompatibility ratio, which com- Hein, J.,1990 Reconstructing evolution of sequences subject to re-combination using parsimony. Math. Biosci. 98: 185–200. pares the number of pairs of sites that are
phylogeneti-Holmes, E. C., M. WorobeyandA. Rambaut,1999 Phylogenetic cally incompatible with the number expected in a
pan-evidence for recombination in Dengue virus. Mol. Biol. Evol. 16: mictic population. The statistic is easy to compute but 741–749.
number of recombination events in the history of a sample of Sawyer, S. A.,1989 Statistical tests for detecting gene conversion. Mol. Biol. Evol. 6: 526–538.
DNA sequences. Genetics 111: 147–164.
Jakobsen, I. B.,andS. Easteal,1996 A program for calculating Sneath, P. H. A., M. J. SackinandR. P. Ambler,1975 Detecting evolutionary incompatibilities from protein sequences. Syst. Zool. and displaying compatibility matrices as an aid in determining
reticulate evolution in molecular sequences. Comput. Appl. 24:331–332.
Spratt, B. G., L. D. Bowler, Q-Y. Zhang, J. ZhouandJ. Maynard Biosci. 12: 291–295.
Jakobsen, I. B., S. R. WilsonandS. Easteal,1997 The partition Smith, 1992 Role of interspecies transfer of chromosomal genes in the evolution of penicillin resistance in pathogenic and matrix: exploring variable phylogenetic signals along nucleotide
sequence alignments. Mol. Biol. Evol. 14: 474–484. commensal Neisseria species. J. Mol. Evol. 34: 115–125. Lewontin, R. C.,1964 The interaction of selection and linkage. I. Stephens, J. C.,1985 Statistical methods of DNA sequence analysis:
General consideration of heterotic models. Genetics 49: 49–67. detection of intragenic recombination or genic conversion. Mol. Maynard Smith, J.,1992 Analyzing the mosaic structure of genes. Biol. Evol. 2: 539–556.
J. Mol. Evol. 34: 126–129. Suerbaum, S., J. Maynard Smith, K. Bapumia, G. Morelli, N. H. Maynard Smith, J.,andN. H. Smith,1998 Detecting recombina- Smithet al., 1998 Free recombination within Helicobacter pylori.
tion from gene trees. Mol. Biol. Evol. 15: 590–599. Proc. Natl. Acad. Sci. USA 95: 12619–12624. Maynard Smith, J., N. H. Smith, M. O’RourkeandB. G. Spratt,
1993 How clonal are bacteria? Proc. Natl. Acad. Sci. USA 90: