Transactions,SMiRT-23 Manchester, United Kingdom - August 10-14, 2015
Division V, Paper ID 734
RANDOM VIBRATION THEORY (RVT) BASED SASSI ANALYSIS FOR
NUCLEAR STRUCTURES FOUNDED ON SOIL AND ROCK SITES
Dan M. Ghiocel 1
1Chief of Engineering, Ghiocel Predictive Technologies, Inc., New York, USA
ABSTRACT
The RVT SSI approach is based on the random vibration theory (RVT) applicable to linear time-invariant dynamic systems excited by Gaussian processes. The advantages of RVT are related to the analysts’
convenience for not using input acceleration time histories for the SSI analysis. The RVT SSI approach uses the direct analytical relationship between the power spectral density (PSD) functions and the response spectra (RS). Three different analytical formulations for the PSD-RS transformation were considered. The three analytical formulations were implemented using the acceleration, velocity and displacement ground response spectra as inputs. The RVT SSI analysis results include two case studies: i) the EPRI AP1000 NI stick model and ii) a deeply embedded SMR FE shell model. The in-structure response spectra (ISRS) computed using the RVT SSI analysis were compared with the “reference”ISRS computed by traditional SSI analysis using input acceleration time histories. The “reference”ISRS were computed using either deterministic SSI or probabilistic SSI with randomized seismic inputs based on the recommendations of the new ASCE 04-2015 standard. Both rock and soil sites are considered. It is shown that the RVT SSI analysis results are quite sensitive depending on the particularity of the analytical approach used for computing the RS from the PSD functions. Conclusions and guidelines on the application of the RVT SSI approach are provided.
RANDOM VIBRATION THEORY SSI APPROACH
The random vibration theory (RVT) approach uses the analytical relationship between the power spectral density functions and the response spectra. The RVT approach is based on the linear random vibration theory applicable to linear time-invariant dynamic systems excited by Gaussian stationary processes. For such systems, the dynamic responses are also Gaussian processes. The RVT approach has the advantage that computes the SSI response of a deterministic SSI system using directly the ground response spectra (GRS) input without the need of developing compatible input acceleration time histories. Herein, the RVT approach is applied in conjunction with the SSI methodology based on complex frequency response method were the input and outputs are defined by their power spectral density functions (PSD). Assuming that the seismic input and SSI response motions are realizations of a Gaussian stationary process, the RVT approach computes directly the ISRS any location within the structure from the PSD functions associated to the SSI response motions. To compute RS from PSD, the maximum of the stochastic
response is determined by solving the “first-passage problem” of a single-degree of freedom (SDOF) oscillator under a Gaussian process input motion that represents the SSI response motion at the selected location.
The implemented RVT SSI approaches include several options related to the PSD-RS transformation. These options are related to the stochastic approximation models used for computing the maximum SSI response of a SDOF system over a time period T, i.e. during the earthquake intense motion time interval. The maximum SSI response of the SDOF system that represents the RS amplitude can be expressed by using peak factors that are applied to the stochastic motion standard deviation (RMS). These quantities depend on the duration T, the mean crossing rate of the motion and probability level associated to the
maximum value of the stochastic response for a given motion duration, T. The motion duration T should correspond to the stationary, intense part of the motion that can be defined as the time for the accumulated energy of the input motion to increase from 5% to 75% of its total energy (Arias Intensity).
The basic RVT relationship applicable to the RVT SSI analysis in frequency domain relates the SDOF oscillator response motion PSD
S
( )
ω
X
at location of interest
to the input ground motion PSDS
u( )
ω
:( )
ω H( )
ω H( )
ω S( )
ωSX = SSI 2 0 2 u
(1)
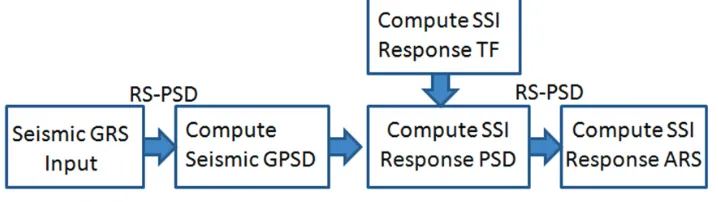
The maximum extreme amplitude valued of the SDOF system motion represents the RS amplitude. The RVT SSI analysis flowchart for computing acceleration response spectra (ARS) at a selected location is shown in Figure 1. The input is the input ground response spectra (GRS) and the end output is the ARS at the location of interest within structure. There are three major computational steps: 1) Compute the input GPSD from input GRS, 2) Compute SSI response PSD by convolving the input GPSD computed in Step 1 with the square amplitudes of the SSI system and the SDOF system transfer functions, consistent with equation 1, and 3) Compute the response ARS at given location based on the SSI response PSD computed in Step 2.
Figure 1 RVT-based Flowchart for ISRS Computations
To compute the ARS that is the maximum acceleration response of the SDOF mounted on the structure,Xmax,P
, for
a given non-exceedance probability P,
first, the response peak factorp
P that corresponds to the given probability level P should be computed, and then, applied to the standard deviation,s
X, of the Gaussian process X:Xmax,P = pP
s
X (2)There are also approaches that use mean peak factors, not probability level peak factors. To compute the mean maximum response, Xmax, the mean response peak factor p and the standard deviation
s
Xof the process X need to be determined. Then, mean maximum response is computed simplyX
p
Xmax =
s
(3)where
ò
¥( )
¥-=
w
w
s
XS
Xd
2
in which
S
X( )
w
is the PSD of the stochastic response.Similarly, using a peak factor q, the standard deviation of maximum response
max
X
s
can be computed byX X q
s
s
=max (4)
Herein, three analytical formulations were used to compute the response peak factors:
1) MK or MK-UK Approach: Maharaj Kaul-Unruh-Kana formulation uses the response peak factor given the non-exceedance probability P (Unruh and Kana, 1981):
where
w
0is the circular frequency of interest for maximum response computation. It should be
noted that the MK-UK formulation provides directly the probability-level maximum response for
a given non-exceedance probability
P
.
2) AD Approach: Alan Davenport formulation (AD) uses peak factors, p for the mean of the maximum response (Davenport, 1964) and q for the standard deviation the maximum response (Igusa and Der Kiureghian, 1983):
( )
( )
T
T
p
0 0ln
2
5772
.
0
ln
2
n
n
+
=
(6)
( )
[
(
( )
)
3.2]
0 013
2
ln
4
.
5
ln
2
2
.
1
T
T
q
n
n
-
+
=
(7)
where
the mean crossing rate is defined by
2 0 0
1
l
l
p
n
=
in which
l
0=
ò
¥( )
¥
-=
w
w
s
X2S
Xd
and
2 2
s
X&l
=ò
¥( )
¥
-=
w
S
Xw
d
w
2
.
3) AD-DK Approach. Alan Davenport-Der Kiureghian formulation (AD-DK) uses peak factors, p for the mean of the maximum response corrected for the motion spectral shape and q for the standard deviation the maximum response (Igusa and Der Kiureghian, 1983):
( )
( )
T
T
p
e en
n
ln
2
5772
.
0
ln
2
+
=
(8)
( )
[
(
( )
)
3.2]
ln
2
13
4
.
5
ln
2
2
.
1
T
T
q
e en
n
-
+
=
(9)
where
(
)
(
0.45 0)
e 0
0
max 2.1, 2
T
T
1.63
0.38
T
T
ì
dn
ï
n
=
í
d
-
n
ï
n
î
; 0
0.1
; 0.1
0.69
; 0.69
1
< d £
< d <
£ d <
(10)
in which the frequency content shape factor is
2 1
0 2
1 l
d =
-l -l
in which
l
1=
ò
( )
¥¥
-
w
S
Xw
d
w
Using MK-UK approach, the probability-level SSI response is computed directly. For the AD and AD-DK approaches, firstly, the 1st and 2nd order statistical moments of the maximum response are computed. Then, the probability-level SSI responses for a given non-exceedance probability, P, could be further computed using either the Gumbel or the Lognormal probability distribution.
The above three analytical formulations used for the PSD-RS transformation were implemented in the ACS SASSI Option RVT software (2015) that was used to produce the results shown in this paper.
CASE STUDIES
The RVT-based SSI analysis results include two case studies: i) the surface EPRI AP1000 NI stick model and ii) a deeply embedded SMR shell FE model. Both rock and soft soil site conditions were considered.
Surface EPRI AP1000 Stick Model:
The surface EPRI AP1000 SSI stick model was considered with a deep soft soil site (Vs = 1,000 fps) and a uniform rock site (Vs=6,000 fps). Herein, the mean ISRS computed using the RVT SSI approach and probabilistic SSI approach. The probabilistic SSI approach was based on 30 randomized LHS simulations of the seismic input as recommended by the ASCE 04-2015 standard (Section 5.5). The site-specific GRS spectral shapes were randomized as described in a separate paper (Ghiocel, 2015). No random variability was assumed for soil profile or structural properties (assumed with uncracked concrete and 4% damping).
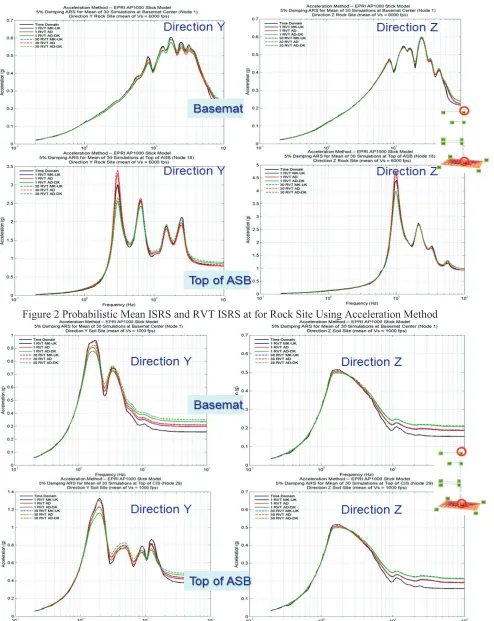
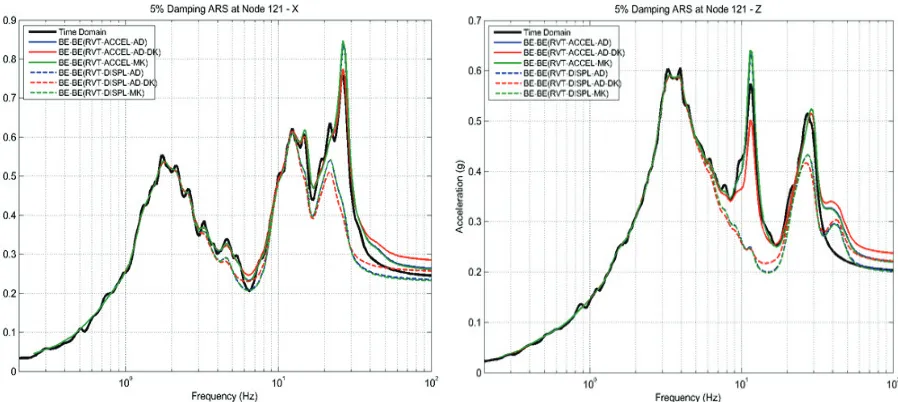
Figures 2 and 3 show the 5% damping ISRS computed at two locations, at basemat and higher elevations, within the AP1000 NI stick using the Acceleration Method for the rock and soil site, respectively. The RVT ISRS were computed using i) a single RVT run for the mean GRS input, and ii) 30 RVT runs for the 30 LHS randomized spectral shape samples of the GRS input.
Figure 2 results, obtained for the rock site, show that mean ISRS computed using RVT compare quite reasonably with the “reference” mean ISRS computed using the 30 LHS randomized GRS input samples. It should be noted that for the higher elevation location the mean RVT ISRS are 15-20% different than the reference mean ISRS. The MK-UK and AD provide higher ISRS peaks, while AD-DK provides lower ISRS peaks than the reference ISRS. Figure 3 results, obtained for the soft soil site, show that mean ISRS computed using RVT are slightly lower, by up to 10-15%, than the reference mean ISRS. The most accurate results are obtained for MK-UK and AD using 30 RVT runs for the 30 GRS input samples rather than a single RVT run for the mean GRS input. It should also be noted that in the high frequency range the RVT ISRS are always higher by 20-30% than the reference mean ISRS.
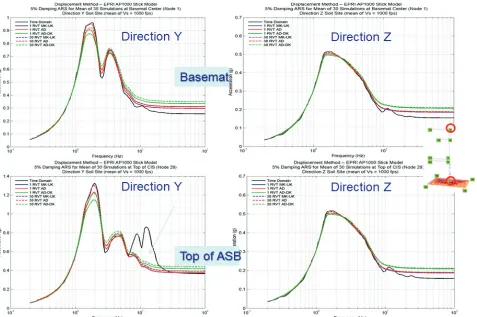
Figures 4 and 5 repeat the same SSI results as in Figures 2 and 3 using the Displacement Method. The ISRS comparisons for the rock and soil sites in Figures 4 and 5 show identical with the ISRS shown in Figures 2 and 3, with the exception of the mean ISRS peaks at 9 Hz and 13 Hz for the higher elevation location which are fully truncated by the RVT approach for the soil site. This ISRS peak truncation of the 3rd and 4th ISRS peak at the higher elevation location appears as a surprise, given the good behaviour of the RVT Displacement Method for the other frequency ranges and the computed RVT ISRS at the basemat level.
The RVT Displacement Method follows the detailed algorithm description provided in the paper referenced by the new ASCE 04-2015 standard for the RVT SSI approach. Thus, the Figures 4 and 5 results indicates that for the soft soil sites the RVT Displacement Methods may fail to predict correctly some ISRS peaks in the mid frequency range.
Figure 2 Probabilistic Mean ISRS and RVT ISRS at for Rock Site Using Acceleration Method
Figure 4 Probabilistic Mean ISRS and RVT ISRS at for Rock Site Using Displacement Method
Deeply Embedded SMR Model:
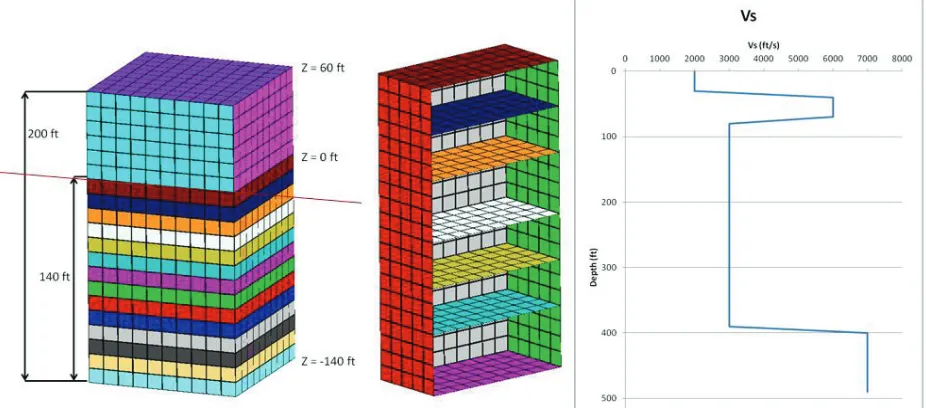
Figure 6 (left) shows the SMR SSI model considered for the study. The SMR structure has a size of 200ft x 100ft x 100ft (H x L x W) and an embedment of 140ft depth. The soil profile shown in Figure 6 (right) is highly non-uniform with a soil stiffness inversion within the SMR embedment depth. The seismic control motion was input at the foundation level (FIRS) at 140ft depth (elevation 0ft).
Figure 6 140ft Embedded SMR SSI FE Model (left) and Nouniform Soil Profile (right)
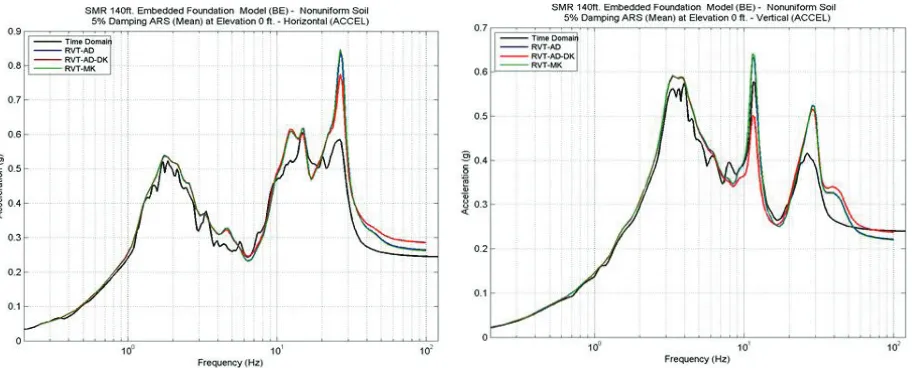
Figure 7 and 8 show a comparison of the 5% damping mean ISRS computed using the RVT SSI approach and “standard” deterministic SSI approach as the reference approach. The RVT SSI approach results includes the MK-UK, AD and AD-DK PSD-RS transformation options implemented for the Acceleration (solid lines) and Displacement (dotted lines) methods. The “standard” deterministic SSI approach (black line) uses the mean ISRS computed for 5 (five) sets of input acceleration histories compatible with the FIRS input. The input acceleration histories were computed as in-column FIRS motions from the outcrop FIRS motion via the site response analysis. It should be note that the input acceleration histories have a total duration of 20 seconds. For the RVT approach, it was assumed that the intense, stationary segment of the SSI motion duration is 10 seconds that appears to be a quite likely value for a 20 seconds simulated earthquake motion.
Figures 7 and 8 ISRS comparisons indicate similar trends as previously noted for the surface EPRI AP1000 stick model. The mean RVT ISRS computed using MK-UK (green line) and AD (blue) algorithms with the Acceleration Method (solid lines) are by 15-20% different than the reference mean ISRS computed with the deterministic SSI approach (black solid line). The MK-UK and AD algorithms provide basically identical results with slightly higher ISRS peaks than deterministic ISRS peaks in mid and high frequency range. However, the AD-DK algorithm (red line) fails to provide reasonable results for all locations. The Displacement Method (dotted lines) provides very poor results with missing ISRS peaks. For very low frequency below 3 Hz, all RVT approaches provide good accuracy.
Figure 7 Horizontal and Vertical Mean ISRS at Basemat Elevation (0 ft) Using RVT SSI MK-UK, AD and AD-DK with Acceleration (solid line) and Displacement (dotted) Methods and Deterministic SSI
Approach Using Average ISRS for 5 FIRS Compatible Acceleration Input Sets (black line)
Figure 8 Horizontal and Vertical Mean ISRS at Roof Elevation (200 ft) Using RVT SSI MK-UK, AD and AD-DK with Acceleration (solid line) and Displacement (dotted line) Methods and Deterministic SSI
Approach Using Average ISRS for 5 FIRS Compatible Acceleration Input Sets (black line)
Further, the RVT SSI approach is compared with the probabilistic SSI approach. For probabilistic SSI, the outcrop FIRS spectral shapes were randomized based on the probabilistic site response analysis, as described in a separate paper (Ghiocel, 2015). No random variability was assumed for the soil profile or structural properties (assumed with uncracked concrete and 4% damping).
MK-UK and AD algorithms provide mean ISRS that are by 20% lower than the reference mean ISRS computed using the probabilistic SSI simulations.
Figure 9 Horizontal and Vertical Mean ISRS at Basemat Elevation (0ft) Using RVT SSI MK-UK, AD and AD-DK with Acceleration Method (colored) Vs. 60 Randomized FIRS Input Samples (black)
Figure 10 Horizontal and Vertical Mean ISRS at Roof Elevation (200ft) Using RVT SSI MK-UK, AD and AD-DK with Acceleration Method (color) Vs. 60 Randomized FIRS Input Samples (black)
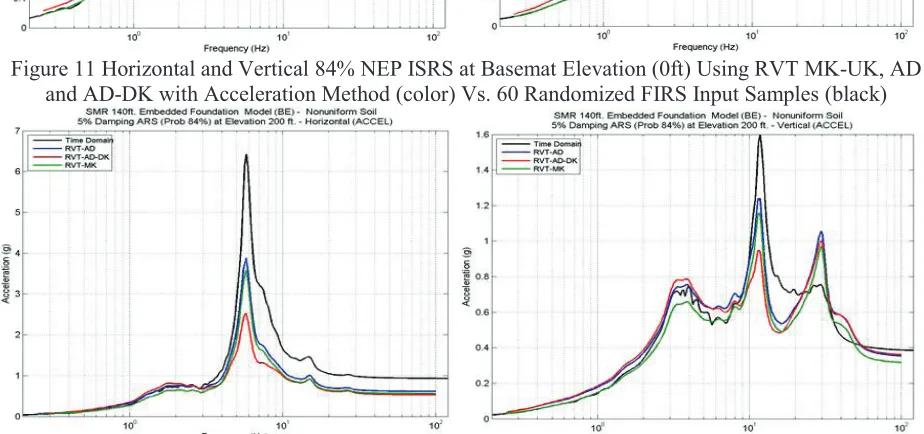
Figures 11 and 12 show comparisons between the 84% NEP ISRS computed using the RVT SSI approach (colored lines) and the probabilistic SSI approach (black line). It should be noted that all the RVT SSI approach algorithms produce highly unconservative, unacceptable results for the 84% NEP ISRS computed at the SMR roof elevation (200 ft). The RVT SSI approach results are better at the basemat level, but by at least 20% unconsevative for some ISRS peaks at the higher elevation.
Figure 11 Horizontal and Vertical 84% NEP ISRS at Basemat Elevation (0ft) Using RVT MK-UK, AD and AD-DK with Acceleration Method (color) Vs. 60 Randomized FIRS Input Samples (black)
Figure 12 Horizontal and Vertical 84% NEP ISRS at Roof Elevation (200ft) Using RVT MK-UK, AD and AD-DK with Acceleration Method (color) Vs. 60 Randomized FIRS Input Samples (black)
CONCLUSIONS
Based on the research investigations included in this paper, the application of the RVT SSI approach appears to be limited to the approximation of the mean ISRS based on the Acceleration Method with the MK-UK and AD algorithms, especially for the soft soil sites. The Displacement Method fails sometimes to provide reasonable results for soft soil sites. All RVT algorithms fail to provide reasonable estimates for the 84% NEP ISRS. The RVT SSI approach accuracy varies widely on a case-by-case basis. In this paper we selected bad case study examples. There are also better situations, especially for surface models.
We believe that additional, in-depth validation studies of the RVT SSI approaches should be performed by the SSI analysts before accepting them for application to nuclear projects. This paper is a warning on the application of the RVT SSI approaches without a sufficient validation on a case-by-case basis.
REFERENCES
Ghiocel, D. M. (2015). “Probabilistic-Deterministic SSI Studies for Surface and Embedded Nuclear Structures on Soil and Rock Sites”, the SMiRT23 International Conference, Division V, Paper #107,