Transactions of the 17th International Conference on Structural Mechanics in Reactor Technology (SMiRT 17) Prague, Czech Republic, August 17 –22, 2003
Paper # W01-1
Qualification Tests of Surface Decontamination on Low Activity Structural
Material of the Caorso Nuclear Power Plant.
Franco Giuseppe Cesari(1), Luigi Andrea Terzi(1), Paolo Battistella(1), Claudia Foletti(1), Renzo Guerzoni(2),
Franco Bozzini(2)
(1) University of Bologna (2) Sogin SPA, Caorso NPP
ABSTRACT
The Caorso’s Nuclear Power Plant (BWR, 870 MWe), located near Piacenza, Italy, is now involved with the decommissioning process. The plant needs to proceed with the decontamination of a lot of low-level activity material, in order to get to the free release.
The Caorso’s plant has fully worked on for a very short period of time, by 1981 to 1986, and has been shut down since then. No significative structural damage on fuel assemblies has occurred during the lifetime of the plant. This explains why the level of activity on the components surface is quite low. Approximately the 90% of the whole material shows a superficial activity minor then 3 Bq/cm2, quite near the free release level of 1 Bq/cm2.
The University of Bologna, in collaboration with Caorso service, has started doing a testing campaign with the intent of qualifying the chemical off-line decontamination method suggested by the plant management.
On indication of the NPP has been taken H3PO4 as a chemical reagent. The plant put aside his “hot chemical
laboratory”, situated in the “controlled zone”.
Specimens to be used in the decontamination process have been taken away from the piping connecting the high-pressure section with low-high-pressure side of the turbine. They are made of carbon steel. This choice is due to the fact that the oxide layer covering the specimens is, by now, the harder and thicker found on the plant.
It is important to notice that the contamination seems to be totally located on the external layer of the oxide recovering the surface of the metal. No significative penetration has been found.
The tests are exploring the effects of changing the process temperature or the concentration of the solution of phosphoric acid on the decontamination method.
By particular interest is the qualification of the time occurred to obtain a complete decontamination, strictly under the limit of free release, in relation with the starting level of activity.
By the examinations of the results obtained can be drown some general considerations:
The method is easy to be applied in decontaminating component surfaces and seems to be functional to any kind of geometry.
The acid solution considered could be able to perform a good decontamination on many materials.
The concentration of acid is a relevant factor, along with temperature, in cleaning and de-oxidizing the component surface. A correct choice of these parameters can leave the surfaces polished but not deeply attacked.
The experience gained with this campaign has allowed to validate the method and his capability of obtaining cheaply, quickly and safely the decontamination of low-level activity structural material.
KEY WORDS
Decommissioning, decontamination, nuclear, power plant, carbon steel, acid attack, oxide film, water reactor, off-line methods, decontamination factor.
INTRODUCTION
The Caorso’s Nuclear Power Plant has been built up in the 70s. At the end of 1977 the plant reached its first criticality, and it started to work out regularly in 1981. Based on a project of the General Electrics, the NPP is a BWR kind, 870 MWe (2600 MWt), equipped with a Mark II container.
On October 1986 the plant was stopped, due to a standard refueling operation. By then it was never restarted and it was definitely shut down after the italian poll about use of nuclear power on November 1987.
The plant, which has fully worked from 1981 to 1986, has produced altogether 29 TWh. In the 2000 the decommissioning strategy was changed.
From the SAFESTORE strategy, previously set up, it was decided to begin a phase of deactivation speed up, DECON1 strategy, with the intent of getting to the "green field conditions" as soon as possible.
1SAFESTORE: The plant is kept in conservation state for an interval of time of the 30-60 year order; the necessary dismantling activities are those
for the simple security keeping.
With this new optic of a quick dismantling of the plant, the demand to improve the knowledge concerning the techniques of decontamination has become indispensable.
Decontamination will regard, in particular, those systems that turn out to be superficially contaminated, while there are not foreseen interventions on the activated material, which is found inside the vessel.
Superficial contamination, measured in Bq/cm2, is properly the formation of deposits of radioisotopes on the most
outside layer of the structural material, generally a film of iron oxide. This is the principal kind of radioactive contamination form in a water nuclear power plant.
The material that will be exposed to decontamination is essentially carbon steel and, in less measure, stainless steel. The superficial contamination level measured on the plant is quite low, if compared to similar reactors.
This fact was quite expected and there are some reasons that can easily explain it: • A careful management of the chemistry of water of the primary circuit; • No particular complication happened during the operations of the plant; • The plant has fully worked for a few total years.
This leads to the fact that the largest part of the structural material, which will be involved in the decontamination process, can be considered as low level radioactive.
The characterization campaigns made on the systems of the plant have allowed to establish the isotopic composition of the superficial contamination. The total level of superficial contamination is principally due to Co60, which is by now
the reference isotope. It has been noticed even the presence of Ni59, Ni63, Sb125, Fe55 and minimum tracks of the isotope
of Caesium, Cs137.
Between the various types of off-line decontamination methods, the chemical ones have been taken immediately into consideration as some of the most effective; moreover they appears to be the most ductile. In this optics the University of Bologna, in narrow cooperation with the staff of the plant, has realized a campaign of experimental tests, to verify the real effectiveness of this decontamination process. The tests have been set up using phosphoric acid (H3PO4) as a
solvent.
The phosphoric acid removes the external layer of oxide that covers the outside surface of the material, where is located the radioactive contamination, according to the typical following reaction:
Fe2O3 + 2H3PO4↔ 2FePO4 + 3H2O
In this formula we have considered the superficial oxide as represented by hematite (chemical formula Fe2O3). This
assumption was made on the basis of previous investigations on the oxide. There are at least two reasons to justify the choice of phosphoric acid:
• Some previous acid attack experiences, executed by the plant staff, where just H3PO4 was used as a solvent; • The possibility to realize, through an electropolishing process, the stainless steel decontamination.
The testing campaign has taken place in the chemical laboratories of the Caorso nuclear plant.
SELECTION AND PREPARATION OF THE SAMPLE
The specimens have been withdrawn by a deflector, which is piping connecting the high-pressure section with the low-pressure side of the turbine.
The working steam flow of the piping system was 1010 t/h; the working temperature, in this section, was about 205 °C, for a pressure of 17 Atm (damp steam).
The material is carbon steel, A106/B.
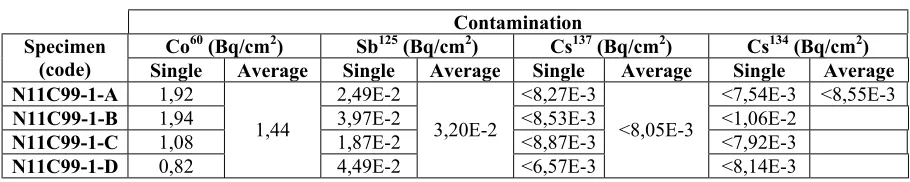
Table 1 shows the superficial contamination level measured on the member in the characterization phases. The values are made topical to the June 2002, period of development of the tests.
Table 1. Deflector N11C99-1; measured contamination levels, main isotopes.
Contamination
Co60 (Bq/cm2) Sb125 (Bq/cm2) Cs137 (Bq/cm2) Cs134 (Bq/cm2)
Specimen
(code) Single Average Single Average Single Average Single Average
N11C99-1-A 1,92 2,49E-2 <8,27E-3 <7,54E-3 <8,55E-3
N11C99-1-B 1,94 3,97E-2 <8,53E-3 <1,06E-2
N11C99-1-C 1,08 1,87E-2 <8,87E-3 <7,92E-3
N11C99-1-D 0,82
1,44
4,49E-2
3,20E-2
<6,57E-3
<8,05E-3
<8,14E-3
• The average superficial contamination level was one of the highest between all the specimens available in the plant. This allows to qualify the method for an adequate activity level, over the free release limits. Moreover, the higher the starting superficial contamination is, the more reliable are the evaluations above the DF (Decontamination Factor). In fact, DF is strictly depending on the starting activity level, and if that is too low, the test results could be considered non-significative;
• The specimens are made of carbon steel, like the most part of the components of the plant that should be decontaminated to be free released;
• The location of the sample chosen. Some investigations on the consistency of the superficial oxide have shown how, especially in this plant side, the oxide turns out quite hard and hard removable.
Here it was found out the presence of calamine, a form of black and reddish oxide particularly resisting. The specimens, obtained by the sample originally called N11C99-1-A, have been cut with a belt-saw.
A number of 13 specimens, of the approximate surface size of 3 X 3 cm has been prepared. The thickness of any of it was about 0,7 cm. This kind of geometry has been chosen for measure demands.
Each specimen has been associated to an acronym, given by code of the sample, N11C99-1-A, and a further progressive letter corresponding to the cut order.
Any specimen has been put in a transparent plastic container of cylindrical form and this all was placed in a plastic envelope. The material has been moved in one of the chemical laboratory of the plant.
DESCRPTION OF THE TESTS
The starting level of activity of any specimen was measured before the beginning of every test, by means of a γ-spectrometer. The contamination is due substantially to Co60.
This was the only relevant radioisotope whose presence was revealed in the characterization campaigns on the sample N11C99-1-A, as shown in Table 2.
The measured activity has been expressed in absolute value, so measured in Bq, and later it was normalized to a specific activity (Bq/cm2).
The initial weight is listed in the Table 4.
The tests have been set up changing some fundamental parameter in each one, to see the effect of any of these. The parameters changed are:
• The concentration in volume of the phosphoric acid in the water solution. We have used solutions starting at concentrations from 20% to 30% and up to 40%;
• The temperature of the process. Every test has been done at a constant temperature, some test was made at a temperature of 20°C, some at a temperature of 40°C and, finally, some at 60°C.
A heater has been used to heat up the solution and a thermometer controlled the system;
• The total length of the process. A process of the at least 4 hour duration was initially considered to complete the treatment. On the basis of the obtained results it was modified also how long a process could last, trying to test shorter treatments.
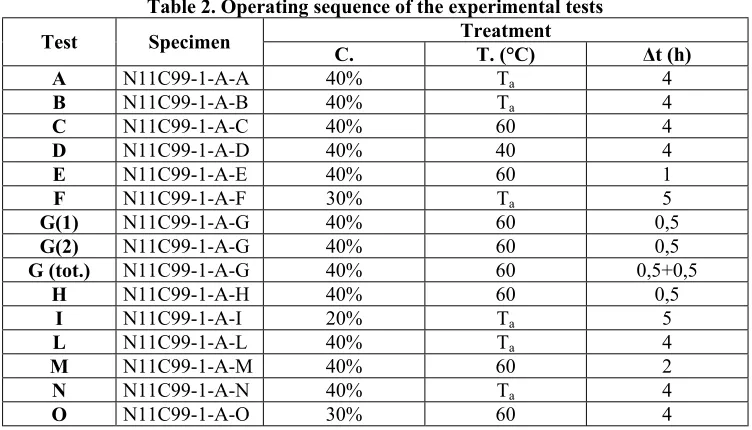
Table 2 shows the sequence of tests effectively applied to each of the 13 specimens.
Table 2. Operating sequence of the experimental tests Treatment
Test Specimen C. T. (°C) ∆t (h)
A N11C99-1-A-A 40% Ta 4
B N11C99-1-A-B 40% Ta 4
C N11C99-1-A-C 40% 60 4
D N11C99-1-A-D 40% 40 4
E N11C99-1-A-E 40% 60 1
F N11C99-1-A-F 30% Ta 5
G(1) N11C99-1-A-G 40% 60 0,5
G(2) N11C99-1-A-G 40% 60 0,5
G (tot.) N11C99-1-A-G 40% 60 0,5+0,5
H N11C99-1-A-H 40% 60 0,5
I N11C99-1-A-I 20% Ta 5
L N11C99-1-A-L 40% Ta 4
M N11C99-1-A-M 40% 60 2
N N11C99-1-A-N 40% Ta 4
O N11C99-1-A-O 30% 60 4
Specimen G was submitted to a two phases-treatment, each phase of half an hour duration.
Specimen O has been painted on four lateral sides, so as to limit the most possible attack to the base metal and the consequent hydrogen production, developed by the following reaction:
Fe + H3PO4 ↔ FePO4 + 3/2H2
After the chemical treatment, every specimen has been analyzed in γ-spectrometer to measure the residual activity. Afterwards every specimen has been weighed.
EXPOSURE AND ANALYSIS OF THE RESULTS
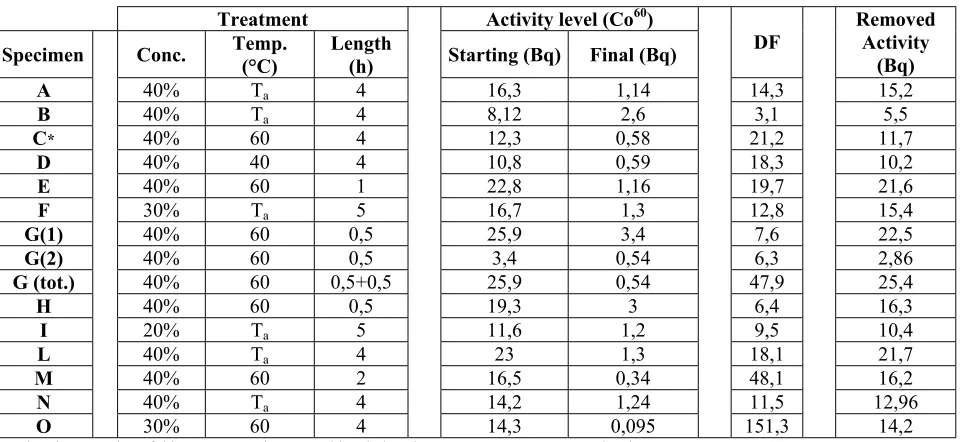
In the Table 3 are synthetically listed the data of the decontamination activity.
It is shown, for every test, the starting contamination level, the residual contamination, the Decontamination Factor (DF) and the total activity removed from each specimen.
The DF parameter is defined as follows:
f i
C
C
=
DF
Ci =starting contamination; Cf = final contamination
As a first consideration it is evident that the real effectiveness of the process is strongly linked to the starting contamination level2.
Table 3. Test outputs.
Treatment Activity level (Co60)
Specimen Conc. Temp. (°C) Length (h) Starting (Bq) Final (Bq) DF
Removed Activity
(Bq)
A 40% Ta 4 16,3 1,14 14,3 15,2
B 40% Ta 4 8,12 2,6 3,1 5,5
C* 40% 60 4 12,3 0,58 21,2 11,7
D 40% 40 4 10,8 0,59 18,3 10,2
E 40% 60 1 22,8 1,16 19,7 21,6
F 30% Ta 5 16,7 1,3 12,8 15,4
G(1) 40% 60 0,5 25,9 3,4 7,6 22,5
G(2) 40% 60 0,5 3,4 0,54 6,3 2,86
G (tot.) 40% 60 0,5+0,5 25,9 0,54 47,9 25,4
H 40% 60 0,5 19,3 3 6,4 16,3
I 20% Ta 5 11,6 1,2 9,5 10,4
L 40% Ta 4 23 1,3 18,1 21,7
M 40% 60 2 16,5 0,34 48,1 16,2
N 40% Ta 4 14,2 1,24 11,5 12,96
O 30% 60 4 14,3 0,095 151,3 14,2
*During the execution of this test occurred some problem in keeping temperature at a constant level.
The tests have pointed out that, in any case, the method of decontamination is always in condition to produce a sufficient cleanliness degree for each specimen treated.
In Figure 1 is represented for each specimen the initial and final superficial contamination levels.
The aim of the decontamination process is to reach the free release level. This level for superficial contamination is of 1 Bq/cm2 for the Co60.
The aim of the decontamination tests is to reach a residual contamination level of not more than 0,8 Bq/cm2.
This value has been chosen applying a margin of respect of 20% to the official release of 1 Bq/cm2 and it is shown in
the figure with a blue straight line.
The figure puts easily in evidence how, in consequence of the chemical treatment, every tested specimen can be considered as completely decontaminated. The residual activity, represented in green, is, in fact, always under the straight blue line of the free release.
Some specimen had a residual activity level comparable to the sensitivity of the measure tool.
Figure 1: Superficial contamination of the specimens
The decontamination process is as more effective as the acid concentration and the temperature of the system are higher (Figure 2 and 3).
The effect of the temperature seems to be very important even in terms of removed material, a high temperature process is more and more aggressive.
A treatment that lasts 4 h at a temperature of 60 °C removes not only the oxide layer, but also base metal is deeply attacked.
Figure 2. DF in function of concentration 0
1 2 3 4
A B C D E F G(1) G(2) G (tot.) H I L M N O
C
ont
am
inat
ion
(
B
q/
cm
2)
Starting Contamination Final Contamination
1 4 7 10 13 16
20% 30% 40%
C
DF
Figure 3. DF in function of temperature
This is certainly a problem in case that the component treated is supposed to be reused. However, the temperature increase allows to reduce a single process duration.
From the tests on the specimens H, E, M, of the length respectively of half time, an hour and two hours, it is possible to derive how effective is decontamination and short is the process.
As already said, the increase of temperature, speeds up kinetics of the reaction.
The acid solution is able to remove immediately the first layers of superficial oxide, where almost all of the contamination is concentrated.
Figure 4. DF in function of variable duration of the tests
0
10
20
30
40
50
0,5
1
2
4
DF
C
: 40% T: 60 C°∆t
0 4 8 12 16 20
20 40 60
T (°C)
DF
In Figure 4 the DF trend is graphed in function of the duration of the treatment.
It can be noticed from the Figure 4 that the C test has not given results comparable to the others. This was not really a surprise, seen the difficulty in keeping the temperature constant.
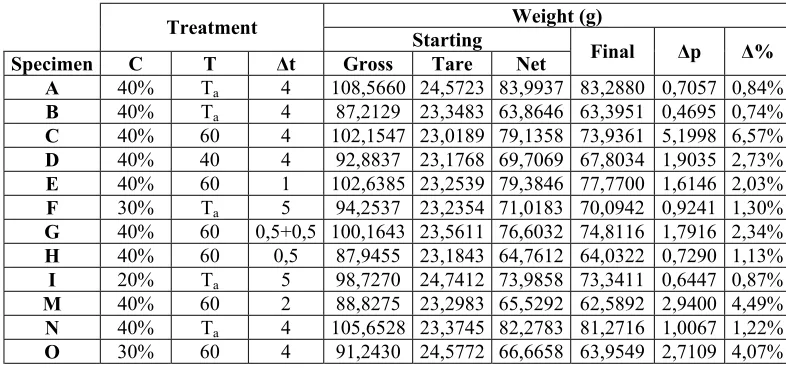
The material removed during each test, is derived by weighing the specimens before and after the chemical treatment (see Table 5).
The contaminated sample was not weighted directly but, in order to avoid the contamination of the tools, the empty container was weighed empty before and after with the specimen inside.
Table 5. Specimens Weights
Weight (g)
Treatment Starting
Specimen C T ∆t Gross Tare Net Final ∆p ∆%
A 40% Ta 4 108,5660 24,5723 83,9937 83,2880 0,7057 0,84%
B 40% Ta 4 87,2129 23,3483 63,8646 63,3951 0,4695 0,74%
C 40% 60 4 102,1547 23,0189 79,1358 73,9361 5,1998 6,57%
D 40% 40 4 92,8837 23,1768 69,7069 67,8034 1,9035 2,73%
E 40% 60 1 102,6385 23,2539 79,3846 77,7700 1,6146 2,03%
F 30% Ta 5 94,2537 23,2354 71,0183 70,0942 0,9241 1,30%
G 40% 60 0,5+0,5 100,1643 23,5611 76,6032 74,8116 1,7916 2,34%
H 40% 60 0,5 87,9455 23,1843 64,7612 64,0322 0,7290 1,13%
I 20% Ta 5 98,7270 24,7412 73,9858 73,3411 0,6447 0,87%
M 40% 60 2 88,8275 23,2983 65,5292 62,5892 2,9400 4,49%
N 40% Ta 4 105,6528 23,3745 82,2783 81,2716 1,0067 1,22%
O 30% 60 4 91,2430 24,5772 66,6658 63,9549 2,7109 4,07%
In order to reduce the radioactive waste produced, the material removed is certainly too much. This is true especially for what concerns the high temperature tests.
Test C is the worst of all by this point of view. It is possible to have an approximate calculation of the removed metal layer in this case.
It has been considered an estimate of the superficial oxide thickness of 75µm (measured average value for the carbon steel).
Removed oxide weight: ∆po=soρoS=0,015•5,2•9=0,7g
Removed steel weight: ∆Pa =∆Ptot −∆po =5,2−0,7=4,5g
Removed metal layer: sa=
(
∆Pa/Stotρa)
Sa/Stot =(
4,5/(
20,8•8)
) (
• 9/20,8)
≈120µmwhere the sub writings o indicates the physical quantities of the oxide and the sub writings a the ones referred to the steel.
The main assumption are: ρa= 8 g/cm3; ρo= 5,2 g/cm3 (hematite); Stot = (9*2+0,7*4) = 20,8 cm2
This value is certainly excessive, even if it is just an approximate estimate.
The radiological investigations on the plant did not show any kind of penetration of the superficial contamination to the metal. This is why such a big layer of 120 µm of removed metal contributes just to increase the total waste; it has no substantial effect onto the total activity removed.
These results should be examined with more attention. Some new test, maybe using some of the different carbon steels of the plant, have to be foreseen.
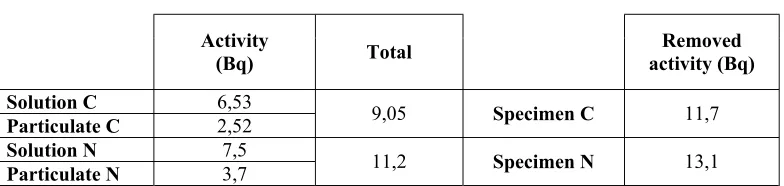
The solutions of the specimens C and N, at the end of the test, have been filtered.
Table 6. Activity measures on filtered solutions and removed particulate.
Activity
(Bq) Total
Removed activity (Bq)
Solution C 6,53
Particulate C 2,52 9,05 Specimen C 11,7
Solution N 7,5
Particulate N 3,7 11,2 Specimen N 13,1
The data measured shows how about the 70% of the removed activity remains in the solution.
Therefore the bigger part of the radioisotopes stop in solution, in form of iron phosphates. The acid in practice, also foreseeing an immediate filtering, degenerates and contaminates itself very quickly.
CONCLUSION
By the examinations of the results obtained can be drown some general considerations:
• The acid solution considered is perfectly able to perform good results on the materials tested;
The tests reached the aim of decontamination level requested so it is possible to see that getting the low activity structural material to the free release conditions is quite easy;
• The concentration of the acid solution is an important factor to increase the aggressiveness of the attack. A 40% solution is certainly capable to perform good results in terms of decontamination, but it tends to attack the base metal; low level concentration are probably more useful if it’s necessary to remove the oxide without getting to the metal;
• The temperature is a fundamental factor to get the process faster and to reduce the treatment duration. • A very short process, at the highest temperature and concentration, turned out to be very effective.
Only the first micrometers of material, where most contaminating agents are contained, should be removed. This means less radioactive waste with a good level of decontamination, too.
So a process with a solution of H3PO4, 40% and at a temperature of 60°C, appears adequate to clean low activity
structural material with reduced waste.
The test G and H are quite interesting in this sense.
In the first one, specimen G passed from an initial contamination of about 26 Bq to 3,4 Bq, a removal of the 87% of the total contamination. Specimen H passed from 19 to 3 Bq, so the 84 % of the initial contamination was removed
The specimen E, after an hour of acid attack, jumped from 23 Bq to about 1,2, almost 95% less.
In conclusion the experience collected with this campaign of tests is particularly valuable because allowed to verify how the method is able to guarantee a fast, sure and effective decontamination on low surface activity of structural materials.
NOMENCLATURE
DF - Decontamination Factor C - % of H3PO4 in the solution
T - Temperature
Ci - Starting contamination
Cf - Final contamination ∆t - Duration of the tests ∆p - Weight variation ρ - Density
Sx - Surface
so - Oxide layer
REFERENCES
W.NICODEMI, Metallurgia, Masson Italia Editori E.BERTORELLE, Trattato di galvanotecnica, Hoepli P.AMADESI, Dispense di radiometria e radioprotezione
G.BIANCHI, F.MAZZA, Fondamenti di corrosione e protezione dei metalli, Tamburini editore-Milano