Copyright 8 1996 by the Genetics Society of America
Epistatic Control of Non-Mendelian Inheritance
in
Mouse Interspecific Crosses
Xavier Montagutelli,*9t Rowena Turnert and
Joseph H. Nadeaut
*Unit6 de Gnitique des Mammvires, Znstitut Pasteur, 75724 Paris cedex 15, France, and tThe Jackson Laboratory, Bar Harbor, Maine 04609-1500
Manuscript received August 17, 1995 Accepted for publication May 15, 1996
ABSTRACT
Strong deviation of allele frequencies from Mendelian inheritance favoring Mus spretusderived alleles has been described previously for X-linked loci in four mouse interspecific crosses. We reanalyzed data for three of these crosses focusing on the location of the gene(s) controlling deviation on the Xchromo- some and the genetic basis for incomplete deviation. At least two loci control deviation on the X chromosome, one near Xzst (the candidate gene controlling Xinactivation) and the other more centro- merically located. In all three crosses, strong epistasis was found between loci near Xzst and marker loci on the central portion of chromosome 2. The mechanism for this deviation from Mendelian expectations is not yet known but it is probably based on lethality of embryos carrying particular combinations of alleles rather than true segregation distortion during oogenesis in F, hybrid females.
T
HE few examples of transmission ratio distortion (TRD) are genetically complex and involve chro- mosome rearrangements that preserve particular com- binations of distortioncontrolling alleles at closely linked loci (CROW 1991). TRD is defined as a statistically significant departure from Mendelian transmission, re- gardless of its basis. When due to meiotic drive, as in SD in Drosophila (SANDLER and NOVITSKI 1956; SAN- DLER and GOLIC 1985; LYITLE 1991) and the HSR in- verted duplication in wild populations of Mus musculus musculus (AGULNIK et al. 1993a; RUVINSKY 1995), it is appropriate to refer to the phenomenon as segregation distortion. By contrast, TRD associated with t haplotypes is not a consequence of meiotic drive but rather of the differential ability of sperm to fertilize eggs (LYON 1984; SILVER 1985). In a third situation, deviation from Men- delian inheritance (DMI) probably results from lethal- ity of embryos carrying particular combinations of al- leles at unlinked loci (ZECHNER et al. 1996).Modest but significant DM1 is occasionally found in linkage testing crosses, e.g., chromosome 2 (SIRACUSA et al. 1989), chromosome 4 (CECI et al. 1989) and chro- mosome 10 (JUSTICE et al. 1990). Except for chromo- some 2 (SIRACUSA et al. 1991), these phenomena have not been studied further. It is likely that all three DMIs result simply from sampling fluctuations that are ex- pected when relatively small numbers of mice are typed for many loci. This interpretation is supported by the fact that none of these DMIs has been replicated in independent crosses.
By contrast, strong DM1 (70-90%) favoring M. spetuderived alleles at chromosome X-linked loci has
Corresponding authur: Joseph H. Nadeau, Department of Human Genetics, RoomL3-109, Montreal General Hospital, 1650 Cedar Ave., Montreal, Quebec H3G 1A4, Canada.
Genetics 1 4 3 1739-1752 (August, 1996)
been found in all four linkage crosses in which (C57BL/6J [or C3H] X M. spretus) F1 hybrid females were backcrossed to M. spetus males (BIDDLE 1987; EU-
1994; JOHNSON et al. 1994; ROW et al. 1994). Because the magnitude of DM1 and the map location of affected loci were similar in all four backcrosses to M. spretus, it was unlikely that this deviation was due to sampling fluctuations alone. Three of these crosses afford an ex- ceptional opportunity to study the genetic basis of the deviation because, as mapping panels available to the community, they have been typed for numerous loci spanning the entire genome (EUROPEAN MOUSE BACK- CROSS COLLABORATIVE GROUP 1994; JOHNSON et al. 1994; ROW et al. 1994). The aim of work presented here was to localize the gene(s) controlling DM1 on chromosome X and investigate the genetic basis for incomplete deviation.
ROPEAN MOUSE BACKCROSS COLLABORATIVE GROUP
MATERIALS AND METHODS
Interspecific crosses: The backcrosses that we analyzed were either the BSS type [(C57BL/6J X M. spretus)F1 X M.
spretus] or the BSB type [ (C57BL/6J X M. spretus)F1 X
C57BL/6J]. The following crosses were analyzed: (1) the Jack- son Laboratory (C57BL/6J X M. spetus)F1 X C57BL/6J and
(C57BL/6JEi X SPRET/Ei)F, X SPRET/Ei crosses ( R o w et al. 1994), referred to here as “JAX1 BSB” and “JAXI BSS,” respectively; (2) the (C57BL/6J X SPR)F1 X C57BL/6J and (C57BL/6J X SPR)F1 X SPREuropean Collaborative Interspe- cific Backcross (EUCIB) crosses (EUROPEAN BACKCROSS COL
LABORATIVE GROUP 1994), referred to here as “EUCIB BSB” and “EUCIB BSS,” respectively; and (3) (C57BL/6J X
SPRET/Ei)FI X SPRET/Ei and (C57BL/6JEi X SPRET/Ei)Fl
X SPRET/Ei crosses (JOHNSON el al. 1994) made at the Jack- son Laboratory and referred to here as
‘JAXZ.”
The M. spretus strain that was used (SPR) was not fully inbred although the mice are kept in a closed colony (EUROPEAN BACKCROSS COI,1740 X. Montagutelli, R. Turner and J. H. Nadeau
specific backcross were not included in the present analysis because of small sample size and partial genotyping.
Source of published genotypes: Genotypes for the JAXl BSS and BSB crosses were obtained from the WWW Jackson Laboratory server (URL: http://wwwjax.org). These data were posted on Feb. 21, 1995. Genotypes for the EUCIB BSS and BSB crosses were obtained from the MBx database as posted on Dec. 19, 1994 (BROWN 1995). On the X chromo- some, only anchor loci DXMZt8, DXWas70, G p r , Plp and Xist were considered because they were typed for most animals. Genotypes from the JAX2 cross were provided by K. JOHNSON
(personal communication). The analysis was restricted to a subset of loci (Figure 1); some loci were excluded because they did not recombine with others, some because more than six genotypes were missing for a given locus, and some be- cause certain genotypes were unlikely (double recombinants in a short genetic interval). Where possible, we retained loci that were typed in all three panels, thereby facilitating map comparison.
Rules used to infer genotype: To increase the sample size for subsequent analyses, genotypes were inferred for animals that did not have a crossover between anchor loci. The rules for inferring a genotype were as follows: genotypes were not inferred for anchor loci; the map position of the locus for which a genotype was inferred relative to the two flanking loci was firmly established before the inference, i e . , alternative inferences did not affect the gene order; and distances be- tween this locus and each of the flanking loci was <15 cM. Alternative inferences would result in apparent “single locus double crossovers,” which are rare in these mapping panels (EUROPEAN MOUSE BACKCROSS COLLABORATIVE GROUP 1994; JOHNSON et al. 1994; ROW et al. 1994). Loci between adjacent crossovers, i.e., within a crossover bin, show identical strain distribution patterns. For simplicity in data presentation, we present only one locus per bin. The identity of the other loci can be obtained from the primary data sources (see above). Microsatellite genotype determination: To fill gaps in the published maps and to add marker loci for comparing map- ping information from different crosses, additional microsat- ellite loci were added to the published EUCIB BSS and JAX2 mapping panels. PCR primers for microsatellite loci were de- scribed by DIETRICH et al. (1992-1994) and were obtained from Research Genetics (Huntsville, A L ) . Standard nonradio- active PCR methods were used to amplify microsatellite loci. PCR products were size-fractionated by using electrophoresis on 4% agarose gels and were detected with ethidium bromide
(MONTAGUTELLI et al. 1991). For the EUCIB BSS cross, we typed DXMit57, DXMit60, DXMit91, and DXMitlO5 for animals with crossovers between DXWas70 and DXMit8 ( n = 112), DXMitl6 for animals with crossovers between DXMit8 and Xist ( n = 30), and DXMit28 for animals with crossovers between Plp and ofpr ( n = 69). For the JAX2 cross, we typed DXMit26
( n = 92). New genotypes have been deposited in the MBx database (BROWN 1995) for the EUCIB cross or with K. JOHN- SON (Jackson Laboratory) for the JAX2 cross.
Analysis of linkage, segregation and epistasis: All data were analyzed with the program Gene-Link (MONTAGUTELLI 1990), using an enhanced version to be described separately that includes tests for transmission ratio distortion and for epista- sis. Unless specified otherwise, Pvalues were calculated from the two-tail binomial probabilities.
RESULTS
Segregation analysis: We first examined transmission of alternative alleles for each locus in all three crosses, then tested models for monogenic and digenic control
of DMI, and finally examined transmission of recombi- nant chromosomes. For each X-linked locus, deviation from Mendelian inheritance was measured as the pro- portion of animals having inherited the S allele from their F1 hybrid mother for the BSS crosses and the B allele for the BSB crosses (Table 1 a n d Figure 1).
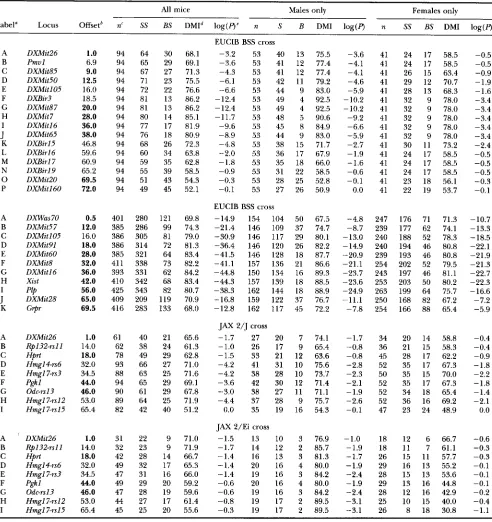
In the JAXl BSB cross, the frequency of S alleles fluctuated -50% as expected in the absence of devia- tion. T h e JAXl BSS cross, but not the BSB cross, showed significant DMI, which was centered near DXh4it87and affected a -50-cM segment of chromosome X . T h e EU- CIB BSS cross, but not the BSB cross, also showed DMI, but a distinct DM1 peak was not found and deviation was 280% over a -4O-cM region decreasing slowly to- ward the chromosome ends (DXMit91-P4, Table 1).
JAX2 is derived from different crosses, one using C57BL/6J (designated JAXP/J, n = 95) and the other the substrain C57BL/6JEi (designated JAXP/Ei; .n = 49) (JOHNSON et al. 1994; K. JOHNSON, personal commu- nication). Progeny derived from C57BL/6J showed a broad, more telomerically located peak somewhat simi- lar to that found in the EUCIB cross. By contrast, prog- eny derived from C57BL/6JEi showed a more centro- merically located DM1 peak somewhat similar, although not as distinct, as that found in the JAXl cross. T h e contrasting results for these two crosses could reflect strain divergence between C57BL/6J and C57BL/6JEi, sampling effects, or both. Because of its small sample size, the JAX2/Ei subset was not analyzed further.
In all three crosses, DM1 was usually stronger in male than female progeny (Table 1). However, because dis- tortion favored the same alleles at the same loci in both sexes, data for males and females were pooled where appropriate in subsequent analyses.
DM1 was occasionally found for autosomal loci (results not shown;
cf:
EUROPEAN MOUSE BACKCROSS COLIABORA- TIVE GROUP 1994;JOHNSON et al. 1994; ROW et al. 1994). But because DM1 was usually confined to a single locus and did not affect closely linked loci, or because it was found in only one of the three crosses, we suspect that these examples represent typing errors, incomplete typing, sampling fluctuations, or weak biological effects. Where records were available, we tested whether DM1 depended on parity or age of the hybrid female, but neither factor contributed significantly to DMI.
JAXl: BSS @& 94)
JAXl: BSB (N=89
-
94) A : DXMit26*B : Pmvl C : DXMit85
D : DXMit50
E : DXMitlOS*
F : DXBir3
1 p G : DXMit87 D H : DXMit7 7 1: DXMitl6*
I J : DXMit65
K : DXBirl5
L : DXBirl6
M : DXBfrl7
N : DXBirl9 0 : DXMit20
P : DXMitl60
Q : DXBirl
R : DXMit63
s :
PIPT : DXMit34
Eucm:
BSS (N= 385-
425)EuCIB: BSB (N=236
-
261)A : DxwaS70
B : DXMit57 C : DXMitIOS*
D : DBfit91
E : DXMit60
F: DXMit8 G : DXMitl6*
H : Xist 7 I : Pip
) J : DXMit28
K : Grpr
JAX 2JJ BSS (N= 61
-
94)JAX UEi: BSS (Ne31
-
49)7
A : DXMit26.
B : RpN2-rsl I C : Hprt
D : Hmgll-rs6
E : Hmgl7-rs3
F : Pgkl 0 : Odc-rsl3
H : Hmgl7-rs12
I : Hmgl7-rs15
FIGURE 1.-Percentage of homozygotes, e.g., SSor BB us. BSdepending on the cross, at each locus on chromosome Xin three interspecific crosses between C57BL/6 and inbred strains derived from Mus spretus. For each cross, the loci analyzed are listed on the right. Asterisks denote loci typed in more than one cross; these loci can be used to compare results for different crosses. (a) Jackson Laboratory crosses: 0, JAXl BSS (94 animals in total, all typed for individual loci); percentages of SS homozygotes are taken from Table 1; D, JAXl BSB (94 animals in total, 89-94 animals typed for individual loci) ; percentages of BB homozygotes were calculated from data stored in MGD and available on the World Wide Web (ROW et al. 1994). (b) EUCIB crosses: 0, EUCIB BSS (429 animals in total, 385-425 animals typed for individual loci); percentages of SS homozygotes are taken from Table 1; D, EUCIB BSB (264 animals in total, 236-261 animals typed for individual loci); percentages of BB homozygotes were calculated from data stored in MBx (BROWN 1995). (c) JAX2 crosses: 0, (C57BL/6J X SPRET/Ei)F1 X SPRET/Ei cross (95 animals in total, 61 -94 animals typed for individual loci); percentages of SS homozygotes are taken from Table 1; 0 , (C57BL/ 6JEi X SPRET/Ei)FI X SPRET/Ei cross (49 animals in total, 31-49 animals typed for individual loci); percentages of SS homozygotes were calculated separately (data not shown).
1742 X. Montagutelli, R. Turner and J. H. Nadeau
TABLE 1
Distribution of SS and BS genotypes at different loci on chromosome X i n three interspecific crosses between C57BL/6J and inbred strains derived from Mus sp-etus
All mice Males only Females only
Label" Locus Offsetb nr SS BS DMId log(P)" n S B DM1 log(P) n SS BS DM1 log(P)
A B C D E F G H I K L M N 0 P
J
A B C D E F G H I KJ
A B C D E F G H I A B C D E F G H I DXMit26 DXMit85 Pmvl DXMit50 DXMitl05 DXBir3 DXMit87DXMit 7
DXMitl6 DXMit65 DXBirl5 DXBirl6 DXBirl7 DXBirl9 DXMit I60 DXMit20 DXWas 70 DXMit5 7
DXMit 105 DXMit9I DXMit60 DXMit8 DXMitl6 Xist
DXMit28 Plp o g r
DXMit26 Rp132-rsl I
Hmgl4-rs6 Hmgl7-rs3 Pgk I Odc-rsl3 Hmg17-rsl2 Hmgl7-rs 15 HP" DXMit26 Rp132-rsll Hmgl4rs6 Hmgl7-rs3 Odc-rsl3 Hmgl7-rsI 2 Hmgl7-rs15 HP" Pgkl
1
.o
6.9 9.0 12.5 16.0 18.5 20.0 28.0 36.0 38.0 46.8 59.6 60.9 65.2 69.5 72.0 0.5 12.0 16.0 18.0 28.0 32.0 36.0 42.0 56.0 65.0 69.5 1.0 14.0 18.0 32.0 34.5 44.0 46.0 53.0 65.4 1.0 14.0 18.0 32.0 34.5 44.0 46.0 53.0 65.4 94 94 94 94 94 94 94 94 94 94 94 94 94 94 94 94 40 1 385 386 386 385 41 1 393 410 425 409 416 61 62 78 93 88 94 90 89 82 31 32 42 49 47 49 47 44 45 64 65 67 71 72 81 81 80 77 76 68 60 59 55 51 49 280 286 305 314 321 338 331 342 343 209 283 40 38 49 66 63 65 61 64 42 22 23 28 32 31 29 28 27 25
30 68.1 29 69.1 27 71.3 23 75.5
22 76.6 13 86.2 13 86.2 14 85.1
17 81.9 18 80.9 26 72.3 34 63.8 35 62.8
39 58.5 43 54.3 45 52.1
121 69.8 99 74.3 81 79.0 72 81.3 64 83.4 73 82.2 62 84.2 68 83.4 82 80.7 119 70.9 133 68.0
21 65.6 24 61.3
29 62.8 27 71.0
25 71.6
29 69.1 29 67.8 25 71.9
40 51.2
9 71.0 9 71.9 14 66.7
17 65.3 16 66.0
20 59.2 19 59.6
17 61.4 20 55.6
EUCIB BSS cross
-3.2 53 40 -3.6 53 41 -4.3 53 41 -6.1 53 42 -6.6 53 44 -12.4 53 49 -12.4 53 49 -11.7 53 48 -9.6 53 45 -8.9 53 44 -4.8 53 38 -2.0 53 36 -1.8 53 35 -0.9 53 31 -0.3 53 28 -0.1 53 27
EUCIB BSS cross -14.9 154 104 -21.4 146 109 -30.9 146 117 -36.4 146 120 -41.5 146 128 -41.1 157 136 -44.8 150 134 -44.3 157 139 -38.3 162 144 -16.8 159 122 -12.8 162 117
JAX 2/J cross -1.7 27 20 -1.0 26 17 -1.5 33 21 -4.2 41 31 -4.2 38 28 -3.6 42 30 -3.0 38 27 -4.4 37 28
0.0 35 19
JAX 2/Ei cross -1.5 13 10 -1.7 14 12 -1.4 16 13 -1.4 20 16 -1.4 19 16
-0.6 20 16 -0.6 19 16 -0.8 19 17 -0.3 19 17
13 75.5 12 77.4 12 77.4 11 79.2
9 83.0 4 92.5 4 92.5 5 90.6 8 84.9 9 83.0 15 71.7 17 67.9
18 66.0 22 58.5 25 52.8 26 50.9
50 67.5 37 74.7
29 80.1 26 82.2 18 87.7 21 86.6 16 89.3 18 88.5 18 88.9 37 76.7 45 72.2
7 74.1 9 65.4 12 63.6 10 75.6 10 73.7 12 71.4 11 71.1 9 75.7 16 54.3
3 76.9 2 85.7 3 81.3 4 80.0 3 84.2 4 80.0 3 84.2 2 89.5 2 89.5
-3.6 -4.1 -4.1 -4.6 -5.9 -10.2 -10.2 -9.2 -6.6 -5.9 -2.7 -1.9 -1.6 -0.6 -0.1 0.0 -4.8 -8.7 - 13.0 - 14.9 -20.9 -21.1 -23.7 -23.6 -24.9 -11.1 -7.8 -1.7 "0.8 -0.8 -2.8 -2.3 -2.1 - 1.9 -2.6 -0.1 -1.0 -1.9 -1.7 -1.9 -2.4 -1.9 -2.4 -3.1 -3.1 41 41 41 41 41 41 41 41 41 41 41 41 41 41 41 41 247 239 240 240 239 254 243 253 263 250 254 34 36 45 52 50 52 52 52 47 18 18 26 29 28 29 28 25 26 24 24 26 29 28 32 32 32 32 32 30 24 24 24 23 22 176 177 188 194 193 202 197 203 199 168 166 20 21 28 35 35 35 34 36 23 12 11 15 16 15 13 12 10 8 17 17 15 12 13 9 9 9 9 9 11 17 17 17 18 19 71 62 52 46 46 52 46 50 64 82 88 14 15 17 17 15 17 18 16 24 6 7 11 13 13 16 16 15 18 58.5 58.5 63.4 70.7 68.3 78.0 78.0 78.0 78.0 78.0 73.2 58.5 58.5 58.5 56.1 53.7 71.3 74.1 78.3 80.8 80.8 79.5 81.1 80.2 75.7 67.2 65.4 58.8 58.3 62.2 67.3 70.0 67.3 65.4 69.2 48.9 66.7 61.1 57.7 55.2 53.6 44.8 42.9 40.0 30.8 -0.5 -0.5 -0.9 -1.9 -1.6 -3.4 -3.4 -3.4 -3.4 -3.4 -2.4 -0.5 -0.5 -0.5 -0.3 -0.1 -10.7 -13.3 -18.5 -22.1 -21.9 -21.3 -22.7 -22.3 -16.6 -7.2 -5.9 -0.4 -0.4 -0.9 -1.8 -2.2 -1.8 -1.4 -2.1 0.0 -0.6 -0.3 -0.3 -0.1 -0.1 -0.1 -0.2 -0.4 -1.1
For each locus in each cross, the allele frequency, DMI, and degree of significance are listed for each sex and for the entire data set. Codes A-P for the JAXl BSS cross, A-K for the EUCIB cross, and A-I for the JAXZ cross enable comparisons between these typing results and raphic representations of transmission ratios (Figure 1). To calculate this proportion for male progeny, which are hemizygous X b o r
PY,
homozygotes were those inheriting the allele from the F1 parent that was also shared with the backcross parent, e g . , the S allele would be considered the homozygous allele when it was inherited from the F1 hybrid crossed to a M. spetus parent, and it would be considered the heterozygous allele when it was inherited in crosses to C57BL/6J."A letter is given t o each locus for further reference in figures.
bOffsets represent genetic distance from the centromere. Values in bold were taken from the 1994 Mouse chromosome X Committee Report (HERMAN et al. 1994). Other values were calculated from experimental data. All: males and females combined.
'Number of animals typed for this locus.
Non-Mendelian Inheritance in Mice 1743
f
TT
m
10 0 10 20 30 4011
5040
Observed RF (%) h m G (DXMit87)
801
7"
10 0 10 20 30
40
Observed RF (%) h m E (HmgJ 7-rs3)
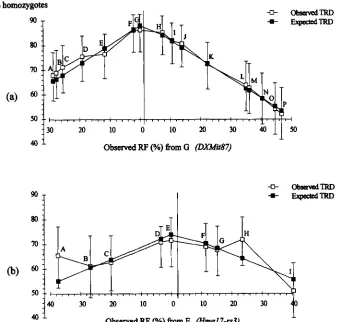
FIGURE 2.-Comparison of the observed DM1 on chromosome Xwith that expected from a single-locus model. Model: If &
is the DM1 caused by Dm, D, and d the recombination fraction between D and a given locus L, then K L = d
+
& ( I-
2d) where K L is the expected DM1 at marker locus L (cf: BAILEY7 5
y,
with modifications). Significance test: For N loci analyzed, thegoodnessof-fit was estimated by GF = 4XgJarcsin
Iz,
Z&Jz where n, is the number of animals typed for locus i, K,h theobserved DM1 at locus i and k& the expected DMI. GFfollows a chi-square distribution with Ndegrees of freedom (RAO 1978). When fitting the models to the data, GF was more sensitive to changes in DM1 (&) values than in DCSX location. The actual location of the DCSXs identified in this analysis could well be several centimorgans away from the predicted location. In all instances, similar locations and DM1 (&) values were found when sexes were analyzed separately. (a) Percentage of SS homozy- gotes on chromosome X in the JAXl BSS cross. The horizontal axis shows observed recombination fraction (in percentage) between each locus and DXMit87 (G); left of 0, loci located proximal to DXMiit87; right of 0, loci located distal to D X " ? 0, DM1 observed in experimental data; M, DM1 expected from a model involving a single DCSX located 1.3 cM distal to DXMit87,
shown as a vertical bar -21.3 cM from the centromere, with 89% homozygotes at this locus. (b) Percentage of SS homozygotes on chromosome Xin the JAX2/J BSS cross. The horizontal axis shows observed recombination fraction (in percentage) between each locus and Hmgl7-rs3 (E); left of 0, loci located proximal to Hmgl7-7~3 right of 0, loci located distal to Hmgl7-rs3 U, DM1 observed in experimental data with error bars showing the 95% confidence interval; M, DM1 expected from a model involving a single Dwx located 2.1 cM distal to Hmgl7-7~3, shown as a vertical bar -36.6 cM from the centromere, with 75% homozygotes at this locus.
(GF = 6.27,9 d.f., P - 0.71). This DCSX was designated
Dcsx2. According to the XChromosome Committee Re- port (HERMAN et al. 1994), Dcsxl and Dcsx2 are located -21.3 and -36.6 cM from the centromere, respectively. Analysis of results for male and female progeny sepa- rately led to different values for the predicted DM1 (&)
but to similar positions for the DCSX loci.
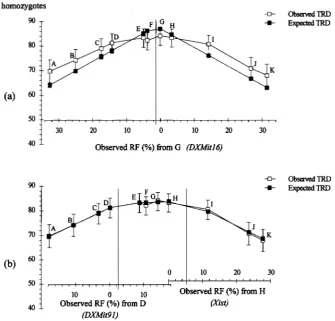
When the single locus model was tested against the EUCIB BSS data, the "best" fit was obtained with a DCSX located -1.3 cM proximal to DXMitl6 with a predicted DM1 (&) of 88% (Figure 3a). However, the predicted DM1 did not give a good fit to the empirical data (GF = 36.1, 11 d.f., P
<
0.0002). We thereforetested an alternative model involving two linked loci. We again vaned the locations of the proposed DCSXs to find those that minimized GF. The best fit was ob- tained with a DCSX located -2.5 cM distal to DXMit91
with a predicted DM1
( K ] )
of 83% and another DCSX located -5.3 cM distal to Xist with a predicted DM1(&) of 84% (GF = 0.934, 11 d.f., P
=
1; Figure 3b). These loci are designated D u x 3 and Dcsx4, respectively. According to the X Chromosome Committee Report(HERMAN et al. 1994), these DCSXs are located -20.5 and -47.3 cM from the centromere. We note that D u x 3
has a similar position (20.5 cM us. 21.3 cM) as Dcsxl
1744 X. Montagutelli, R. Turner and J. H. Nadeau
%homozygotes
-c- ObsavedTRD
90-
80 "
70 --
(b) 60
"
so "
- - Observed RF (%) from D (Xis!, (DXMit91)
FIGURE 3.-Comparison of the observed DM1 with that expected from a single- and a two-locus model. Model: Expected values for DM1 can be calculated from the equation in Figure 2 for loci located outside the interval defined by the two proposed D c s s acting independently. Let D1 and D2 denote these Dcsxs with Dl being centromeric to D2 and with Kl and K2 being the DMIs caused by Dl and D2, respectively. For a locus L that is centromeric to D l , KL = dl
+
& (1 - 2 d 1 ) where K,. is the expected DM1 at locus L and dl the RF between L and Dl. Similarly, for a locus L' that is telomeric to D2, KLr = dz+
& (1 - 2d2) where Kg is the expected DM1 at locus L' and d2 the RF between L' and 0 2 . Let L" be a locus located between Dl and D2, with dl anddz being the RF between L" and Dl and D2, respectively. If D l and D2 are within 30-40 cM, we can neglect double crossovers in this interval (DIETRICH et al. 1992-1994; EUROPEAN MOUSE BACKCROSS ~OLLABORATIW GROUP 1994;JOHNSON et al. 1994; R O W et al. 1994) and consider that d, the RF between D l and D2, is close to dl
+
d2, whatever the locus L" considered. Let us denote A the proportion of animals that are homozygous SS at both Dl and D2, B the proportion of animals that are homozygous at Dl and heterozygous at D2, and C the proportion of animals that are heterozygous at Dl and homozygote at D2. Then, & = A+
( d 2 / d ) B+
( d l / d ) C. Moreover, KI = A+
B, K2 = A+
C, and d = B+
C. A, B and C can be calculated as A = ( Kl+
K2 -d ) / 2 B = ( Kl - K2
+
d ) / 2 , and C = ( K2 - Kl+
d ) / 2 . (a) Single-locus model. The horizontal axis shows observed recombinationfraction (in percentage) between each locus and DXMitl6 ( G ) ; left of 0, loci located proximal to DXMitlG; right of 0, loci located distal to DXMitlG; 0, DM1 observed in experimental data; H, with error bars showing the 95% confidence intervals: DM1 expected from a model involving a single Dcsx located 1.3 cM proximal to DXMzt16, -34.7 cM from the centromere, with 88% homozygotes at this locus. (b) Two-locus model. Horizontal axis is divided into two sections. Left section shows observed recombination fraction (in percentage) between loci A-H and DXMit91 (D); left of 0, loci located proximal to DXMit91; right of 0, loci located distal to DXMit91. Right section shows observed recombination fraction (in percentage) between loci I-K and Xist (H). 0, DM1 observed in experimental data, with error bars showing the 95% confidence intervals; H, DM1 expected from a model involving
two Dcsx's, one located 2.5 cM distal to DXMit91, -20.5 cM from the centromere, with 83% homozygotes at this locus, the other located 5.3 cM distal to Xist, -47.3 cM from the centromere, with 84% homozygotes at this locus.
loci are probably identical. Dcsx2 and Dux4 may also be identical, because they are within -1 1 cM of each other (-36.6 and -47.3 cM, respectively). It is difficult to rule out the possibility of identity given the inherent variability between crosses and the modest number of loci that have been typed in the EUCIB and JAXS/J
crosses and that can be used for integrating the results. Two explanations could account for evidence of a single DCSX in the JAXl and JAX2/J crosses while two
DCSXs are found in the EUCIB cross. First, it could be
due to a strain difference, since JAXl andJAX2/J have been established from the inbred SPRET/Ei M. spretus
strain, whereas the EUCIB cross used the outbred SPR
stock. Second, it is possible that the distal DCSX is also present in JAXl and
JAX2/J
crosses, but its modest effect is masked by the prominent deviation resulting from the proximal DCSX.Non-Mendelian Inheritance in Mice 1745
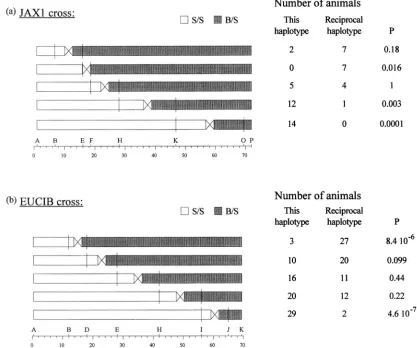
progeny with nonrecombinant and recombinant chro- mosomes. By examining haplotype data for progeny with recombinant chromosomes, it should be possible to obtain additional evidence for the genetic control of DMI. We divided chromosome Xinto five intervals and for each interval, compared the number of animals car- rying the two reciprocal haplotypes that showed a re- combination breakpoint in this interval. Only haplo- types with a single recombination breakpoint were analyzed. If a single locus controls DMI, it should be possible to identify the DCSX-containing interval among progeny with recombinant chromosomes. When comparing reciprocal haplotypes, if the interval consid- ered is proximal to the DCSX, then all the chromo- somes that are BS centromeric to the breakpoint-con- taining interval and SS distal to it are also SS at the DCSX and should therefore be systematically more fre- quent than their counterpart. The reverse applies to chromosomes that recombine in an interval distal to the DCSX. However, if the DCSX in contained in the interval studied (and approximately in its center), there should be no difference between reciprocal haplotypes since recombination might have occurred within the interval proximally or distally to the DCSX, and chro- mosomes that are SS toward the centromere will be either SS or BS at the DCSX.
For the JAXl BSS cross, only the DXBir3-DXMit7 in- terval showed equal frequency of reciprocal haplotypes (Figure 4a). By contrast, significant deviation was ob- served for haplotypes with crossovers centromeric to DXBir3 or telomeric to DXMit7. The DXBir?-DXMit7in- terval corresponds to the peak DM1 in the segregation analysis and to the predicted peak based on modeling. This result provides additional evidence that deviation in this cross can be explained by a single DCSX. The EUCIB BSS cross, by contrast, showed three successive intervals with an equal frequency of reciprocal haplo- types; these intervals, which extend over 40 cM, were delimited by DXMit91 centromerically and PZp telomeri- cally. This analysis could not be applied to the JAX2 cross because DM1 was weak and incomplete typing reduced the sample size of informative mice.
These results are not compatible with the hypothesis of a single DCSX. We propose that at least one DCSX is located in the centromeric interval that showed no deviation (DXMit91-DXMitGO), another in the telomeric interval (Xist-PZp), and that the middle interval does not have a DCSX. This interpretation is similar to that described above for chromosomes with a single DCSX. Chromosomes with a crossover in the DXMit91-DXMitbO interval that are BS toward the centromere could be either BS or SS at the proximal DCSX and SS at the distal DCSX. Depending on the mode of interaction between the two DCSXs, these chromosomes could be transmitted with a similar frequency as the reciprocal chromosomes. Chromosomes with crossovers in the DXMitbO-Xist interval show equal frequency of recipro-
cal haplotypes, either because both DCSXs are required on the same chromosome for DM1 or because each independently causes DMI. Regardless of the nature of their interaction, however, at least two DCSXs are required to explain three successive intervals showing normal transmission. Analysis of recombinant chromo- somes confirms the number and location of the DCSXs proposed with the segregation and modeling analyses. Epistasis: We next examined alternative explana- tions for incomplete DMI. We questioned whether DM1 was 85% rather than 100% because of incomplete pene- trance at the X-linked loci or whether “survival” of mice with the disfavored C57BL/6J derived the X chromo- some depended on cosegregation of C57BL/GJ-derived allele ( s ) elsewhere in the genome. Because the three crosses have been typed for large numbers of loci, these alternatives could be evaluated by testing for allelic asso- ciations, namely preferential occurrence of BS on the X chromosome and BS at the independently segregating locus, among all possible interlocus painvise compari- sons for the closest marker to each DCSX and autoso- mal marker loci in the three data sets. Significant associ- ations were sometimes found in one cross but not in the other crosses (Figure 5). We suspect that lack of reproducibility reflects sampling fluctuations or weak strain-specific effects, e.g., chromosome 4 in JAX2/J
(Figure 5). Simulation studies emphasize the impor- tance of replication in complex trait analysis (LANDER
and KRUCLYAK 1995).
Only on chromosome 2was strong, reproducible allelic association observed in the JAXl, EUCIB, and
JAXP/J
BSS crosses (Figure 5). Transmission of C57BL/GJde- rived alleles on the X chromosome depended strongly on cosegregation of C57BL/GJderived alleles on chro- mosome 2 (Table
2).
In the JAXl cross, transmission of the C57BL/GJEiderived X chromosome at DXMit87 was rare in the absence of C57BL/GJderived chromosome 2 alleles near D2Mit254 (2.4%; 1 of 41), but not when they were present (24.0%; 12 of 50, P<
0.006). Remarkably, the strongest association did not correspond to the locus showing the strongest DM1 in the JAXl cross. When test- ing all possible interlocus painvise comparisons for loci on chromosomes X and 2, the most significant allelic association was found with loci near Xist rather than Dcsxl, namely DxBirl5 and D2Mit254 ( P<
0.002). For the EUCIB cross, transmission of the C57BL/GJderived allele at Xist was 8.3% (15 of 181) or 23.1% (51 of221)
depending on absence or presence, respectively, of C57BL/GJderived chromosome 2 alleles at D2Mit?O4 ( P
<
0.00007). For the JAX2/J cross; transmission of the C57BL/GJderived allele at Hmgl7-n3was 12.2% ( 5 of 41) or 43.5% (20 of 46) depending on absence or presence, respectively, of C57BL/GJ-derived chromosome 2 alleles at Hmgl7-rs7 ( P<
0.0018). Hmgl7-rs3is located near Xist(HERMAN et al. 1994).
1746 X. Montagutelli, R. Turner a n d J . H. Nadeau
(a)
JAXl
cross:
0
SIS Fa] BISA B E F H K O P
0 10 20 30 40 50 60 70
0))
EUCIB
cross:
Number
of
animals
This Reciprocal haplotype haplotype
2 7
0 7
5 4
12 1
14 0
Number of
animals
This Reciprocal haplotype haplotype
3 27
10 20
16 1 1
20 12
29 2
P
0.18
0.016
1
0.003
0.0001
P
8.4 IOa
0.099
0.44
0.22
4.6 10"
FIGURE 4.-Frequency of recombinant X chromosomes in JAXl BSS and EUCIB BSS crosses. For each class, animals were sorted according to their genotype for the most centromeric marker, the most telomeric marker, and two markers depicted with vertical bars. For each cross, letters refer to loci (and offsets) listed in Table 1. Open boxes represent regions of chromosome X that are homozygous SS and shaded boxes regions that are heterozygous RS. A cross indicates that a crossing-over occurred between the two markers depicted with vertical bars. P i s the two-tail probability (as calculated from the binomial distribution) of observing a similar or greater deviation from the expected 1:l ratio between the two alternative chromosomes. The graph below the chromosomes illustrates the value of log(P) for each interval. (a) JAXl BSS cross (94 animals); (b) EUCIB BSS cross (429 animals).
JAXl cross and only 15 exceptions in the EUCIB cross. Several of these exceptional progeny have recombinant chromosomes with breakpoints in the interval flanking the locus showing the strongest association. For example, the exceptional mouse in the JAXl BSS cross has a cross- over between DXMit87and DXMit7, suggesting that Dcsxl
is near but telomeric to DXMit87. Finally, epistasis be- tween chromosomes 2 and X was asymmetric. Transmis- sion of Xlinked M. s@tusderived alleles did not depend on cosegregation of particular chromosome 2alleles, ix., 38
2"
7~ 402
'
in X' for the JAXl cross and 1702"
71s.166
2
'
in X' for the EUCIB cross (Table 2).Epistasis between chromosomes 2and Xaccounts for most but not all of the disfavored X-linked alleles that were transmitted; the remaining variation may reflect sex effects, reduced penetrance, epistasis with addi- tional loci that have weaker or more variable effects, or sampling fluctuations. Because additional partitioning of the data substantially reduces statistical power, it was
difficult to test these effects rigorously. However, it may be noteworthy that the distortion on chromosome 2 in animals that were BS for the X chromosome was statistically significant only among female progeny (fe- male progeny: JAXl, P
<
0.004; EUCIB, P<
2.0 X 10"'; JAX2/J, P<
0.007; male progeny: no significant differences in any of the three crosses). Thus, although DM1 is generally stronger in male than female progeny in all three crosses, the association between chromo- somes X and 2 occurred primarily among female prog- eny (Table 2). These results suggest that epistasis may be difficult to detect because of the small number ofx"
males, or because presence of2"
does not provide as strong "rescue" ofx"
in males as in females.DISCUSSION
Non-Mendelian Inheritance in Mice 1747
2
3
u
.sl b3
u
2
3
u
b3
u
cu
2
u
-I3
u
T3
T8
T S
0 " - o m "
!$Egg+
c o k t d O o P m E L
3 q h r F . e m
o u 3 g
5.:
ij
2
4
;
5
- 5 6 6 5
:
5
" & z . 0 ez s ; o g
% z
83
5.5
4 3 f 3 r d F
gS%s
2 . 2 ' E3 5 9 g . 2
P
2 - rd 6 %&
. Z 5 0 0 ~ 0
2
& $
".$,"
dk;'El5
> B
@'a& u - o O b g e O g a
C +
;;;g
g.2
P . 2 3 %
;.$..g.@
es..td&S u q
8
c abDB 8 2
o O a E . 0 M EC
o k . g' Z C ,
L 0LS
0 e.;;a 5 6
e t d o e , 0 ~
u s 2 0
8 .
0 E % , s h" A E a
O e , 0
E
2';
E 2 $
h E 5'33
ui
r d * 2 z
8
Eg . p E
qk;
g
g
g . g
$g
rd-;
$ z a bnu
2-c
a 0@
k k & u
0 5
.zu
3 E2;
g
0 .$ $ '2
z _ h a o . 3 . : : 3
g l d e , , "
" e M S - % q o v1
z . 9 u 3 3 e, 2
s T 5
0 td .L e, -a e 5 . C - 1 8z o b n a 8 o
E E':.$
gs
5
s 0
9 6
$3
29
h;2 . 5 . 5 c 0 4 %
a a 0 . 2 0 u > c
05
s $ s
g
;%
h;C",'S
.S2
8 b S
8
B
1 O L 1
A 0 u c E e , * E b n CdQ1
A g Q % 2 3
9 , - c ve
0g n 5 5 5
0 bD0
p s c $ , a E p - - X u $ - E ?
p
.e " S Q . G Z
$ 2
$ 2
5
e, 3.2 0'&$,o.?J
8
g
5
w E a $ & S ;
l g 2 s & b u
" % . 5 E g 2 r d
cFd&
a . z s3 o 0 2 E 4 $
"
b 4 2 - . G j c ,Es5,hE
c . 2 v y e o O ard rd
0 v E . S
-8
.. S
..
s
..
w
!i
.-.. 8
.. 8
w
.. 8
..
s
0
.. N
i!
.- .. Ss
- 8d m ? o
g
s
w
0
A m " ? o
-
-
A 0
TS
, , I - 0 7 9 *
' 0
T8
8
i.l
8w
-
I I I0
-ao
s
w
L1.
8w
" 0 7 I I
TP 8
8
s
w
!-J
0-
Ts
T8
T8
~~
S
s
- 0 : I ,
4 . ;
8
u
80
0
N
0
" 0 7 8 I
T - 8
s
do
88 8
w
0 T N8
8 S 8w
0S
s
8 S 3w
0 T Su:
88
w
u
88
3
8
0
- 0 7 I t
T-
w
0 T ?
dL$:
8
8 8s
Nb
.. ..8
"3
.. 8
.. 3
w
s
8 8 8w
0"
4
OT -
w
ON
s
3 8s
w
0 0s
0 .o 8 0 0 N 0l
!
._..
s
.. 8
.. 8
..
s
w
" 03
P
? &;$
- Lm
m
m a
B$
WG
m
Fi
nI
1
g ?
t S
m
2 s
d s
?$$
- LR
u a
3
.s
W &
of loci, and large samples sizes. Although DM1 is occa- for a single cross. As a result, statisticai fluctuations are sionally reported for linkage testing crosses, the evi- difficult to eliminate as an explanation (LANDER and
1748 X. Montagutelli, R. Turner and J. H. Nadeau
1
tl
4
B
3
.9
i
.3
cl
:!
P
c)
!I
B
4
3 +
i
*[r - Y
*
a
1
i
cy
s!
8
g
'Ei
s
1
1
f
!
.B
w"
a,
Z n B
v, v)E 0 2
a
8s.:
$ " ( $
e4
3 u
m5
8 ?
E O 2 %
c
u
a,
2
n B2
8 s 2
v)
a
D
2
f 2 3
Q
m
g u
2
$ 3
E 0 2 % o u
c
u
8,
2
9
3 9
P *Q a
c
f 2 2
0 u .z
L c . ( @ J
g u
M
3
v)b
m
% r
22
cU
2 %
3 d
& d Z %
0 0 0 0 0 0
I n a m + @ J z m @ J
o a b w c e g
Ne4
9 "
$ 3 3
2 2 2
Z
%
Q
3
g
Bi?$$3,
0 0 0 0 0 0
~ g b g m a
5 l
r(
-e4ouJ3*
I n ~ 3 a * ~
$
u$
u$
u2
5ln
0 3 m o o 3
W?%ZZ
3 0 3 5 l o 3
d 3 @ J
Z ' W " b 5 l Z 0 4
2 Q f q y c q f q y c q f q y
h h h
?gl?g
9 9 9
,x ,x
-8
8 8 Z
'2
h32
3
3
2
results for three large and independent crosses based on closely related strains. Similar results in independent crosses increases the chance that the results are real rather than sampling artifacts.
Two X-linked loci are proposed, one located near DXMit87 at -20.0 cM and the other located more te- lomerically near Xist at -42.0 cM. For the JAXl and EUCIB crosses, which involved different substrains of both C57BL/6 and M. spetus, DCSX loci were mapped to -21.3 and -20.5 cM (Table 1, Figures 1-3). Analysis of DM1 in mice with recombinant chromosomes mapped a DCSX to the same region in both crosses, namely the interval between -18.0 and -28.0 cM (Fig- ure 4). The failure to find similar evidence in the JAX2/
J
cross is perplexing, but may simply result from DM1 and statistical fluctuations. The most parsimonious ex- planation for these results is that a single DCSX near DXMit87 contributes to DMI. No evidence was found in any cross for epistasis involving this DCSX locus (Fig- ure 5 ) .Recently a locus affecting placental mass (Ihpd) was mapped near DXMit8 in interspecific backcrosses
( ZECHNER et al. 1996). In backcrosses to M. spretus, pla- cental mass was significantly decreased among heterozy- gous BS progeny as compared with their homozygous
SS sibs. By contrast, placental hypertrophy was found in reciprocal backcrosses to inbred strains of laboratory mice with placental weight being significantly higher among heterozygous BS segregants than among homo- zygous BB sibs. Differences in placental mass could lead
inheritance. The similar map locations for the centro- meric DCSX and loci controlling placental weight and
i
to biased embryonic lethality and to non-Mendelian9
e
p"
r
non-Mendelian inheritance is striking. In addition, epis- '3+
tasis must be involved to account for these differences.9
2
U P ) between segregating crosses and the parental strains
u o and genetic identity of the autosomal locus remain to
4
.1 be determined.3:
bE
other and near Xist at -42.0 cM. Modeling placed a4 95 the JAX2/J cross. Analysis of mice with recombinant
.-
v)&
chromosomes in the EUCIB cross supported this local-k%
-56.0 cM. Because relatively few X-linked loci have'E
'5
4:c
P
.9
Table 1),
insufficient recombinant chromosomes wereb 2 available for a meaningful analysis. No evidence was
;4
found for a telomeric DCSX in the JAXl cross, perhaps3 5
P , x locus than does C57BL/6J (EUCIB and JAX2/J). In all
2 8
three crosses, remarkably strong epistasis involved the0
83
(ZECHNER et al. 1996), but the chromosomal location s uL
All three crosses provided evidence for a more te- lomerically locus DCSX locus within 13 cM of each
DCSX at 47.3 cM in the EUCIB cross and at -36.6 in g o
k d
0 0
'2
Eization with a DCSX in the interval between -42.0 and
been typed in the JAXP/J cross (JOHNSON et al. 1994;
0
sP) because C57BL/6Ei (JAX1) has a weaker allele at this
O Q
same X-linked locus: near DXBir5 at -46.8 cM in the JAXl cross, near Xist at -2.0 cM in the EUCIB cross,
Non-Mendelian Inheritance in Mice 1749
Heterogeneity between these map localizations, be- tween -34.5 and -47.3 cM, is greater than for the centromeric DCSX. But heterogeneity is not surprising given the genetic and statistical variability for results with different crosses. In fact, the consistent map local- izations despite heterogeneity is striking. The most par- simonious explanation for these results is therefore that a second DCSX near Xist contributes to DM1 and shows strong epistasis with a locus on chromosome 2.
SIRACUSA et al. (1991) found strong DM1 favoring "spetus"derived alleles and mapping to the central portion of chromosome 2 for female progeny; DM1 in male progeny mapped near the telomere. No evidence for epistasis was detected. Although DM1 did not occur on chromosome 2 in the BSS crosses, strong epistasis involving genes on the similar portion of the chromo- some was detected (Table 2, Figure 5). It is possible that these two effects, namely, DM1 in BSB crosses and epistasis in BSS crosses, are different manifestations of the same chromosome 2 gene.
A curious and perhaps informative feature of these crosses is similar litter sizes in the reciprocal back- crosses. If DM1 results from lethality of particular em- bryos, then litter sizes could be smaller in backcrosses to M. spetus than in crosses to C57BL/6J. However, review of the breeding records provided little evidence for a difference in litter size (results not shown;
CJ:
EU-1994;JOHNSON et al. 1994; ROWE et al. 1994). A possible explanation is that DM1 occurs early in development before litter size is determined. If gametogenesis is bi- ased, or if more embryos are conceived than implant and loss of some embryos allows others to survive, then DM1 without litter size reduction could occur. For t haplotypes, the effects of distortion are revealed at con- ception and litter sizes are not substantially reduced, despite a transmission ratio of 90% (CHESLEY and DUNN 1936; SILVER 1985). This hypothesis predicts that DM1 in interspecific crosses results from biased oogenesis in eggs fertilized by sperm from M. spetus but not from C57BL/6J (CJ: AGULNIK et al. 1993a; RUVINSKY 1995) or that DM1 arises from loss of certain embryos before implantation. Studies addressing this question are un- derway.
The mechanism responsible for the non-Mendelian inheritance remains unclear. Because DM1 is not o b
served when F1 females are mated with B6 males, the simplest hypothesis is that deviation originates from early death of embryos with specific combinations of alleles. However, an additional hypothesis is required to explain the empirical data. In the EUCIB cross, only 10 (13%)
p p
males arePI",
whereas 68 (87%) arepp.
Under the differential embryonic viability model, this deviation from equal frequency is explained by par- tial lethality of the22
p p
males. However, F1 males, which are alsop p
pp,
should also be affected and a reduced number of males per F1 litter should result. ROPEAN MOUSE BACKCROSS COLLABORATIVE GROUPBecause lethality of
x"x"
females is partially avoided by M. spetus-derived alleles on chromosome 2 (Table 2), F1 female embryos should be less affected than males, resulting in strong sex ratio distortion (one1 male per four females). Such distortion has not been reported in the literature or observed in our experience (data not shown). This model would require either that addi- tional autosomal loci (undetected so far) are involved in the epistatic control of DMI, or that the lethality associated with thep p
orx"xs
genotype depends on the genotype of the mother that transmitted thep
chromosome (no lethality ifp
transmitted by a C57BL/6J female and partial lethality if transmitted by an F1 female).1750 X. Montagutelli, R. Turner and J. H. Nadeau
may therefore represent an opportunity to study the evolution of coadapted genes that contribute to repro- ductive isolation and speciation.
Epistasis involving unlinked loci is not a common feature of the classical examples of DMI. SD, t haplo- types, the HSR inversion, and many other examples of DM1 involve closely linked loci that act as “selfish DNA,” in violation of Mendel’s laws (SILVER 1993). Par- ticular combinations of alleles at these loci are called haplotypes. Preferential transmission of selfish haplo- types to the detriment of alternative haplotypes results in DMI. Distortion can occur in females, e.g., one chro- mosome is preferentially included in the egg nucleus rather than the polar body (AGULNIK et al. 199313; RU- VINSKY 1995), or in males, e.g., sperm with a particular chromosome are preferentially transmitted (SANDLER and GOLIC 1985; SEITZ and BENNETT 1985; LYITLE 1991). Chromosome rearrangements such as inversions protect these haplotypes from crossingover and recom- bination, thereby preserving the selfish alleles (LYON
1984; SANDLER and GOLIC 1985; SILVER 1985; LWTLE 1991; ACULNIK et al. 1993a,b; CROW 1991; RUVINSKY 1995). Unlinked loci are rarely involved because inde- pendent assortment disrupts the allelic combination re-
quired for DM1 (HARTL 1975; THOMSON and FELDMAN
1974-1976; LIBERMAN 1976; ESHEL 1985; CROW 1991;
HAIC and GWEN 1991; HURST and POMIANKOWSKI
1991a). Unlinked modifiers of DM1 have been de- scribed in these systems, but their effects are generally weak (BENNETT et al. 1983; SANDLER and GOLIC 1985;
The effect of the chromosome 2 locus is consistent with theoretical expectations in that the C57BL/6J-de- rived allele decreases rather than increases DMI. As CROW (1991) showed, selection favors unlinked mod- ifiers that reduce DMI. As shown in Table
2,
DM1 for X-linked loci in pooled data for the three crosses is 91.3% (221 of 242 progeny) without the C57BL/6J- derived allele and only 73.8% (234 of 317 progeny) with the allele. Of course, DM1 in these interspecific crosses would only occur in hybrid zones between natu- ral populations. Presumably the combinations of alleles that occur within each population or species are mutu- ally adapted and it is only in interspecific crosses that allelic incompatibilities are manifested. The effect of the chromosome 2 gene as a modifier of DM1 may therefore be a special case because it would have limited opportunities to evolve as a response to X-linked DMI.MULLER (1942) showed that allelic incompatibilities should be asymmetric: if one combination of alleles at two loci is incompatible, the other combination must be compatible. This phenomena has been called “rein- forcing” epistasis (CROW and KIMURA 1970, pp. 80-
81), where a maladaptive effect at one locus depends on the genotype at other loci. The interspecific crosses described here represent an example of this phenom- ena. The allelic combinations
2”’
andp‘
in females CROW 1991).(and
x
in males) are incompatible, but 2’;’ andps
(and in males),2B“
andp‘
(and in males but to a lesser extent), and2’
andp’
(and in males) are compatible. This asymmetry may simply reflect an intermediate stage in the divergence of interacting pro- teins where one protein must lose its ability to interact first, e.g., a receptor loses its ability to recognize a ligand before the ligand loses its ability to activate the receptor.Reinforcing epistasis may also explain why DM1 does not occur in reciprocal backcrosses, but instead occurs only in backcrosses to M. spretus and not to C57BL/6J. In backcrosses to C57BL/6J, all progeny have C57BL/ 6J-derived chromosome 2 alleles that seem to be re- quired for transmission of C57BL/GJ-derived the X
chromosome alleles (Table 2). But in crosses to M. spretus, progeny will be at a disadvantage if they inherit the CFiyBL/GJ-derived the X chromosome without also inheriting the C57BL/GJ-derived chromosome 2. Rein- forcing epistasis may represent a step in the process leading to reproductive isolation, The next step might be loss of the alternative allelic incompatibility, e.g., 2H“
and
p’,
and speciation.The parental strains used in these crosses cannot be strictly compared with natural populations for at least two reasons. First, C57BL/6J, like most laboratory in- bred strains, is an artificial hybrid whose genome is composed of DNA derived from at least two different subspecies, namely M . musculus domesticus and M. muscu- lus musculus. Second, C57BL/6J and SPRET/Ei are in- bred strains where genetic variation is rarely found. However, these interspecific backcrosses provide a sim- ple experimental system to investigate genetic coadap- tation because mice with various allelic combinations can be created and characterized. Allelic interactions may not be similar to those acting in wild populations, particularly since M. musculus domesticus and M. spretus
are sympatric in parts of their range but very rarely interbreed or produce hybrids. However, these crosses can be used as a model to study coadapted genes that contribute to reproductive isolation and speciation.
Finally, it is tempting to speculate that an anomaly in Xinactivation (or reactivation) (CHAPMAN 1986; RAS
TAN 1994) accounts for DMI. In the EUCIB and JAX2 crosses, an X-linked DCSX gene maps near Xist, the candidate gene for X inactivation (BROCKDORFF et nl.
1991, 1992). In addition, the X-linked locus showing the strongest association with loci on chromosome 2 is near
Xist
in all three crosses. If the timing or specificity of Xinactivation (or reactivation) differed between the species represented in these inbred strains, fertilization or embryogenesis might be compromised (KAY et al.1993). An autosomal locus is thought to be involved in controlling X inactivation (or reactivation), but its location and identity are unknown (KAY et al. 1994). If
it is on chromosome 2 near D2Mit254 and D2Mit304