20th International Conference on Structural Mechanics in Reactor Technology (SMiRT 20) Espoo, Finland, August 9-14, 2009 SMiRT 20-Division 5, Paper 1669
Seismic Analysis of Reactor Building of a NPP including Soil Structure
Interaction Effects and Comparison with Two Additional Sites
Khawaja Ahsan Qadeer
a, Muhammad Sadiq
b, Rong Pan
c, Hou Chunlin
da
School for Nuclear and Radiation Safety, Pakistan Nuclear Regulatory Authority, P. O. Box 1912, Islamabad, Pakistan, [email protected]
b
Directorate of Nuclear Safety, Pakistan Nuclear Regulatory Authority, P. O. Box. 1912, Islamabad, Pakistan, [email protected]
c
Siting and Structure Division, Nuclear and Radiation Safety Centre, SEPA, P. O. Box. 8088, Beijing, P. R. China, [email protected]
d
Siting and Structure Division, Nuclear and Radiation Safety Centre, SEPA, P. O. Box. 8088, Beijing, P. R. China, [email protected]
Keywords: Seismic Analysis, Soil Structure Interaction, Floor Response Spectra, Reactor Containment Building.
1
ABSTRACT
This paper is a part of the outcomes of joint research program between Nuclear and Radiation Safety Centre (NSC), SEPA, and Pakistan Nuclear Regulatory Authority (PNRA) in the dynamic seismic analysis of a NPP including the soil structure interaction (SSI) effects and comparison with two additional sites in P. R. China, where the same design NPPs with some minor modifications are being built. These sites have their own soil conditions and seismicity with significant differences in terms of SSE and soil stiffness parameters. Simplified lumped mass stick model for time history analysis of reactor containment building along with internal structures is made in SAP2000 advanced V 11.0.2. The load-dependent Ritz vectors are used in modal analysis instead of Eigen vectors for more accurate results in seismic analysis. In SSI analysis, the elastic half space theory is used for calculating translational and rotational springs from both RCC-G and ASCE 4-98 Standards with also taking the layering effects of soil. Floor response spectra are generated and enveloped for their lower and upper stiffness values of soil at various floors of each site and compared with the design FRS. These FRS are developed for the two standards and also with and without taking the layering effects of soil using RCC-G and comparison is made. This analysis not only gives a better understanding of the differences between RCC-G and ASCE 4-98 in terms of SSI which found to be insignificant, but also the evaluation of new SRP section 3.7.2 rev 3 in considering layering effects of soil media for half space modelling. It is suggested that the layering effects of soil should not be mandatory for the seismic evaluation of existing nuclear facilities especially for shallow foundation.
2
INTRODUCTION
An earthquake of Magnitude 7.6 occurred on October 8, 2005 in Northwest of Pakistan which was the deadliest earthquake in the recent history of the sub-continent resulting in more than eighty thousand casualties, two hundred thousand injured, and more than four million people who have been left homeless. This has jolted all the civil engineers in Pakistan in general and strategic organizations like Pakistan Nuclear Regulatory Authority (PNRA) in particular. PNRA management decided to increase its knowledge and skills in the areas of seismic safety review and analysis and also to start research and development in this key area. A joint training and research program in the areas of dynamic seismic analysis and seismic safety review is initiated by PNRA at the Nuclear and Radiation Safety Centre (NSC), State and Environmental Protection Agency (SEPA), P. R. China. This paper is the outcome of the research in the areas of time history analysis of reactor building including the soil structure interaction effects using the two standards RCC-G [1] appendix A and ASCE 4-98 [2]. FRS developed from these two standards are enveloped for lower and upper stiffness values and compared with each other and with the design FRS. Another comparison is made by taking the layering effect of soil using a Chinese National Standard GB 50267-97 [3] to evaluate the new SRP section 3.7.2 rev. 3 [4] on three different sites.
3
MATHEMATICAL MODELLING
3.1 Structural Model
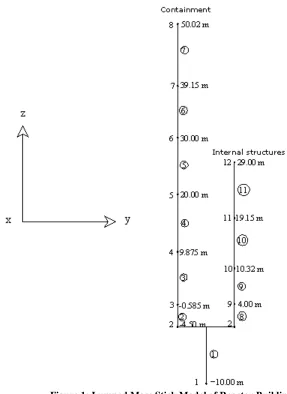
A simplified lumped mass stick model is made in SAP2000 advanced V 11.0.2 as shown in fig 1. The following masses are taken into account and are lumped at the main floors:
Dead load of the concrete and steel structures
Fixed equipments
The part of the operating load present during normal operations
Torsion is not taken into account due to quasi-symmetry of structure.
Figure 1: Lumped Mass Stick Model of Reactor Building
3.2 Modelling of the Soil and Soil Structure Interaction
There is a narrow range of variation of dynamic parameters below the foundation base level. For
three different sites, the following values of table 1 are taken into account:
Table 1: Soil Properties of Different Sites
Site 1 Site 2 Site 3
Dynamic Shear Modulus (MPa) 9700~13000 7060-7480 10000-12000
Poison Ratio 0.32 0.39 0.31
Unit Weight (Kg/m3) 2650 2500 2600
In accordance with the relatively homogeneous characteristics of the subsoil at all three sites, the ground is linked by using elastic half space modelling of soil with three translational springs and three rotational springs. The SAP2000 link support feature is used for modelling of soil media for these six stiffness values and their respective damping.
Because of the great rigidity of the subsoil, the interaction between buildings is negligible, so containment building is considered as isolated. Additionally the back-fill effect of the excavation is ignored in the analysis.
Two methods have been adopted for the calculation of springs and their respective damping ratios:
3.2.1 Frequency Dependent Soil Springs using RCC-G approach
The foundations can be considered as shallow and sufficiently rigid, the ground is represented by a spring system linking the nodes representing the structure foundation to the free field reference. SSI analysis is done using impedance function as mentioned in RCCG [1]. Each spring is defined by its rigidity and its reduced damping, which depend upon the model soil structure frequency.
3.2.1.1 Calculation of Rigidity Coefficient
These are calculated for each earthquake direction, using the following expressions:
KV = G r FV (1)
KH = G r FH (2)
KR = G r 3
FR (3)
where
KH = Soil translational rigidity coefficient in X and Y direction.
KV= Soil translational rigidity coefficient in Z
KR = Soil rotational rigidity coefficient in X, Y direction.
G = Dynamic Shear Modulus
r = Radius of foundation equivalent circle
FV, FH, FR= Dimensionless coefficients, which are expressed as function of transmission coefficient by eqns. (4, 5 and 6):
2
2
2 1
1
V V
V V
f
f
f
F
+
=
(4)2
2
2 1
1
H H
H H
f
f
f
F
+
=
(5)2
2
2 1
1
R R
R R
f
f
f
F
+
=
(6)The values of fv1, fv2, fH1, fH2, fR1, fR2 are mentioned in tables of Ref [1] as the function of Poison Ratio and Transmission Coefficient α given in eqn. (7):
5 . 0
! " # $ % &
=
G r i
'
(
)
(7)ωi = Fundamental ground–structure pulsation determined using preliminary modal calculation,
ρ = ground density
The transmission coefficient tables were compiled by G. DELEUZE, based on the following assumptions:
Ground is semi-infinite, elastic, homogeneous and isotropic solid, delimited by a plane
Ground reaction beneath the foundation is linear
Geometrical damping corresponds to wave radiation through the ground.
3.2.1.2 Calculation of Reduced Damping
The reduced damping corresponds to wave radiation through the ground. For each spring, it is the sum of:
Half of the geometrical damping which is calculated for each component of earthquake movement, each mode and each type of ground spring as the function of Poison Ratio and Transmission Coefficient α and expressed as eqns. (8, 9 and 10):
1 2
2
V V Vf
f
!
=
"
(8)1 2
2
H H Hf
f
!
=
"
(9) 1 22
R R Rf
f
!
=
"
(10)3.2.2 Frequency Independent Soil Springs using ASCE 4-98 approach
The soil below the foundation is relatively uniform to a depth equal to the largest foundation dimension, frequency-independent soil spring and dashpot constants, as shown in table 2.
Table 2: Lumped Representation of Structure-Foundation Interaction [2]
where
3 8 / ) 1 (3 v I R
B" = # O
!
It= Polar moment of Inertia
Io= Total mass moment of inertia of structure and basemat about the rocking axis at the base;
4
MODAL ANALYSIS AND NATURAL MODES OF VIBRATIONS
Research has indicated that the natural free-vibration mode shapes are not the best basis for a mode-superposition analysis of structures subjected to dynamic loads. It has been demonstrated (Wilson, Yuan, and Dickens, 1982) that dynamic analyses based on a special set of load- dependent Ritz vectors yield more accurate results than the use of the same number of natural mode shapes [5].
The 100% mass participation is included in the modal Ritz Vector analysis. The structure has total 33 stiffness degree of freedom and 22 mass degree of freedom so the total no. of 33 equilibrium equations formed by SAP2000. Because the results are generally more accurate for the lower modes and gradually deteriorate for the higher modes so the number of Ritz vectors included should be sufficient to determine the desired no. of modes [6], so 22 modes are taken in the analysis as shown in table 3.
Table 3: Model Periods and Mass Participation Ratios Mode
No Period Frequency Mass UX Mass UZ
Mass SumUX
Mass SumUZ Unitless Sec Cyc/sec Unitless Unitless Unitless Unitless 1 0.24339 4.1086 0.07613 0.000386 0.07613 0.000386 2 0.211812 4.7212 0.009276 0.000105 0.08541 0.000491 3 0.150266 6.6549 0.02392 0.000319 0.11 0.00081 4 0.116534 8.5812 0.29 0.000361 0.39 0.001171
Motion Equivalent Spring Constant Equivalent Damping Coefficient Horizontal v GR v k
kX Y
8 7 ) 1 ( 32 ! ! =
= cX =cY =0.576kXR
!
/GVertical v GR kZ ! = 1
4 c k R G
Z Z =0.85
!
/Rocking (X and Y)
)
1
(
3
8
3v
GR
k
!
=
"
c
1
B
k
R
/
G
30
.
0
!
" ""
=
+
Torsion
3
16
GR
3k
t=
3
/ 2
1 I R
5 0.089921 11.121 0.18 3.82E-05 0.58 0.001209 6 0.067615 14.79 0.03294 0.001916 0.61 0.003126 7 0.054146 18.469 0.00234 0.002055 0.61 0.005181 8 0.046814 21.361 0.00432 0.01093 0.61 0.01612 9 0.038441 26.014 0.03597 0.00054 0.65 0.01666 10 0.03347 29.877 0.000372 0.03688 0.65 0.05354 11 0.032617 30.659 7.42E-05 0.000824 0.65 0.05436 12 0.028038 35.666 0.001605 0.11 0.65 0.16 13 0.027885 35.862 0.001598 0.006833 0.65 0.17
14 0.02653 37.693 0.003387 0.27 0.66 0.44
15 0.025075 39.881 0.01121 0.06476 0.67 0.5 16 0.020212 49.475 0.007504 0.003491 0.68 0.5 17 0.019121 52.3 0.001416 9.08E-05 0.68 0.5 18 0.0175 57.144 0.001915 0.000151 0.68 0.5 19 0.016944 59.019 0.009222 0.46 0.69 0.96
20 0.014679 68.126 0.13 0.03149 0.82 1
21 0.012536 79.773 0.00036 9.91E-05 0.82 1
22 0.009786 102.19 0.18 0.004469 1 1
5
TIME HISTORY INPUT MOTION
For time history analysis of NPP at site 1; a synthetic earthquake time history, called LBNS, which was generated from records of the earthquake occurred at Long Beach in 1933, is used. In order to avoid discrepancies between the resulting horizontal response spectrum and the NRC design response spectrum three time histories LBNS (time-step = 0.01s), LBNS M10 (time step = 0.009s), LBNS P10 (time step = 0.011s instead of 0.01s) are used.
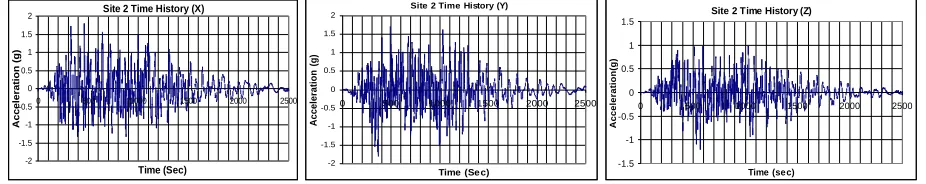
In site 2 analysis, its own site specific time history of 25 seconds (2500 time steps) duration with a time step of 0.01 second is used as shown in Fig 2.
Site 2 Time History (X)
-2 -1.5 -1 -0.5 0 0.5 1 1.5 2
0 500 1000 1500 2000 2500
Time (Sec)
A
c
c
e
le
ra
ti
o
n
(
g
)
Site 2 Time History (Y)
-2 -1.5 -1 -0.5 0 0.5 1 1.5 2
0 500 1000 1500 2000 2500
Time (Se c)
A
c
c
e
le
ra
ti
o
n
(
g
)
Site 2 Time History (Z)
-1.5 -1 -0.5 0 0.5 1 1.5
0 500 1000 1500 2000 2500
Time (sec)
A
c
c
e
le
ra
ti
o
n
(g
)
Figure 2: Three components of Time history at site 2
For site 3 analysis, time history records at LingAo having 30 seconds duration are used. All the time histories are statistically independent and are applied simultaneously and analysis are performed for the ½ SSE (OBE). The generated FRS is smoothened and broadened by 15% as per Ref [7].
As the use of appropriate site-dependent free-field earthquake motions and selection of realistic massless springs at the base of the structure are the only modelling assumptions required to include site and foundation properties in the earthquake analysis of most structural systems [8]. Therefore every site has its own statistically independent time history and realistic massless springs to generate accurate and realistic results.
6
RESULTS AND DISCUSSION
6.1 Comparison of FRS using RCC-G and ASCE 4-98 Standards
Although these differences are considerable; but have insignificant impact on FRS generated from both standards as shown in the figures 3 to 5 for site 1.
This is due to the reason that these sites are on stiffer soil conditions which overcomes the relative differences in their stiffness values.
Horizontal FRS at -4.5m
0.01 0.1 1
0.1 1 Frequency (Hz) 10 100
A
cc
el
er
at
io
n
(
g
)
ASCE Stif f ness FRS RCCG Stif f ness FRS Design FRS
Vertical FRS at -4.5m
0.01 0.1 1
0.1 1 10 100
Frequency (Hz)
A
cc
el
er
at
io
n
(g
)
ASCE Stif f ness FRS RCCG Stif f ness FRS Design FRS
Figure 3: Site 1 FRS at -4.5m (Joint Floor of Internal Structure with Containment)
Horizontal FRS at 29m
0.01 0.1 1 10
0.1 1 Frequency (Hz) 10 100
A
c
c
e
le
ra
ti
o
n
(
g
)
ASCE Stif f ness FRS RCCG Stif f ness FRS Design FRS
Vertical FRS at 29m
0.01 0.1 1
0.1 1 Frequency (Hz) 10 100
A
c
c
e
le
ra
ti
o
n
(
g
)
Design FRS
ASCE Stiffness FRS
RCCG Stiffness FRS
Figure 4: Site 1 FRS at 29m (Top of Internal Structure)
Horizontal FRS at 50.02m
0.01 0.1 1 10
0.1 1 10 100
Fre que ncy (Hz)
A
cc
el
er
at
io
n
(
g
)
ASCE Stif f ness FRS RCCG Stif f ness FRS Design FRS
Vertical FRS at 50.02m
0.01 0.1 1
0.01 0.1 Frequency (Hz)1 10 100
A
c
c
e
le
ra
ti
o
n
(
g
)
Design FRS ASCE Stiffness FRS RCCG Stiffness FRS
6.2 Comparison of SAP2000 FRS (RCC-G and ASCE 4-98) with the Design FRS
6.2.1 At the joint floor of Containment and Internal Structure (El -4.5m)
For site 1, as the input time history is same (i.e. LBNS time history) so the difference is smaller particular to the frequencies lesser than 6Hz.
For site 2, the calculated FRS is significantly lesser than the design FRS (design FRS). It is due to the site specific time history of site 2 and difference in their eigen values.
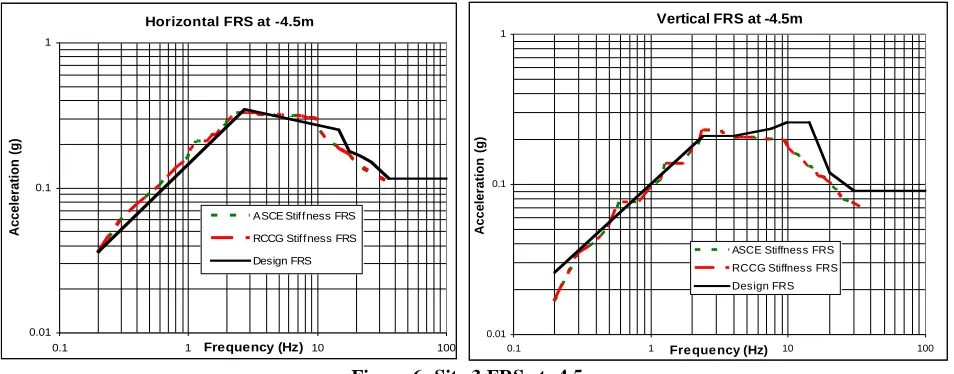
At site 3, the design and calculated FRS (from RCC-G and ASCE 4-98) has similar values except for the minor differences above the frequency of 10Hz.
Horizontal FRS at -4.5m
0.01 0.1 1
0.1 1 Frequency (Hz) 10 100
A
c
c
e
le
ra
ti
o
n
(
g
)
ASCE Stiffness FRS RCCG Stiffness FRS Design FRS
Vertical FRS at -4.5m
0.01 0.1 1
0.1 1 Frequency (Hz) 10 100
A
c
c
e
le
ra
ti
o
n
(
g
)
ASCE Stiffness FRS RCCG Stiffness FRS Design FRS
Figure 6:Site 3 FRS at -4.5m
6.2.2 At the Top of Internal Structure (El 29m)
The calculated horizontal FRS has peak acceleration between the frequencies of 10-15 Hz for all sites due to their Ritz vector values as compared to the design values which have the peak values between 4-7 Hz. The acceleration between 10-15 Hz is little larger than the design values (at site 1 and site 3) but the difference in shape is significant as shown in fig 4 for site 1.
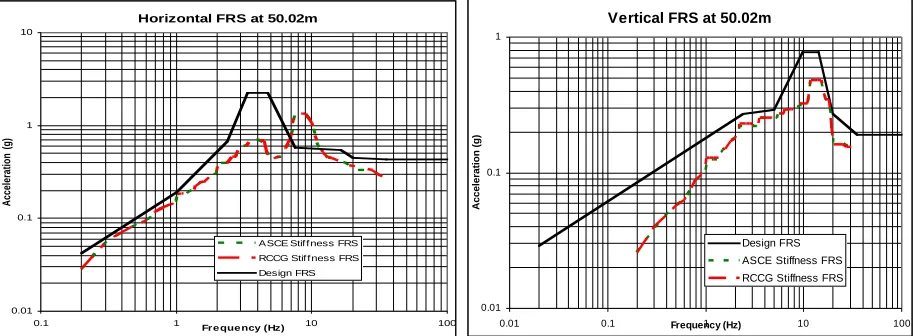
6.2.3 At the Top of Containment (El 50.02m)
At this point the differences in calculated horizontal FRS with design FRS are much pronounced. Although the maximum acceleration is not exceeded from the design values but the frequencies of the peak acceleration is between 8-11 Hz while in design it is 3 to 4 Hz. The calculated FRS has also a peak in 3 to 5 Hz but the maximum acceleration occurs between 8-11Hz where it exceeds the design values as shown in fig 5 for site 1. As at the top of the containment, there are no equipments so the results have no adverse effect for actual design results.
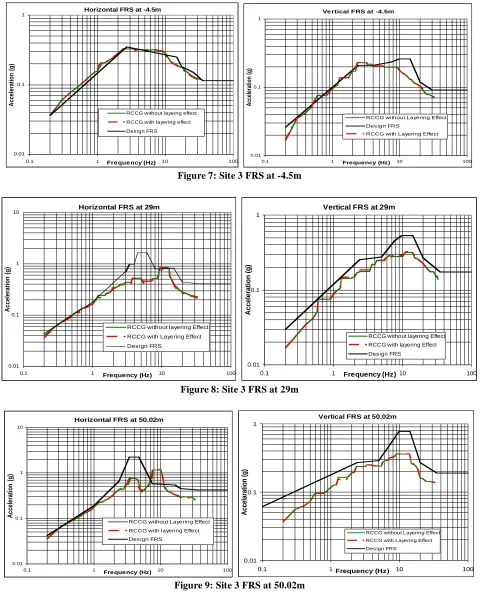
6.3 Soil Layering Effect on the FRS
The soil stiffness by including the layering effect increases about 10%; but there is no noticeable difference in the FRS at all the floor levels and also at all three sites. Hence, it is verified that the consideration of layering effects of soil media for half space modelling, as in new requirement of SRP section 3.7.2 rev. 3, has not significant influence on the floor response spectra especially for the NPPs on the stiff soil (shallow foundations). Figures 7 to 9 shows both FRS for the site 3 with and without considering the layering effect of soil.
Horizontal FRS at -4.5m
0.01 0.1 1
0.1 1 Fre que ncy (Hz) 10 100
A
c
c
e
le
ra
ti
o
n
(
g
)
RCCG without layeing effect RCCG with layering effect Des ign FRS
Ve rtical FRS at -4.5m
0.01 0.1 1
0.1 1 Frequency (Hz) 10 100
A
cc
el
er
at
io
n
(
g
)
RCCG without Layering Effect Des ign FRS
RCCG with Layering Effect
Figure 7:Site 3 FRS at -4.5m
Horizontal FRS at 29m
0.01 0.1 1 10
0.1 1 Frequency (Hz) 10 100
A
c
c
e
le
ra
ti
o
n
(
g
)
RCCG without layering Effect RCCG with Layering Effect Des ign FRS
Vertical FRS at 29m
0.01 0.1 1
0.1 1 Frequency (Hz)10 100
A
c
c
e
le
ra
ti
o
n
(
g
)
RCCG without layering Effect RCCG with layering Effect Design FRS
Figure 8:Site 3 FRS at 29m
Horizontal FRS at 50.02m
0.01 0.1 1 10
0.1 1 Frequency (Hz) 10 100
A
cc
el
er
at
io
n
(
g
)
RCCG without Layering Effect RCCG with layering Effect Des ign FRS
Vertical FRS at 50.02m
0.01 0.1 1
0.1 1Frequency (Hz) 10 100
A
cc
el
ar
at
io
n
(
g
)
RCCG without Layering Effect RCCG with Layering Effect Des ign FRS
Figure 9:Site 3 FRS at 50.02m
7
SUMMARY AND CONCLUSION
1. The soil stiffness values using half space modelling of soil media by ASCE 4-98 standard are higher (about 10%) than the same values calculated from the formulas given in RCC-G standards.
3. It is suggested that the new requirement of SRP for taking the layering effect of soil springs in half space modelling should not be mandatory for the seismic evaluation of existing nuclear facilities especially for shallow foundation.
Acknowledgements:
The first two authors wish to pay their gratitude to the management of PNRA who not only gave them opportunity to work on this key project but also their ample support. The authors are grateful to the management of Nuclear and Radiation Safety Centre (NSC) for providing facilities and cooperation which corroborate the mutual coordination between the two organizations.REFERENCES
[1] RCC-G Standard, Design and Construction Rules for Civil Works of PWR Nuclear Islands, July 1988.
[2] ASCE 4-98 Standard, “Seismic Analysis of Safety-Related Nuclear Structures and Commentary, American Society of Civil Engineers, 2000.
[3] Chinese National Standard, “Code for Seismic Design of Nuclear Power Plant” GB 50267-97, 1998. [4] U. S. Nuclear Regulatory Commission NUREG-0800, Standard Review Plan, section 3.7.3, Seismic
System Analysis Rev. 3 2007.
[5] CSI Analysis Reference Manual for SAP2000, ETABS and SAFE, Computers and Structures, Inc. Berkeley, California, USA, March 2007.
[6] Chopra A. K., “Dynamics of Structures” 2nd Edition Prentice Hall, Englewood Cliffs, New Jersey 2001.
[7] US Nuclear Regulatory Commission “Development of Floor Design Response Spectra for Seismic Design of Floor-Supported Equipment or Components” RG 1.122 Rev. 1 Washington, D. C. USA, Feb. 1978.
[8] Edward L. Wilson, “Three-Dimensional Static and Dynamic Analysis of Structures A Physical
Approach With Emphasis on Earthquake Engineering” Computer and Structures Inc. Berkeley,
![Table 2: Lumped Representation of Structure-Foundation Interaction [2] Equivalent Spring Equivalent Damping](https://thumb-us.123doks.com/thumbv2/123dok_us/1691738.1213915/4.595.111.486.682.776/lumped-representation-structure-foundation-interaction-equivalent-equivalent-damping.webp)