Study of a simulation analysis for the results of the shaking table test
under centrifuge gravity
Shinya Ishikawa1, Yasuo Okochi1,
Mamoru Furue2, Kazuki Soma2, and Naohito Adachi3
1 Civil & Architectural Engineering Dept., Chubu Electric Power Co., Inc., Nagoya, Japan
2 Nuclear Power Department, Kajima Corporation, Tokyo, Japan
3 Kajima Technical Research Institute, Kajima Corporation, Tokyo, Japan
ABSTRACT: This paper present both experimental and analytical study on dynamic behavior of structure
with low ground contact ratio of basemat under intensive excitation. Analytical models, 3D-FE model, lattice model and enhanced lattice model, are proposed and the analytical results have a good agreement with the experimental results. The enhanced lattice model can express dynamic behavior of structure with low ground contact ratio of basemat.
1. INTRODUCTION
Recently, huge earthquakes have occurred in Japan. When we carry out seismic response analyses for earthquake motions of more than 1.0 G, the foundation of the structure is greatly overturned in analysis. Therefore, it is necessary to establish the analysis method which can express the overturning behavior of structure and the behavior of dynamically up-lifted foundation under the huge earthquake.
For confirming the dynamic behavior under low ground contact ratio of basemat, we carry out the
shaking table test1),2),3) under centrifuge gravity. The experimental dynamic tests with low ground contact
ratio of basemat, 20% to 60%, are very few. We think that it is difficulty to clearly grasp the structural behavior in low ground contact ratio by the experiment on the rigid materials, so make the bearing soil by the kaolin clay.
And the simulation analysis4),5) is carried out to investigate the analysis model that could express
these results. The soil-structure interaction models are the 3D-FE model (3D-FEM), the lattice model and the enhanced lattice model. The 3D-FEM of the soil is made by the gap spring between the soil and the basemat. The lattice model is the lumped mass beam model type, and soil-structure interaction is considered by the spring of the rotational – vertical interaction for basemat uplift. The enhanced lattice model is made by using soil stiffness matrix and the gap elements. It is investigated that all models, especially the enhanced lattice model, are effective to express the overturning behavior of structure and the behavior of dynamically up-lifted basemat under the huge earthquake. By analyzing the experimental results, it is thought that the clay-soil adjacent to the structure model is softened. Therefore, the softened soil properties are used for the 3D-FEM, and the equivalent soil properties to the relationship between softened property and original property are used for the lattice model and the enhanced lattice model.
2. Shaking Table Test under Centrifuge gravity 2.1 Test Condition
The condition of the shaking table test under centrifuge gravity is follows. 1) The centrifugal acceleration is 25 G.
Figure 1 Input Motion
Figure 2 is centrifuge test model and measuring instruments, Figure 3 is the structure model, and Figure 4 is photograph of the structure model and test situation. We measure the horizontal and vertical acceleration of the structure and soil model, the horizontal and vertical displacement of the structure model, and the earth-pressure of the foundation bottom. The earth-pressure of the foundation side is measured at the other case with embedded. By using the earth-pressure of the foundation bottom, the ground contact ratio is calculated. The structure model is 12 cm square in plan. The height is 19.5 cm. The height at the center of gravity is 13.3 cm. Its weight is 75.5 kN. The first frequency at the fixed-base is 6.5 Hz.
Figure 2 Centrifuge Test Model and Measuring Instruments
(a) Parallel to Excitation Dir. (b) Orthogonal to Excitation Dir. (c)Bottom of Foundation
Figure 3 Structure Model (unit: mm)
Figure 4 Photograph of Structure Model and Test Situation
-2.0 0 2.0
0 50 100 150 200
Horizontal Acceleration(g)
Ss2
t(s)
t(s) 0
2 4 6
0.1 1
Accelerat
ion (g)
Period(s) 5
Ss2
B=120 Excitation direction
H
=19
5
50
145
H
=19
5
5
0
145
B=120 27 27 19.5 27 19.5
Lateral Earth Pressure
51
0
1
0
10
5
B=
12
0
27
27
27
27
6
6
B=120 Excitation direction
9 9 9 9 9 9 9 9 6
69 9 9 9 9 9 9 9 9 9 9 96
69 9 9 9
D=120 0
Excitation Direction
Earth Pressure Gage
(a) Structure Model (b) Test Situation
time(s)
Horizontal Acceleration (G)
Ac
ce
ler
ati
on
Re
spo
ns
e
Spe
ct
ra(
G)
2.3 Dynamic Property Experimental results of Kaolin Clay
The characteristics test of kaolin clay as the bearing soil is carried out. Figure 5 shows the results of the tests determining dynamic properties under the pressures of 49 kPa, 98 kPa, and 196 kPa as 10 cycles.
Figure 5 Results of Dynamic Properties
2.4 Test Cases
The cases of tests are four levels of expected ground contact ratio from 20% to about 100%. CASE 1) Input 0.11 G: the ground contact ratio is about 60%
CASE 2) Input 0.20 G: the ground contact ratio is about 40% CASE 3) Input 0.32 G: the ground contact ratio is about 20%
CASE 4) Input 0.04 G: (for reference) the ground contact ratio is 100%
2.5 Experimental results
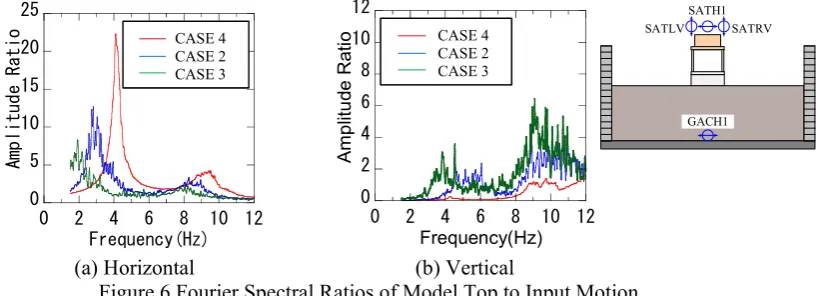
(1) Horizontal and Vertical Seismic Characteristics of Structure
Figure 6 is the Fourier spectral ratios of the model top horizontal acceleration (SATH1) to input
motion (GACH1), the top vertical acceleration (SAV=(SATLV+SATRV)/2) to input motion (GACH1).
A clear first peak is recognized near 4.0 Hz at CASE 4 of the small input. As input motion is bigger, the frequency of the first peak and the amplitude ratio is lower, the vertical amplitude ratio is recognized getting bigger as the intensity of the input from 0 to 12 Hz. Because the frequency of the vertical first peak is about two times the frequency of the horizontal first peak at CASE 2, CASE 3 with the low ground contact ratio, it is thought to be influenced by the uplift of the basemat.
(a) Horizontal (b) Vertical
Figure 6 Fourier Spectral Ratios of Model Top to Input Motion
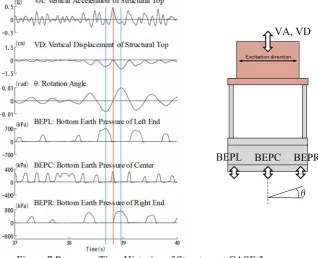
(2) Bottom Earth-pressure and Ground Contact Ratio
Figure 7 is the time histories of the vertical acceleration of the structure, the vertical displacement of the structure, rotation angle of the foundation, bottom earth-pressure at the center, and right and left ends during 37 seconds to 40 seconds at the CASE 3 input motion. In the Figure, the red line means the time step when the bottom earth-pressure at the center is large, and the blue line means the time step when the bottom earth-pressure at either the right or left end is large. When the bottom earth-pressure at the center grows large, the rotation angle of the foundation becomes 0 and the vertical acceleration of the structure
0 5 10 15 20 25 30 35 40
0.00 0.25 0.50 0.75 1.00
0.0001 0.001 0.01 0.1 1 10
Da
m
pi
ng
c
on
st
an
t
(%
)
G/
G0
Shear Strain (%)
G/G0(49kPa) G/G0(98kPa) G/G0(196kPa) h(%)(49kPa) h(%)(98kPa) h(%)(196kPa)
0 5 10 15 20 25
0 2 4 6 8 10 12
Ss2_40 Ss2_200 Ss2_310
Am
p
li
tu
d
e
Ra
t
i
o
Frequency(Hz)
0 2 4 6 8 10 12
0 2 4 6 8 10 12
Ss2_40 Ss2_200 Ss2_310
A
m
pl
itud
e
R
at
io
Frequency(Hz)
CASE 4 CASE 2 CASE 3
CASE 4 CASE 2 CASE 3
SATH1
SATLV SATRV
becomes the peak. When the bottom earth-pressure at either the right or left end grows large, the rotation angle and the vertical displacement becomes the peak.
Figure 7 Response Time Histories of Structure at CASE 3
(3) Relationships between Overturning Moment and Rotation Angle of Foundation
Figure 8 shows the relationships between the overturning moment and rotation angle of the foundation. In the figure, the red line means the critical moment for the rotational uplift. The almost linear behavior at CASE 1 is where the rotation angle of the foundation is small. And it shows nonlinearity behavior at CASE 2, and CASE 3 when the rotation angle of the foundation grows large. The overturning moment becomes the upper limit state, the relationship is with the S-type hysteresis.
(a) CASE 1 (b) CASE 2 (c) CASE 3
Figure 8 Relationships between Overturning Moment and Rotation angle of Foundation
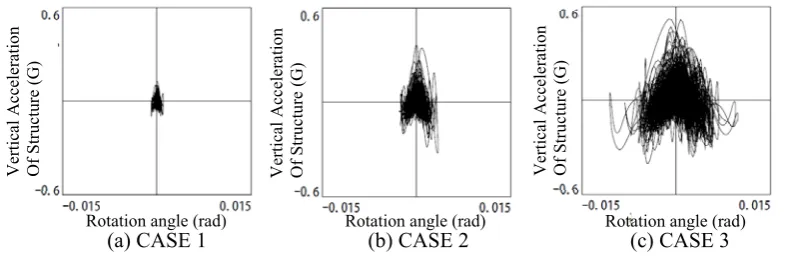
(4) Relationships between Vertical Acceleration of Structure and Rotation Angle of Foundation
Figure 9 is the relationships between the vertical acceleration of the model top and the rotation angle of the foundation. The plus side means the upward acceleration. For all cases, the maximum vertical acceleration of the structure occurs, when the rotation angle is approximately 0. It is thought that it occurs from a shock at re-grounding after the basemat uplift.
Rotation angle (rad) Rotation angle (rad) Rotation angle (rad)
Overturning Mo
m
ent
(kN
・
m)
O
ver
turning
M
om
ent
(kN
・
m)
Overturning Mo
m
ent
(kN
・
m
)
Excitation direction VA, VD
BEPL BEPC BEPR
θ
(a) CASE 1 (b) CASE 2 (c) CASE 3
Figure 9 Relationships between Vertical Acceleration of Model Top and Rotation Angle of Foundation
(5) Distributions of Bottom Earth-Pressure
Figure 10 shows the distributions of bottom earth-pressure at the maximum and the minimum rotation angle at CASE 3. For excitation direction, the distribution of the bottom earth-pressure at the end is large, and it was confirmed that two points in the center line contact the ground at the maximum rotation angle, while three points contact the ground at the minimum rotation angle.
(a) Maximum Rotation angle (t = 38.965 s) (b) Minimum Rotation angle (t = 86.260 s)
Figure 10 Distributions of Bottom Earth-Pressure (CASE3)
3. Simulation Analysis for the Results of Shaking Table Test under Centrifuge Gravity
For the result of the shaking table test, the simulation analysis is carried out by using three kinds of analysis models.
3.1 Analysis Cases
The analysis cases are following three cases.
CASE 1) Input 0.11 G: the ground contact ratio is about 60%, almost linear behavior CASE 2) Input 0.20 G: the ground contact ratio is about 40%
CASE 3) Input 0.32 G: the ground contact ratio is about 20%
3.2 Analysis Model
The soil-structure interaction models are the 3D-FEM, the lattice model and the enhanced lattice model. The 3D-FEM of the soil is made by the gap spring between the soil and the basemat. The lattice model is the lumped mass beam model type, and soil-structure interaction is considered by the spring of the rotational – vertical interaction for basemat uplift. The enhanced lattice model is used soil stiffness matrix considering interaction between all foundation nodes to be able to express both the rotational soil-spring and the vertical soil-spring under the foundation, and is used as the gap elements together for considering exfoliation between the bottom of the foundation and the ground. Figure 11 shows the setting flow of the soil-spring stiffness and the damping coefficient. The stiffness of the soil-spring used has the static value
Rotation angle (rad) Rotation angle (rad)
Rotation angle (rad)
V
er
ti
cal
A
cc
el
er
at
io
n
O
f Structu
re (G
)
Ver
tic
al A
cc
el
er
at
io
n
O
f Str
uct
ure (G
)
Verti
cal A
cce
ler
ation
O
f S
tructur
e (G
)
Earth-Pressure (kPa)
Earth-Pressure (kPa) 37-43
Excitation direction
29-36
16-28
8-15
1-7
7-43
6-42
5-41
4-40
3-39
2-38
at 0 Hz, and the damping coefficient is the value divided the imaginary part of the impedance by the first
natural angular frequency (ω 2πf ).
Figure 12 shows all analysis Models. At the 3D-FEM of the soil, based on evaluation for the experimental results of the top horizontal behavior, soil stiffness in the yellow area in the figure is reduced as the softened area. The rotational soil-spring of the lattice model reflected the effect of softened soil properties. Table 1 shows the soil properties used in the analysis: Figure 13 shows the rotational soil-spring comparisons between the 3D-FEM of the soil and the lattice model. Though at CASE 1 and CASE 2, rotational stiffness in the 3D-FEM and the lattice model is almost similar, at CASE 3 the rotational soil-spring stiffness of the lattice model is larger by 20% than the rotational soil-soil-spring of the 3D-FEM.
Figure 11 Setting Flow of the Soil-Spring
(a) CASE 1 (b) CASE 2 (c) CASE 3
(a) 3D-FEM of Soil Model
(b) Lattice model (c) Enhanced lattice model
Figure 12 Analysis Models for simulation analysis
START
Setting of the soil properties considered horizontal fourier spectral ratios of model top and bottom to input
motion
Calculation of soil-spring stiffness Calculation the 1st natural
frequency
Calculation of soil-spring damping coefficient
Incorporation into the lattice model
END
Horizontal Model Vertical Model
Horizontal Model
Vertical Model
Gap elements
Multiple springs symmetric
5,
00
0
Table 1 Soil properties for simulation analysis
(a) CASE 1 (b) CASE 2 (c) CASE 3
Figure 13 Rotational Soil-Spring Stiffness Comparisons for Each Case
3.3 Result of Simulation Analyses
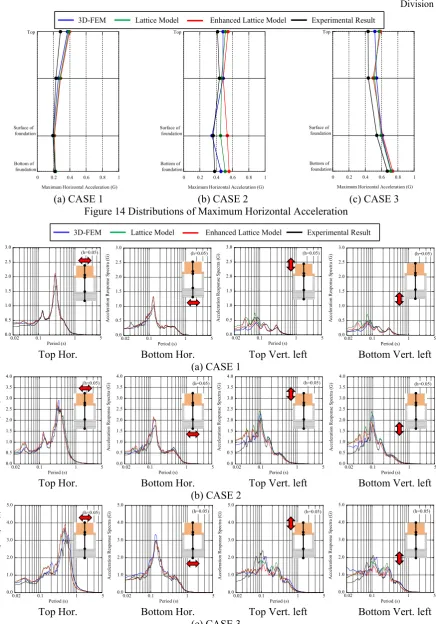
As the simulation analyses result, Figure 14 is the comparisons of the horizontal acceleration distribution, Figure 15 is the comparisons of the response acceleration spectra at each position, Table 2 is the comparisons of the ground contact ratio, and Figure 16 is the relationships between the overturning moment and the rotation angle of the foundation.
About the comparison of the horizontal acceleration distribution, all analysis models closely represent the experimental results at all cases. About the horizontal response acceleration spectra, all analysis models closely represent the seismic characteristics of the experimental results at all cases. But at CASE 3, the period of the horizontal response acceleration spectrum peak by the lattice model of top, and the enhanced lattice model is a slightly lower than 3D-FEM.
About the vertical response acceleration spectra, at CASE 1 and CASE 2, the result of 3D-FEM closely represents the experimental results. The analysis results by the lattice model and the enhanced lattice model are relatively large, but seismic characteristics closely represent the experimental results. At the peak period of CASE 3, around 0.1 seconds, all analysis models represent the amplification of the response acceleration spectrum, but the analysis results of the structure are relatively small. The analysis results of the structure bottom are also relatively small. So, for setting the soil properties and the softened area, it is necessary to evaluate not only the horizontal behavior but also the vertical behavior.
About the ground contact ratios of all analysis results and the experimental results at CASE 2, there are some differences, but the analysis results closely represent the experimental results, and the ground contact ratio is conservatively evaluated to be slightly small than the experimental results.
About the relationship between the overturning moment and the rotation angle of the foundation, at CASE 1 and CASE 2, all analysis models closely represent the experimental results. At CASE 3, the 3D-FEM is similar to the experimental result, but the rotational stiffness of the lattice model is slightly high.
CASE Element E
(×105 kN/m2)
poisson ratio
G
(×104 kN/m2)
γ
(kN/m3)
Vs (m/s)
Original Property area 1.502 5.365 175
Softened area 1.127 4.024 152
Equivalent value 1.311 4.681 163
Original Property area 1.418 5.063 170
Softened area 0.709 2.531 120
Equivalent value 0.964 3.443 140
Original Property area 1.178 4.209 155
Softened area 0.236 0.842 25
Equivalent value 0.491 1.752 100
1
0.4 17.18
2
3
0.0 0.5 1.0 1.5
0 2 4 6 8 10
3D-FEM (REAL) Lattice Model (REAL)
R
ota
ti
on
al S
oil-Sp
ri
ng
(
1
0
6 kN
m/
rad)
Frequency (Hz)
0.0 0.5 1.0 1.5
0 2 4 6 8 10
3D-FEM (REAL) Lattice Model (REAL)
R
ot
at
iona
l S
oi
l-Sp
ri
ng
(
10
6 kN
m
/r
ad
)
Frequency (Hz)
0.0 0.5 1.0 1.5
0 2 4 6 8 10
3D-FEM (REAL) Lattice Model (REAL)
Ro
ta
ti
on
al So
il
-Sp
rin
g
( 10
6 kN m/
rad)
(a) CASE 1 (b) CASE 2 (c) CASE 3 Figure 14 Distributions of Maximum Horizontal Acceleration
Top Hor. Bottom Hor. Top Vert. left Bottom Vert. left
(a) CASE 1
Top Hor. Bottom Hor. Top Vert. left Bottom Vert. left
(b) CASE 2
Top Hor. Bottom Hor. Top Vert. left Bottom Vert. left
(c) CASE 3
Figure 15 Comparisons of Acceleration Response Spectra
0 0.2 0.4 0.6 0.8 1 Maximum Horizontal Acceleration (G) Surface of
foundation Top
Bottom of foundation
0 0.2 0.4 0.6 0.8 1 Maximum Horizontal Acceleration (G) Surface of
foundation Top
Bottom of foundation
0 0.2 0.4 0.6 0.8 1 Maximum Horizontal Acceleration (G) Surface of foundation Top Bottom of foundation 0.0 0.5 1.0 1.5 2.0 2.5 3.0 0.1 1 0.02 5 A cc ele ra ti on R es po nse S pe ctr a (G) Period (s) (h=0.05) 0.0 0.5 1.0 1.5 2.0 2.5 3.0 0.1 1 0.02 5 A cc el er at io n Res po ns e Sp ect ra (G ) Period (s) (h=0.05) 0.0 0.5 1.0 1.5 2.0 2.5 3.0 0.1 1 0.02 5 A cc ele ra tion R es pon se S pe ct ra ( G ) Period (s) (h=0.05) 0.0 0.5 1.0 1.5 2.0 2.5 3.0 0.1 1 0.02 5 Ac ce le ra tion R esp on se S pe ct ra ( G ) Period (s) (h=0.05) 0.0 0.5 1.0 1.5 2.0 2.5 3.0 3.5 4.0 0.1 1 0.02 5 A ccel erat io n R es po ns e Sp ec tr a (G ) Period (s) (h=0.05) 0.0 0.5 1.0 1.5 2.0 2.5 3.0 3.5 4.0 0.1 1 0.02 5 A cc el er at io n R es po ns e Sp ec tra (G ) Period (s) (h=0.05) 0.0 0.5 1.0 1.5 2.0 2.5 3.0 3.5 4.0 0.1 1 0.02 5 A cc ele ra ti on R es pon se S pe ct ra ( G ) Period (s) (h=0.05) 0.0 0.5 1.0 1.5 2.0 2.5 3.0 3.5 4.0 0.1 1 0.02 5 A cc el er at io n Res po ns e Sp ect ra (G ) Period (s) (h=0.05) 0.0 1.0 2.0 3.0 4.0 5.0 0.1 1 0.02 5 A cce ler at io n R es po ns e S pe ct ra (G ) Period (s) (h=0.05) 0.0 1.0 2.0 3.0 4.0 5.0 0.1 1 0.02 5 A cce ler at io n R es po ns e S pe ct ra (G ) Period (s) (h=0.05) 0.0 1.0 2.0 3.0 4.0 5.0 0.1 1 0.02 5 A cce ler at io n R es po ns e S pe ct ra (G ) Period (s) (h=0.05) 0.0 1.0 2.0 3.0 4.0 5.0 0.1 1 0.02 5 A cc el er at io n Res po ns e Sp ect ra ( G ) Period (s) (h=0.05)
Table 2 Comparisons of Contact Ratio
CASE 1
CASE 2
CASE 3
Figure 16 Relationships between Overturning Moment and Rotation Angle
4.Conclusion
The result of the shaking table test under centrifuge gravity for investigating the structural dynamic behavior and the simulation analyses by using the 3D-FEM of the soil, the lattice model, and the enhanced lattice model can be summarized as follows:
1) The shaking table test under centrifuge gravity under huge input motion is carried out, the rotational uplift behavior under the low contact ratio of around 20 % is confirmed. It is identified that the maximum vertical acceleration of the structure occurs at the rotation angle 0, it occurs from a shock at re-grounding after the basemat uplift.
2) For the experimental result with the ground contact ratio, 20% to 60%, the simulation analyses by using three kinds of analysis models, 3D-FEM, the lattice model and the enhanced lattice model, are carried out. All analysis models used appropriate soil properties closely represent the experimental results for each case. But the vertical response acceleration spectra of the simulation analyses at both structural top and
CASE 1 CASE 2 CASE 3 3D-FEM 58.3 22.5 18.8 Lattice Model 56.2 25.3 20.0 Enhanced Lattice 57.5 27.5 22.5 Experimental Result 61.5 38.5 23.0 Analysis Model Ground Contact Ratio η(%)
-1500 -1000 -500 0 500 1000 1500
-0.0015 -0.001 -0.0005 0 0.0005 0.001 0.0015
O ve rtu rn in g M om ent (k N ・ m)
Rotation Angle (rad)
-1500 -1000 -500 0 500 1000 1500
-0.0015 -0.001 -0.0005 0 0.0005 0.001 0.0015
O ve rtu rn in g M ome nt ( k N ・ m)
Rotation Angle (rad)
-1500 -1000 -500 0 500 1000 1500
-0.0015 -0.001 -0.0005 0 0.0005 0.001 0.0015
O ve rtu rn in g M om ent (k N ・ m)
Rotation Angle (rad)
-2000 -1500 -1000 -500 0 500 1000 1500 2000
-0.004 -0.002 0 0.002 0.004 Rotation Angle (rad)
O ve rt ur ni ng M om ent ( kN ・ m) -2000 -1500 -1000 -500 0 500 1000 1500 2000
-0.004 -0.002 0 0.002 0.004 Rotation Angle (rad)
O ve rtur nin g M om ent (k N ・ m) -2000 -1500 -1000 -500 0 500 1000 1500 2000
-0.004 -0.002 0 0.002 0.004 Rotation Angle (rad)
O ve rtur ning M om ent (kN ・ m) -3000 -2000 -1000 0 1000 2000 3000
-0.015 -0.01 -0.005 0 0.005 0.01 0.015 Rotation Angle (rad)
Ov er tu rn in g M ome nt ( k N ・ m) -3000 -2000 -1000 0 1000 2000 3000
-0.015 -0.01 -0.005 0 0.005 0.01 0.015 Rotation Angle (rad)
O ve rtu rn in g M ome nt ( kN ・ m) -3000 -2000 -1000 0 1000 2000 3000
-0.015 -0.01 -0.005 0 0.005 0.01 0.015 Rotation Angle (rad)
O ve rtu rn in g M om ent (k N ・ m)
bottom are slightly smaller at the peak period of CASE 3, about 0.1 seconds, than the experimental result. So, in the future, we have investigated the appropriate ground condition.
3) It is identified that the enhanced lattice model using soil stiffness matrix and the gap element to express the rotation and the uplift of the basemat represents the dynamic behavior under the low contact ratio less than 50 %.
References
1) Y.Ookouchi et.al, Uplift behavior of non-embedded spread foundation structure during earthquake Part1:Outline of shaking table test under centrifuge gravity, Summaries of Technical Papers of Annual Meeting of AIJ 2017
2) Naohito Adachi et.al, Uplift behavior of non-embedded spread foundation structure during earthquake Part2: Case of no adhesion between foundation bottom and ground, Summaries of Technical Papers of Annual Meeting of AIJ 2017
3) Takahiko Hidekawa et.al, Uplift behavior of non-embedded spread foundation structure during earthquake Part3: Case of adhesion between spread foundation bottom and ground, Summaries of Technical Papers of Annual Meeting of AIJ 2017
4) Y.Ookouchi et.al, Uplift behavior of non-embedded spread foundation structure during earthquake Part4:Outline of simulation models, Summaries of Technical Papers of Annual Meeting of AIJ 2018 5) Mamoru Furue et.al, Uplift behavior of non-embedded spread foundation structure during earthquake