Copyright 0 1993 by the Genetics Society of America
The Effect of Deleterious Mutations
on
Neutral Molecular Variation
B. Charlesworth, M. T. Morgan and D. Charlesworth
Department of Ecology and Evolution, University of Chicago, Chicago, Illinois 60637-1573
Manuscript received November 23, 1992 Accepted for publication April 22, 1993
ABSTRACT
Selection against deleterious alleles maintained by mutation may cause a reduction in the amount of genetic variability at linked neutral sites. This is because a new neutral variant can only remain in a large population for a long period of time if it is maintained in gametes that are free of deleterious alleles, and hence are not destined for rapid elimination from the population by selection. Approximate formulas are derived for the reduction below classical neutral values resulting from such background selection against deleterious mutations, for the mean times to fixation and loss of new mutations, nucleotide site diversity, and number of segregating sites. These formulas apply to random-mating populations with no genetic recombination, and to populations reproducing exclusively asexually or by self-fertilization. For a given selection regime and mating system, the reduction is an exponential function of the total mutation rate to deleterious mutations for the section of the genome involved. Simulations show that the effect decreases rapidly with increasing recombination frequency or rate of outcrossing. The mean time to loss of new neutral mutations and the total number of segregating neutral sites are less sensitive to background selection than the other statistics, unless the population size is of the order of a hundred thousand or more. T h e stationary distribution of allele frequencies at the neutral sites is correspondingly skewed in favor of rare alleles, compared with the classical neutral result. Observed reductions in molecular variation in low recombination genomic regions of sufficiently large size, for instance in the centromere-proximal regions of Drosophila autosomes or in highly selfing plant populations, may be partly due to background selection against deleterious mutations.
T
HE neutral theory of molecular evolution pro- vides an important basis for interpreting data on DNA sequence variation, since nucleotide substi- tutions that leave protein sequences unchanged may be under little or no selection (KIMURA 1983). Neutral theory makes predictions about patterns of nucleotide site variation within populations that can be tested against DNA sequence data (EWENS 1979; KIMURA1983; GILLESPIE 199 1 ; KREITMAN 199 1). But the level of neutral variability can be reduced below classical neutral expectation by substitutions of alleles favored by natural selection at loci linked to the neutral sites (hitchhiking, MAYNARD SMITH and HAIGH 1974; THOMSON 1977; KAPLAN, HUDSON and LANGLEY 1989; STEPHAN, WIEHE and LENZ 1992; WIEHE and STEPHAN 1993). Reduced DNA variation in regions of restricted recombination in Drosophila has been interpreted as evidence for effects of hitchhiking ( A G U A D ~ , MIYASHITA and LANGLEY 1989a; STEPHAN and LANGLEY 1989; MIYASHITA 1990; BERRY, AJIOKA and KREITMAN 199 1 ; BEGUN and AQUADRO 1991,
1992; MART~N-CAMPOS et al. 1992; STEPHAN and MITCHELL 1992; LANGLEY et al. 1993), suggesting that selective substitutions may not be uncommon in the Drosophila genome (BERRY, AJIOKA and KREIT-
MAN 1991; BEGUN and AQUADRO 1992; CHARLES-
WORTH 1992; WIEHE and STEPHAN 1993). In this
Genetics 1 3 4 1289-1303 (August, 1993)
paper, we show that this conclusion may have to be partially modified, since reduced genetic diversity at neutral sites can be caused by another process, selec- tion against linked deleterious alleles maintained by mutation (“background selection”). We also show that genetic diversity is expected to be reduced in inbreed- ing populations, for similar reasons.
It was previously found that the presence of loci with selection against deleterious alleles retards the fixation of alleles at linked neutral loci present at intermediate frequencies in finite populations (OHTA
1971; SVED 1972). Allele frequencies close to zero or one were not studied, however, and there has been no investigation of the general effect on neutral vari- ability of selection acting on a genetic background of loci subject to recurrent mutation to deleterious al- leles. T h e effect we report here was discovered in the course of work on the behavior of modifier alleles changing the selfing rate of populations with muta- tions to detrimental alleles occurring at many linked loci (CHARLESWORTH, MORGAN and CHARLESWORTH 1992). T h e mean times to fixation and loss of new neutral alleles introduced at a low frequency were found by simulation to be smaller than predicted by the standard neutral formulae (KIMURA and OHTA
genotypes of different fitnesses (CHARLESWORTH, MORGAN and CHARLESWORTH 1992). An association with a rare high fitness genotype carrying few muta- tions will lead to rapid fixation of the neutral variant, whereas a variant in a background with low fitness will be rapidly eliminated. Such associations would be expected in highly inbreeding populations, and also in genomic regions with low frequencies of recombi- nation. Here we show, using a simple theoretical ar- gument and computer simulations, that this type of effect can cause an observable reduction in genetic diversity at neutral sites, assuming biologically plausi- ble values of the per genome mutation rate to dele- terious alleles and of the magnitude of selection against such mutations.
ANALYTICAL RESULTS FOR RANDOM-MATING POPULATIONS WITH NO RECOMBINATION
We shall consider two standard measures of genetic variation within a population, the nucleotide site di- versity, a, and the number of segregating sites per neutral locus, sn (NEI 1987; KREITMAN 1991). Since a
is the probability that a pair of randomly chosen chromosomes differ at a given nucleotide site, it is far more influenced by high frequency neutral variants than is s,, which includes unweighted contributions from all frequency classes. We might therefore expect the two measures of variability to be affected differ- ently by selection against linked deleterious alleles ($
TAJIMA 1989a).
When there is no recombination, the magnitude of the effect on the time to fixation and a for a large (but finite) diploid, random-mating population can be roughly predicted as follows. Studies of viability mu- tations in Drosophila populations suggest that selec- tion against the heterozygous effects of deleterious mutations is such that a typical deleterious mutation can persist only for about 50 generations before elim- ination by selection, even in an infinitely large popu- lation (CROW and SIMMONS 1983). In a finite popula- tion, the mean time to loss of such a mutation is much shorter than this, less than 10 generations even for a population of a million individuals (KIMURA and OHTA
1969b). In the absence of recombination, a new neu- tral variant arising in a gamete with one or more deleterious mutations will remain associated with those mutations, and hence will be rapidly eliminated from the population. If selection against the deleteri-
ous mutations is not very weak, the least-loaded ga- mete class and its descendants will quickly become predominant in the population, due to their higher than average fitness. Neutral mutations can only spread to high frequencies in the entire population if they are transmitted through gametes that remain free of deleterious alleles.
As far as variants that are spreading to fixation are
concerned, their drift to fixation in the least-loaded class is therefore the most important process deter- mining the time taken, and the effective population size for this process in a large population should thus be approximated by
fae,
wherefo is the equilibrium frequency of mutation-free gametes in an infinite population and Ne is the effective population size. The mean conditional time to fixation is then4foN,,
instead of the classical neutral value of 4Ne (KIMURA andOHTA 1969a).
T h e following argument shows that x should be reduced by a similar factor to that for the time to fixation. Under the infinite-sites model of neutral molecular variation (KIMURA 1969, 19'7 l), we have
a = 2NvH ( 1 )
where N is the number of breeding adults, v is the neutral mutation rate per nucleotide site, and H is the expected value of the sum of the diversity contributed by a mutation at a nucleotide site over all generations before loss or fixation of the mutation. H is given by
H = 2E
L
Xt(1-
X,)I.
I
(2)
where X, is the frequency at generation t of a neutral
variant introduced as a single mutation at a given site. Under the classical neutral model with no selection at background loci, H = 2Ne/N, so that a = 4N,v (KIMURA
1969, 197 1).
T h e contribution to H from a variant that persists in the population for a long enough time to have a large influence on its value will be reduced by a factor off0 below the classical neutral value, since the above argument shows that the effective population size for variants that are not rapidly lost from the population
due to their association with deleterious alleles is
faeC.
Hence, with background selection we havea
=
4folv,v. (3)This argument breaks down if the deleterious alleles are very weakly selected against in the heterozygous state, so that
Nebs
<
1 (KIMURA 1983, p. 44), since this means that they behave as effectively neutral, and hence will not influence the fate of a neutral mutation. Other circumstances in which this result breaks down are described in the RESULTS section below. A modi- fication of Equation 3, which gives more accurate results for the case of small U and small Ne, is derived in the APPENDIX (Equation 6).Deleterious Mutations and Variation 1291
3 follows from the fact that t is equal to 2v times the
mean coalescence time (HUDSON 1990). RICHARD
HUDSON (personal communication) has derived a
more exact formula, which takes into account the contribution to the coalescent time from the periods when members of a pair of sampled genes were carried in mutation-carrying chromosomes.
Neutral variants which are destined for loss will be eliminated from the population at a rate which is little influenced by the number of deleterious alleles with which they are associated, since random loss of a neutral variant can occur in all classes of gametes, and both stochastic and deterministic elimination take place rapidly unless population size is very large (KI- MURA and OHTA 1969b; CROW and SIMMONS 1983). For sh = 0 . 0 2 , we do not expect the mean conditional time to loss of a neutral variant to be much affected by background selection, in contrast to the mean time to fixation, until the population size exceeds several hundred thousand, when selection becomes so effec- tive compared with drift that deleterious alleles are eliminated much faster than neutral alleles (KIMURA and OHTA 1969b). Therefore sn will not be so strongly affected by background selection as r, since it contains a large contribution from variants that are lost rapidly from the population as well as from those that rise to high frequency. This argument also suggests that the frequency distribution of alleles at segregating sites will be skewed in favor of rare alleles, compared with the classical neutral expectation. As the population size becomes very large, this effect should disappear. Formulas for s, and the mean time to loss for the case of small U are given in the APPENDIX.
These results are independent of the mode of selec- tion against the deleterious alleles. Determination of
fo
in a given case requires the selection model to be specified. For simplicity, we shall assume equal effects on fitness of each locus and multiplicative fitness in- teractions between loci. In an infinitely large popula- tion with mutation-selection balance at many autoso- mal loci, the number of deleterious mutations per gamete at equilibrium follows a Poisson distribution with mean n = U/2hs (KIMURA and MARUYAMA 1966; CROW 1970), where U is the mutation rate per diploid genome, s is the selection coefficient against homozy- gous mutations, and h is the dominance coefficient. Hencef~
= exp(-
5).
If U/2hs is sufficiently large,
fo
<<
1, and background selection against deleterious mutations is expected to have a major effect on neutral variation in regions of reduced recombination.SIMULATION METHODS
T h e purpose of the simulations was to check the validity of the approximate results outlined above,
and to evaluate the magnitude of the effect of back- ground selection on the nucleotide site diversity and number of segregating sites per neutral locus, with different recombination frequencies and different rates of self-fertilization. We simulated repeated intro- ductions of neutral variants into a population subject to recurrent mutation to deleterious alleles at many loci linked to the neutral sites, in finite diploid popu- lations with discrete generations. T h e program was written in the C language for a Macintosh 11 computer with a Tektronix RP88 coprocessor.
In each generation, the sequence of events was mutation, reproduction and selection. T h e loci subject to selection were assumed to be either wild-type or mutant in state, and the neutral sites were assumed to have an initial allelic state and a mutated state. A genome contained 1024 selected loci, and 25 neutral sites at locations 5 0 0 - 5 2 4 , i e . , in the center of the set of selected loci. Haploid genotypes were stored as lists of mutant loci. T h e lists could undergo a recombina- tion process, in the manner outlined by FEUENSTEIN
and YOKOYAMA (1976). T h e loci were assumed to be
on a single chromosome, or on several chromosomes, and the recombination frequency between adjacent selected loci will be denoted by r. Note that, for comparison with published data on genetic diversity in the Drosophila melanogaster genome (BEGUN and
AQUADRO 1992), where the amounts of recombina-
tion are expressed in terms of coefficients of exchange (map distances between adjacent bands on the poly- tene chromosomes), division by 100 gives recombi- nation frequencies between adjacent loci in females, assuming at least one locus per polytene band. For autosomal loci, the population recombination fre- quencies should be multiplied by a factor of one-half, since Drosophila males lack recombination; for sex- linked loci, a factor of two-thirds should be used
(BEGUN and AQUADRO 1992).
Mutation at the loci under selection assumed a Poisson distribution of numbers of new mutations, with a mutation rate U for the whole diploid genome. In the mating process, gametes recombinant for both the selected loci and neutral sites were generated from each of two randomly chosen parental genotypes, if the population was random-mating. If self-fertilization was permitted, a fraction
S
of zygotes was formed by two gametes chosen from the same parent, and aleles is (1
-
hs)’( 1-
s ) j (CROW 1970). For most of our simulations, we chose values of h and s that seem justified in the light of the Drosophila data on the fitness effects of detrimental mutations of minor ef- fect, h = 0.2 and s = 0.1. This choice gives hs = 0.02, consistent with an estimated infinite population per- sistence time (1 / h s ) of 50 generations for a deleterious allele (CROW and SIMMONS 1983). T h e process of zygote production was repeated until a population of N new surviving zygotes was formed. Runs were started with all individuals wild-type at the selected loci.T o obtain the necessary statistics for describing the pattern of neutral variation, we have used the follow- ing procedure, which is appropriate for the infinite- sites model of molecular evolution (KIMURA 1969, 197 1, 1983). By the principle of ergodicity, the mean time that an allele drifting to loss or fixation spends
In a defined interval of allele frequency is proportional
to the frequency with which independently intro- duced alleles at different sites are found in that inter- val, conditional on segregation at the sites in question (EWENS 1979, pp. 238-239). This enables results to be obtained in a very economical fashion, since we do not need to model the mutation process at the neutral sites, but merely to follow the fate of neutral variants introduced repeatedly into the population, until each is fixed or lost. T h e distribution of allele frequencies at segregating sites is then obtained from the average over many trials of the times spent in defined fre- quency intervals. From Equation 2, H i s obtained from the mean diversity per site, 2x41
-
x J , summed over the generations during the variants’ passage to loss or fixation. From Equation 1, a is proportional to H. Similarly, s, is proportional to T , the mean time to fixation or loss of a neutral variant (EWENS 1979, p. 238). T h e effect of background selection on sn can thus be deduced from its effect on T . Note that this use of ergodicity is independent of any assumptions about selection or neutrality at the sites in question.After an initial period of 2000 generations with mutation at the selected loci, to allow the population to reach a quasi-equilibrium state under mutation and selection, variation was introduced at all the neutral sites at a frequency of 1/2N at each site, 25 gametes being selected at random (with replacement) for the introduction of a variant at each of the 25 neutral sites. From that point onwards, the frequency of mu- tant alleles at each of the neutral sites was examined, and the genetic diversity 2x4 1
-
xt) was calculated for each site at each generation, until all neutral variants were either lost or fixed. Conditional mean times to fixation and loss of the neutral variants were calcu- lated, as well as the mean time to fixation or loss, and the distribution of times spent by segregating neutralsites in different gene frequency intervals was ob- tained.
With this method, the mutation rate to neutral alleles is not a parameter in the simulations, so we cannot give predicted absolute values of ?r and s,. This is not necessary, however, as we are concerned solely with the values in the presence of a background of deleterious mutations, relative to those expected on the pure neutral theory. T h e method we employed introduces all neutral variants at a single group of linked sites. This does not affect the means from which we extract the relative a and s, values, though it would bias estimates of correlations between variants at dif- ferent neutral sites.
SIMULATION RESULTS
The effect of restricted recombination in random-
mating populations: With no recombination, and
with moderately strong selection acting on the se- lected loci, the H values and mean conditional fixation times derived from the simulations were remarkably close to the approximate theoretical values. These were calculated from the theory outlined above, re- placing Ne in the standard formulae for H and fixation time (KIMURA 1969; KIMURA and OHTA 1969a) by foNe. For U = 0.01, and sh = 0.02, the value off0 is 0.78; for U = 0.1 it is 0.08. T h e effects of background selection on genetic variability at the neutral sites from the simulations are expressed in terms of the values of T and s, relative to their neutral expectations, calculated as described above.
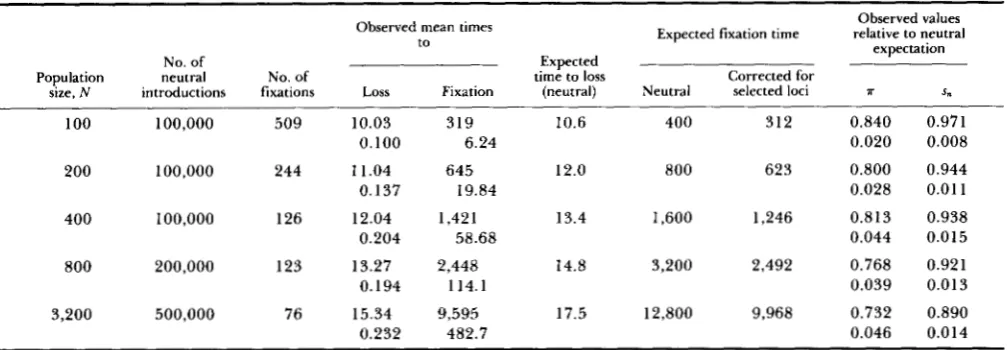
Table 1 shows simulation results for complete link- age and random mating for a range of population sizes, with U = 0.01, s = 0.1 and h = 0.2. For each parameter set, 100,000 or more neutral variants were introduced and followed, the number being chosen such that at least 50-60 fixations of neutral variants occurred, so that a reliable estimate could be obtained of the contribution from introductions that resulted in fixation. T h e effects of background selection on T
tended to be greater for large population size, but leveled off for N I 3,200, with little change above N
= 1,600 (results not shown). For these larger popula- tions, there is no significant disagreement between the theoretical and simulated results for a. A slight im- provement in fit between the simulation and theoret- ical results for the smaller population sizes is given by Equation 6 of the APPENDIX. This takes into account the fact that even chromosomes carrying deleterious alleles make a non-zero contribution to H, which was ignored when deriving Equation 3. AS might be ex- pected, this effect is most marked for small N , and causes the reduction in a to increase with N, although the large stochastic error somewhat obscures the pat- tern.
Deleterious Mutations and Variation 1293
TABLE 1
Effect of background selection on neutral variation in random-mating populations with no recombination
Observed mean times Expected fixation time relative to neutral Observed values expectation to
No. of Expected
Population neutral No. of time to loss
size, N introductions fixations Loss Fixation (neutral) Neutral selected loci A S"
Corrected for
100 100,000 509 10.03
200 100,000 244 11.04 0.100
0.137
400 100,000 126 12.04 0.204
800 200,000 123 13.27 0.194
3,200 500,000 76 15.34
0.232
319 6.24
645 19.84
1,421 58.68
2,448 114.1
9,595 482.7
10.6 400 312 0.840
0.020
12.0 800 623 0.800
0.028
13.4 1,600 1,246 0.8 13 0.044
14.8 3,200 2,492 0.768
0.039
17.5 12,800 9,968 0.732
0.046
0.97 1 0.008
0.944 0.01 1
0.938 0.0 15
0.921 0.01 3
0.890
0.0 14
The genetic background consisted of 1024 loci subject to deleterious mutation at rate 0.01 per diploid genome per generation. s = 0.1 and h = 0.2. Mean values of the quantities observed in the simulations are given, with standard errors below the means.
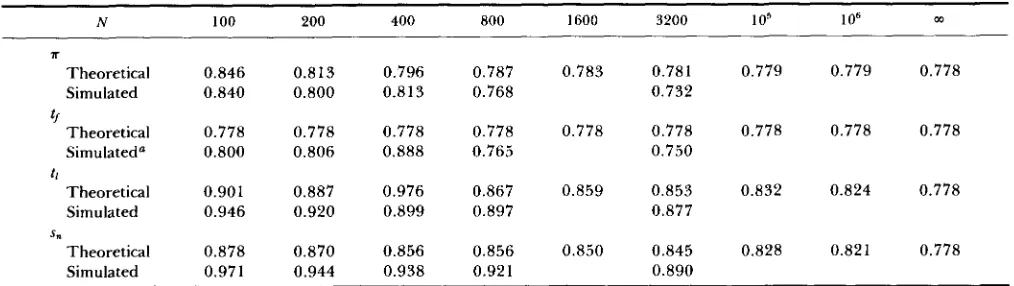
s, relative to the classical neutral values given in the APPENDIX (Equations 8 and 10) tend to overestimate the reductions due to background selection compared with the simulation results, although the agreement improves as N increases (see Table 6). This is probably due to the fact that the formula for time to loss of a deleterious allele used to obtain Equation
7
of the APPENDIX assumes 2Ndh>>
1, which is violated for the smaller population sizes (KIMURA and OHTA1969b). As expected from the theoretical analysis, the effect of background selection on s, and mean time to loss is much less than the effect on 7r and mean time to fixation, for the population sizes used in the simu- lations. T h e proportionate reduction in these statistics due to background selection increases with population size, as predicted by the analytical results.
T h e analytical approximation outlined above im- plicitly assumes that the effect of selection at back- ground loci can be described adequately by the total mutation rate, and does not require the number of loci to be specified explicitly. Runs were done with different numbers of loci subject to mutation, to test this assumption for both the high and low mutation rates studied. These runs assumed s = 0.1 and h =
0.2. For the case of U = 0.01 and zero recombination, we did runs with 100 loci, instead of 1,024, ie., with about the same mutation rate per locus as in the runs with U = 0.1 and 1,024 loci. T h e relative values of a
and s, were not significantly different from the values with the larger number of loci, for population sizes of 800, 1,600 or 3,200. We also did runs with 512 instead of 1,024 loci for the case of U = 0.1. For zero recombination, or with some recombination ( r = 1 0-5 or lo"), the relative values of a and s, were again not significantly different from the values with the larger number of loci, for populations of N = 3,200.
Table 2 shows the results of simulations with various mutation rates, selection coefficients, and dominance coefficients. These were intended to test the adequacy of the theoretical results for no recombination. T h e runs were done with a population size of 1,600. Good agreement with equation (3) was found with hs 2
0.02, the biologically plausible value (CROW and SIM-
MONS 1983), over a wide range of predicted magni- tudes of effects (see the top four lines of Table
2).
When hs was very small, however, there was no longer good agreement, but the observed values of the quan- tities of interest were much less affected by back- ground selection than predicted.
Accumulation of deleterious mutations by Muller's ratchet (FELSENSTEIN 1974; HAIGH 1978) in these rather small populations may contribute to this dis- crepancy. With s = 0.2, the expected number of mutations per gamete in an infinite population at equilibrium is 2.5 with h = 0.1, and 5 when h = 0.05, but the observed mean numbers after approximately 75,000 generations in runs with a population size of 1,600 were 3.8 and 7.1, respectively. With the im- plausibly low h value of 0.05, there was thus moderate accumulation of deleterious mutations, and very slight accumulation with h = 0.1. T h e observed relative a
TABLE 2
Effects of background selection with different selection parameters
Mutation rate
0.1 0.1 0.1 0.1 0.1 0.1
0.01
coefficient Selection
0.1 0.2 1
.o
0.2 0.2 1.o
0.01
Dominance coeffcient
0.2 0.2 0.2 0.1 0.05 0.04
0.2
No. of
runs
200,000 200,000 200,000 200,000 200,000 200,000
100,000
fixations No. of
68 62 74 72 72 61
61
Expected
17
0.08 0.29 0.78 0.08 0.007 0.28
0.08
Observed mean
S.
0.12 0.52 0.3 1 0.57 0.78 0.82 0.13 0.53
0.15 0.58 0.28 0.57
0.98 0.94
The genetic background consisted of 1024 loci subject to deleterious mutation. Mean values of the quantities observed in the simulations are given. All loci were completely linked. The population was random mating, with 1600 individuals.
cases (HAIGH 1978). With N = 1,600, the runs with weaker selection and lower mutation rate yielded re- sults similar to those expected on the purely neutral theory i.e., there was little effect of background selec- tion (see the last line of Table 2).
As discussed in the APPENDIX, the reason for the lack of effect of background selection in this case is the fact that, with large U / h s , a chromosome carrying a small number of deleterious mutations is at a selec- tive advantage relative to the population as a whole. If U is small and the population size is small, a new neutral mutation arising in such a chromosome may drift to a high frequency before the chromosome
accumulates sufficient deleterious mutations to be eliminated from the population. Neutral mutations arising in some of the chromosomes carrying delete- rious mutations can therefore contribute significantly to genetic diversity. This effect will tend to disappear as population size increases, since the time taken for an allele to reach a high frequency increases, and there is a greater chance that the chromosome in question will be eliminated before this happens. T o check this interpretation, the case of U = 0.01 and
hs = 0.002 was run with a population size of 6,400 instead of 1,600. T h e mean values over 500,000 runs of ?r and s, relative to neutral expectation were 0.18
f 0.02 and 0.67 f 0.01 respectively, so that both statistics were substantially reduced in value compared with neutral expectation. Genetic diversity is thus reduced by background selection even with weak se- lection against deleterious mutations, unless popula- tion size is very small.
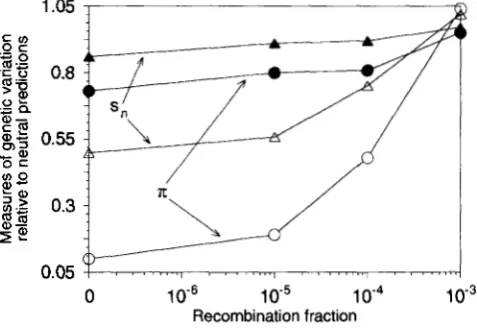
Figure 1 shows the effect of recombination on T
and s, for two different mutation rates, U = 0.01 and 0.1. T h e runs with U = 0.1 were done using large populations, to ensure that the population would come into a quasi-equilibrium state, i.e., that deleterious mutations would not accumulate at the selected loci by either Muller's ratchet or fixation (KIMURA, MA-
RUYAMA and CROW 1963). As expected, recombina- tion reduces the effect of selection at the background
1.05 1
$2
0 1
o-6
1o+
1o - ~
1 0 3Recombination fraction
FIGURE 1 .-Values of nucleotide site diversity (IT) and numbers of segregating sites per locus (sn), relative to their classical neutral expectations, for neutral variants in outcrossing populations on a genetic background with deleterious mutations, with various recom- bination fractions r between adjacent loci. The population size was
3,200, the selection coefficient on the mutations was 0.1, and the dominance coefficient was 0.2. Filled symbols: (i = 0.01; open symbols: (i = 0.1.
loci. N o reduction in variability below classical neutral expectation was detectable when adjacent loci recom- bined with a frequency of Other population sizes also gave effects on ?r and fixation times that
agreed with these results, though the reduction in s,, and to a lesser extent T , was greater with larger N .
Deleterious Mutations and Variation 1295
Rate of recombination, r
0
-
- -
IO.5
~ -
,o-4
---
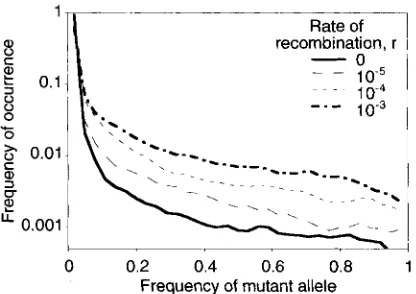
10-30 0.2 0.4 0.6 0.8 1 Frequency of mutant allele
FIGURE 2,"Frequency distributions of the neutral variants in the computer simulations of outcrossing populations with deleteri- ous mutations occurring at a rate of 0.1 per diploid genome per generation in the genetic background, for various recombination frequencies. These data were obtained from the simulation results on the numbers of times that alleles were observed in different frequency intervals (frequency intervals of 0.03 were used). The population size was 3,200, the selection coefficient was 0.1, and the dominance coefficient was 0.2.
section, this pattern is likely to become negligible when population size is very large.
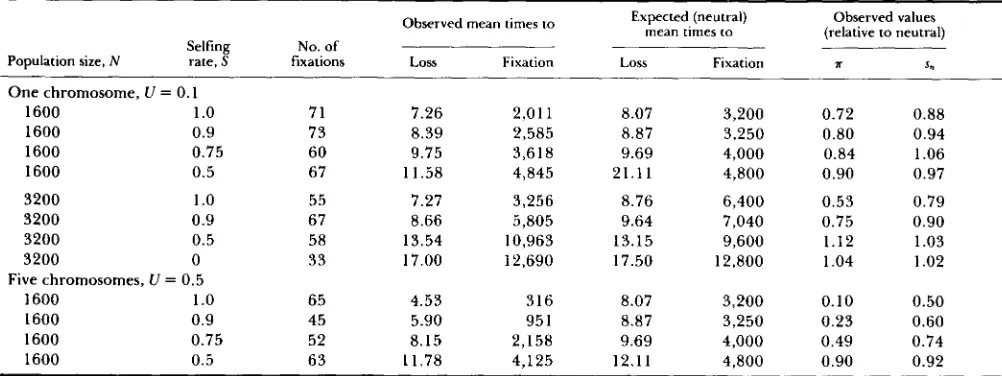
The effects of inbreeding: T h e effects of high levels
of self-fertilization are shown in Table 3 and Figure 3. T h e runs were done with a recombination fre- quency of lo-' between adjacent loci, a value that yielded no discernible effect of selection at back- ground loci in random-mating populations. T h e mu- tation rate was either 0.1 (with all loci assumed to be on a single chromosome) or 0.5 for the case when the loci were spread among five chromosomes. T h e stand- ard selection parameter values of h = 0.2 and s = 0.1 were used. For calculations of the classical neutral expectations, we used effective population sizes ad- justed to take account of the frequency of selfing, according to the formula Ne = N/(1
+
F ) , where F is the equilibrium inbreeding coefficient, S/(2-
S ) (POL- LAK 1987). With complete selfing, there is effectively no recombination. In this case, the expected back- ground selection factor for reducing Ne in the for- mulas for fixation time and T isfo = expf-U/2s), the frequency of mutant-free gametes in an infinitely large selfing population at equilibrium (CHARLES- WORTH, MORGAN and CHARLESWORTH 1991). With the selection and dominance coefficients used in these runs (s = 0.1, h = 0.2),f0 = 0.61 for the case of U = 0.1 (Figure 3 and upper part of Table 3) and for U =0.5 it is 0.08 (lower part of Table 3).
T h e expected reductions in fixation time and T
were found in runs with complete selfing. For lower selfing rates, there is no explicit formula, since there is a significant amount of recombination. For S 2 0.75, the genetic diversity measures were markedly lower than predicted by classical neutral theory (Fig- ure 3), especially in runs with a mutation rate of 0.5.
DISCUSSION
A recombination frequency of only lo-' in our simulations, corresponding to a map length of approx- imately 100 centimorgans with 1,000 loci per chro- mosome, is sufficient to remove any detectable effect of background selection against deleterious alleles in random-mating populations (Figure 1). This suggests that classical neutral theory should predict the pattern of silent nucleotide site variation in most regions of the genome, unless population changes or hitchhiking events have intervened to distort the picture. Devia- tions from neutral expectation in these regions in random-mating populations can thus be taken as evi- dence for such events. But when recombination or outbreeding is greatly restricted, the presence of loci subject to recurrent deleterious mutation can have significant effects on the behavior of neutral variants. T h e major question is whether or not the total mutation rate for deleterious alleles in regions of restricted recombination is ever large enough that effects of the magnitude found in population studies can be explained by this mechanism. In the next sections, we discuss the magnitudes to be expected. Before doing this, it should be mentioned that runs with very different numbers of loci subject to muta- tion establish that the results do not depend strongly on the number of loci, but are determined chiefly by the rate of mutation in genomic segments in which recombination is infrequent (see SIMULATION RESULTS section).
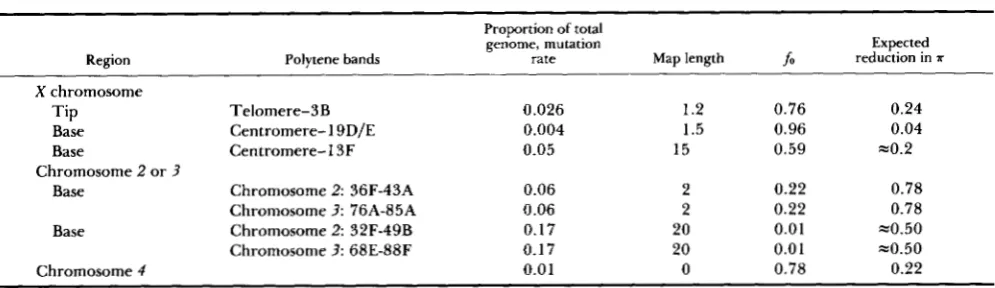
Restricted recombination in Drosophila: Table 4
gives estimates of the sizes, mutation rates, frequencies of mutation-free gametes (fo), and expected reduc- tions in genetic diversity, for several regions of the
D.
melanogaster genome with restricted recombination
(ASHBURNER 1989, Chap. 11). T h e estimates of the
regional sizes (expressed as the proportions of the total euchromatin represented by each region) were obtained from information on the relative sizes of the different chromosome arms (ASHBURNER 1989; CHARLESWORTH, LAPID and CANADA 1992), and from data on the proportion of DNA within each chromo- some arm represented by the regions in question (BOLSHAKOV, ZHARKIKH and ZHIMULEV 1985). T h e mutation rates were estimated by multiplying a total diploid per genome mutation rate of 1 (MUKAI et al. 1972; HOULE et al. 1992) by the sizes of each region. T h e map lengths were obtained from the standard genetic maps of LINDSLEY and ZIMM (1992), except for the smaller basal region of the X , whose length was estimated from the recombination frequency be- tween mal (located at 19D/E) and the centromere
(SCHALET and LEFEVRE 1976). For the X chromosome,
which is expressed in the hemizygous states in males,
TABLE 3
Effects of background selection on neutral variation in selfing and partially selfing populations
Selfing No. of Population size, N rate, S fixations One chromosome, LI = 0.1
1600 1
.o
711600 0.9 73
1600 0.75 60
1600 0.5 67
3200 1
.o
3200 0 .9 3200 0.53200 0
Five chromosomes, L' = 0.5 1600 1
.o
1600 0 .9
1600 0.75
1600 0.5
55 67 58 33
6 5 45 52 6 3
Observed mean times to Expected (neutral)
mean times to
Observed values (relative to neutral)
Loss Fixation Loss Fixation r S"
7.26 2,011 8.07 3,200 0.72 0.88 8.39 2,585 8.87 3,250 0.80 0.94 9.75 3,618 9.69 4,000 0.84 1.06 1 1.58 4,845 21.11 4,800 0.90 0.97
7.27 8.66 13.54 17.00
4.53 5.90 8.15 11.78
3,256 5,805 10,963 12,690
316 95 1 2,158 4.125
8.76 9.64 13.15 17.50
8.07 8.87 9.69 12.11
6,400 7,040 9,600 12,800
3,200 3,250 4,000 4.800
0.53 0.75 1.12 1.04
0.10
0.23 0.49 0.90
0.79 0.90 1.03 1.02
0.50
0.60
0.74 0.92
The genetic background consisted of 1000 loci subject to deleterious mutation. s = 0.1 and h = 0.2. The recombination fraction between adjacent loci was lo-'. The number of simulations for each parameter set was 200,000, except for the case of no selfing, for which 500,000
0 0.2 0.4 0.6 0.8 1.0
Selfing rate
FIGURE 3.-Nucleotide site diversity values (T) and numbers of
segregating sites per locus (s,), relative to their classical neutral expectations (taking into account the effect of the relevant levels of
selfing on the effective population size), for neutral variants on a genetic background with deleterious mutations in inbreeding pop- ulations of 3,200 individuals with various selfing rates, S . The error bars are the standard errors of the mean values of the statistics. The selection coefficient against the deleterious mutations was 0.1, the dominance coefficient was 0.2, and the mutation rate was 0.1.
the autosomes, Equation 4 was used. T h e standard values of the selection parameters, s = 0.1 and h = 0.2, were used in the calculations.
T h e estimated reductions in a for the different genomic regions were calculated using the following method. For the X chromosome, a population r value of 1 0-5 between adjacent loci in our simulations would correspond to a region approximately 1,024 X 100 X X 3/2 = 1.5 centimorgans in length. Defining the tip of the X as the region distal to and including
3 B (1.2 centimorgans), it is thus reasonable to assume that .rr for this region should correspond to that for
an average r of slightly less than Since the simulations suggest that an r value of is almost indistinguishable from zero, this would correspond to a reduction in a of 1
-
fo
= 0.24. T h e expected reductions in a for the smaller basal regions of the X ,larger autosomes, and the fourth chromosome (which has no crossing over [ASHBURNER 1989]), were ob- tained in a similar way. T h e results for the larger basal regions are less certain, as indicated in the table. For the X chromosome, an r value of in our simula- tions would correspond to the set of genes within 15 centimorgans of the centromere ( i e . , to genes located proximal to 13F), for which we estimatefo = 0.59. Figure 1 shows that a change from r = 0 to r =
roughly halves the expected reduction in a, suggesting that the reduction in diversity for genes located in this region might be approximately 20%. The esti- mate for the larger basal regions of the major auto- somes was obtained by a similar procedure. These estimates should be regarded as only approximate, as the simulations assumed a central location of the neu- tral sites, and loci in the more distal parts of these regions might show weaker effects.
These expectations can be compared with data on molecular variation in natural populations. For the tip of the X chromosome, background selection against deleterious alleles is clearly inadequate as a full expla- nation of reduced variability. In some populations of
D. melanogaster and in Drosophila simulans, variation in the yellow-achaete-scute locus at the extreme tip of the X chromosome is significantly reduced ( A G U A D ~ ,
MIYASHITA and LANGLEY 1989a; BEGUN and
AQUADRO 1991; MART~N-CAMPOS et al. 1992), al-
Deleterious Mutations and Variation 1297
TABLE 4
Expected reductions in genetic diversity in regions of the D. melanogaster genome
Proportion of total genome, mutation
Region Polytene bands rate Map length
P
reduction in TExpected
X chromosome
Tip Telomere-3B 0.026 1.2 0.76 0.24
Base Centromere-1 9D/E 0.004 1.5 0.96 0.04
Base Centromere-13F 0.05 15 0.59 =0.2
Base Chromosome 2: 36F-43A 0.06 2 0.22 0.78 Chromosome 3: 76A-85A 0.06 2 0.22 0.78
Base Chromosome 2: 32F-49B 0.17 20 0.01 -0.50 Chromosome 3: 68E-88F 0.17 20 0.01 ~ 0 . 5 0
Chromosome 4 0.0 1 0 0.78 0.22 Chromosome 2 or 3
populations of D . melanogaster (BEECH and LEIGH-
BROWN 1989; EANES, LABATE and AJIOKA 1989;
MART~N-CAMPOS et al. 1992). From Table 4, it is
apparent that our model cannot account for the dras- tic reduction in variability sometimes observed for y- ac-sc, but it is consistent with evidence for the smaller apparent reduction in variability in other populations and at other loci in this region ( A G U A D ~ , MIYASHITA
and LANGLEY 1989b; BEGUN and AQUADRO 199 1).
Similarly, the total lack of variability at su-f (20F)
(LANGLEY et al. 1993) and in the@ locus of Drosophila
ananassae (STEPHAN and MITCHELL 1992), both lo- cated at the base of the X , and for the one locus on the fourth-chromosome locus that has been se- quenced, ciD (BERRY, AJIOKA and KREITMAN 1991), cannot be accounted for by our model. T h e somewhat low ?r for Zw in D . melanogaster (located at 18E, in the
larger basal region of the X ) noted by MIYASHITA
(1 990) might be due to background selection. Table 4 shows that large reductions in variation are expected for genes in the smaller basal regions of the major autosomes, and a reduction of about 50% might be expected for the larger basal regions. Few data on these regions are available as yet, but a survey of nucleotide-site variability at cta (40F) shows reduced variability in D . melanogaster (MARTA WAYNE, per- sonal communication).
Effects of asexuality or partial self-fertilization:
Effects of the kind discussed above should also be seen in highly selfing or asexual species, where recombi- nation is effectively absent. (In the latter case, the reduction factor for diversity is the equilibrium fre- quency of mutant-free clones, equal to exp (-U/hs) for a diploid.) In both cases, the mutation rate for the entire diploid genome is appropriate for predicting the effects of background selection, so a U value of about 1 can be assumed for higher organisms (KON-
and MORGAN 1990; HOULE et al. 1992). Our studies
of selfing populations assumed a single chromosome DRASHOV 1988; CHARLESWORTH, CHARLESWORTH
and a mutation rate of 0.1, which is probably reason- able for one chromosome, or five chromosomes each with this mutation rate.
When the selfing rate exceeded about 75%, we found strongly reduced diversity values for neutral variants, even with a mixture of self-fertilization and random mating. It is well known that partial selfing is correlated with lower allozyme variability within pop- ulations, and the best data indicate reductions in ge- netic diversity for allozyme loci of about 50% in selfing plant populations compared with obligate outcrossers
(HAMRICK and GODT 1990; SCHOEN and BROWN
1991), the reduction expected just from the halving of the effective population size under complete selfing
(POLLAK 1987). Selfing species of slugs also show
reduced allozyme diversity (MCCRACKEN and SELAN- DER 1980; FOLTZ et al. 1982). However, the breeding systems were not quantified in most of the studies, so the magnitude of the predicted reduction from this cause is not certain.
Larger differences have sometimes been found. Self-fertilizing Mimulus micranthus populations (esti- mated to be about 80% selfing) had only about one quarter of the allozyme diversity compared with the mainly outcrossing Mimulus guttatus, and diversity for chloroplast sequences in selfing populations was re- duced to a similar extent (FENSTER and RITLAND
1992). In completely selfing species, organelle ge- nomes will behave as though linked to the nuclear genome, so that background selection acting on the nuclear genome could cause reduced variation in or- ganelle genomes. T h e effect of the rate of selfing on the level of neutral variability in organelle genomes has not yet been studied, however.
fore by very interesting to compare sequence diversity for synonymous and nonsynonymous changes, in sel- fers and outcrossers. There is currently little infor- mation on DNA variation, but a survey of RFLP variation in related species of tomatoes suggested a pattern similar to, but apparently more extreme than, that for allozymes (MILLER and TANKSLEY 1990). Similarly, asexual species are notoriously depauperate in genetic variability, though the interpretation of the data is complicated by recent origin and by hybridi- zation in these cases, and there are few data on diver- sity within evolutionarily old clonal lineages (VRIJEN-
HOEK, ANGUS and SCHULTZ 1977, 1978).
Reduced molecular variation in selfing or asexual populations could, of course, be due to a variety of causes. In addition to the effect that we have been investigating, which may reduce nucleotide site diver- sity to 50% or less of the classical neutral expectation for selfing rates close to one, the expected value for a selfing population is already 50% less than the value for random mating, due to lower effective population size (POLLAK 1987). Hitchhiking by favorable gene substitutions, which has been shown to be at least as important in selfing populations as with tight linkage (HEDRICK 1980), may also reduce variation in selfers and asexuals. Selfing populations will also lose varia- tion at loci with heterozygote advantage (KIMURA and OHTA 1971). In addition, populations of selfing or- ganisms can potentially be founded by single individ- uals, so that severe bottlenecks may also have contrib- uted to reduced levels of variation. T h e data from selfing plant populations show some evidence for such bottlenecks (BARRETT and KOHN 199 l), especially the finding of more variation in levels of genetic diversity between populations than in outbreeding species (SCHOEN and BROWN 1991). In many cases, asexual populations seem to have originated in the relatively recent past from a single ancestral individual (QUAT-
TRO, AVISE and VRIJENHOEK 199 1, 1992), and have thus experienced a bottleneck effect. Nevertheless, we have found that, with plausible parameter values, the reduction in genetic diversity measures caused by the process investigated here can be greater than 80% in highly selfing populations, presumably with a greater reduction for asexuals. This suggests that background selection may explain a significant portion of the observed reduction in variation in these cases.
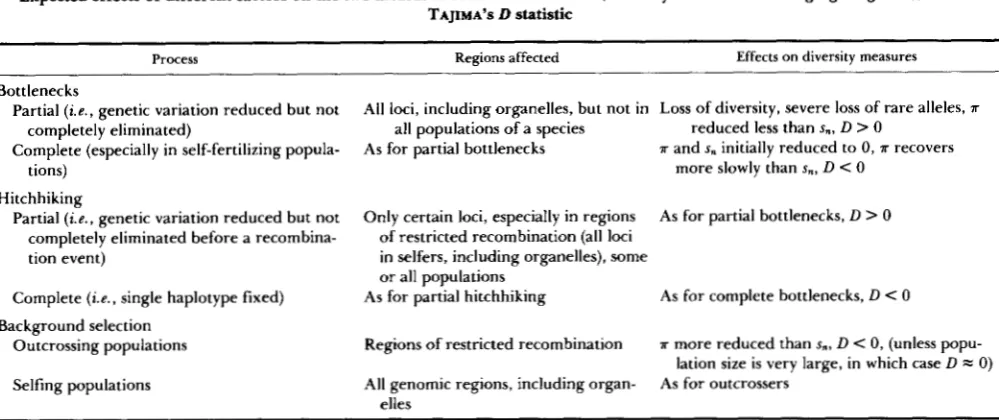
Distinguishing between different causes of re-
duced molecular variation: Unfortunately, many of
the possible factors mentioned above that may con- tribute to a reduction in molecular variation are ex- pected to have similar observable consequences for the pattern of neutral variability. For example, TAJI-
MA’S test will only partially discriminate between them. The test evaluates the significance of the difference, D, between the value of 4N,v obtained on the neutral
theory from the mean number of pairwise differences between sequences in the sample, and the value esti- mated from the number of segregating sites in the sample (TAJIMA 1989a). After complete hitchhiking
or loss of heterozygosity caused by fixation of a single
chromosome, the neutral variation in a population is due entirely to mutations that have arisen since that event. T h e restoration of neutral variation by muta- tion and drift after its elimination by population bot- tlenecks and hitchhiking events is a long-term process, and is accompanied by a transient excess of rare alleles compared with the statistical equilibrium under drift and mutation (MARUYAMA and FUERST 1984, 1985; WATTERSON 1984; TAJIMA 1989b). A recent popula- tion expansion without a bottleneck will have a similar effect. These events will produce negative values of TAJIMA’S D , as with background selection if popula- tion size is moderate (a few tens of thousands or less; see Table 6 of the APPENDIX). This makes background selection hard to discriminate from these other proc- esses. If effective population size is known to be very large, however, as seems to be the case in the Dro- sophila species that have been used in studies of DNA sequence variation (KREITMAN 1991), D is expected to be very small, and so a significant value of D would be inconsistent with background selection.
Hitchhiking events or population bottlenecks that merely reduce levels of genetic variation could pro- duce the opposite effect: with such partial effects, loss of heterozygosity is accompanied by severe loss of rare alleles, so that the value of s, relative to ?r is lower
than expected on equilibrium neutral theory (MARUY-
AMA and FUERST 1985; TAJIMA 1989b). Such a partial
effect will usually be expected for population bottle- necks, since surviving populations are unlikely to have remained small for a sufficient time that all variability is lost. Reductions of allele numbers in populations after bottlenecks have been observed in several species of plants (BARRETT and KOHN 1991) and animals
( JANSON 1987; LEBERG 1992). A positive value of D
would thus indicate partial hitchhiking or bottle- neck effects. T h e possible effects are summarized in Tabie 5.
Deleterious Mutations and Variation
TABLE 5
1299
Expected effects of different factors on the two measures of neutral variation (diversity and number of segregating sites), and on
TAJIMA’S D statistic
~ ~~
Process Regions affected Effects on diversity measures
Bottlenecks
~~
Partial (it-., genetic variation reduced but not All loci, including organelles, but not in Loss of diversity, severe loss of rare alleles, a
Complete (especially in self-fertilizing popula- As for partial bottlenecks a and s, initially reduced to 0, T recovers
completely eliminated) all populations of a species reduced less than s,, D > 0
tions) more slowly than .,s D < 0
Hitchhiking
Partial (ie., genetic variation reduced but not Only certain loci, especially in regions As for partial bottlenecks, D > 0 completely eliminated before a recombina- of restricted recombination (all loci
tion event) in selfers, including organelles), some or all populations
Complete ( i e . , single haplotype fixed) As for partial hitchhiking As for complete bottlenecks, D < 0 Background selection
Outcrossing populations Regions of restricted recombination a more reduced than s,, D < 0, (unless popu- Selfing populations All genomic regions, including organ- As for outcrossers
elles
lation size is very large, in which case D = 0)
samples of realistic size. Our initial results from such a study indicate that background selection is unlikely to produce a significantly negative
D
in the case of samples of genes from the Drosophila centromeric or telomeric regions, even if population sizes are much lower than seems to be the case in the Drosophila species studied to date (see above). Findings of signif- icantly negativeD
values for such samples, as in the study of y-ac-sc inD.
melanogaster by MART~N-CAMPOSet a1 (1992), would therefore strongly suggest that other factors have been involved.
T h e best hope for discriminating between different possibilities lies in the fact that background selection can only affect the level of neutral variation under sharply defined conditions: greatly restricted out- breeding, or very restricted recombination over a sufficiently large genomic region that the net muta- tion rate to deleterious alleles is high enough to cause a low equilibrium frequency of mutation-free gametes (see Figures 1 and 3). Given that these conditions are met, neutral sites in the genomic regions that meet the requirements should be affected uniformly, in all populations of the species and in related species with the same genome organization. In contrast, popula- tion bottlenecks should have genome-wide effects, but might affect different populations or taxa differently. Hitchhiking events should be confined to regions of restricted recombination or to highly inbreeding pop- ulations, but are likely to be sporadic in their occur- rence, so that different populations or species will probably vary in the extent to which they show re- duced variation. T h e differences between populations of
D.
melanogaster in the level of variation in the y-ac- sc region (MART~N-CAMPOS et al. 1992) further suggest that local hitchhiking or population size changes areresponsible for reductions in variability in this case.
Extensions of the selection model: T h e results
described above have assumed fixed values of s and h for all loci, and multiplicative fitness effects across loci, for analytical simplicity and convenience in run- ning the simulations. In reality, s and h must vary across loci (CROW and SIMMONS 1983), and it is im- portant to ask whether this has any serious conse- quences for our conclusions. In addition, interactions between loci may cause deviations from multiplicative fitness effects. As we have seen, the effect of back- ground selection is largely determined through the frequency of mutation-free chromosomes,&, in a non- recombining region of the genome. T h e effect of deviations from our simplifying assumptions about the mode of selection can therefore be understood by considering their effects on&.
T h e effect of variation in the selection parameters between loci can be studied as follows. In a random- mating population, with multiplicative fitnesses and with variation in sh (assumed to be uncorrelated with the mutation rate per locus), the number of mutations
per
chromosome will follow a Poisson distribution whose mean is given by replacing U/2sh in Equation4
by the product of U / 2 and the mean of llsh. T h e latter is equivalent to the mean persistence for a detrimental gene isolated from a natural population, estimated by CROW and SIMMONS (1983) to be ap- proximately 50. Hence, the “standard” value of sh used in our studies is appropriate even if there is variation among loci in s and h, as far as the estimate of the maximal effect of background selection for a given mutation rate in a random-mating population is concerned.mean of l/s replaces l/sh in the formula for fo (see RESULTS). T h e data of HOULE et al. (1992) suggest that the mean value of s for the effects of new detri- mental mutations on net fitness in a Drosophila pop- ulation cage environment is considerably less than 0.1 (see their Table 1). T h e mean of l/s is approximately equal to (1
+
C2)/S, where S and C are the mean and coefficient of variation of s. T h e value of s = 0.1 that we have used in our studies of selfing populations may thus overestimate fo, and hence underestimate the effect of background selection.These considerations suggest that, if anything, the existence of variation among loci in the effects of mutant alleles on fitness may increase the effect of background selection on neutral variation. T h e only situation in which this would not be the case is if the distribution of effects were strongly skewed or bimo- dal, such that 2Nah is of the order of 1 or less for a large fraction of deleterious mutations. As discussed in the ANALYTICAL RESULTS section, such weakly se- lected mutations would not interfere with the fate of linked neutral alleles. T h e above estimates offo would then overestimate the impact of background selection. But with the effective population sizes of a million or more required to account for observed levels of silent- site DNA diversity in natural populations of Drosoph-
ila (KREITMAN 1991), extremely small selection coef-
ficients would be needed for this effect to be impor- tant. Mutations subject to such weak selection would not be detectable in the laboratory measures of the effects of mutations on fitness cited above, and so this possibility can almost certainly be disregarded, except for species with small effective population sizes.
KONDRASHOV (1988) has argued that synergistic effects of deleterious mutations on fitness (ie., effects that increase with the number of mutations carried by an individual) may be widespread and have important consequences for the evolution of breeding systems. T h e effects of synergistic selection on fo can be ex- amined as follows. CHARLESWORTH (1 990), following
KIMURA and MARUYAMA (1966), studied mutation-
selection balance in a diploid sexual population with no recombination and with synergistic selection. His results show that the variance at equilibrium under synergistic selection is smaller than the mean, indicat- ing a departure from the Poisson distribution found with multiplicative fitnesses. T h e decrease in variance suggests thatfo will be smaller than the Poisson value for the same equilibrium mean, so that the values we have used are conservative. This is confirmed by direct calculation offo from the recurrence relations. For the selection parameters used in the top part of Table 2 of CHARLESWORTH (1 990), with U = 0.1 and 0.01 we findfo = 0.002 and 0.25 respectively, com- pared with corresponding Poisson values of 0.004 and
0.28. These reductions info are unlikely to be meas- urable experimentally.
Conclusions: Overall, while it is clear that the more
extreme examples of reduced nucleotide site diversity in sections of the Drosophila genome cannot be ac- counted for by background selection against delete- rious mutations, so that some hitchhiking events must be invoked, examples of less extreme, but unusually low, diversity values are consistent with this model. It may therefore be at least a contributory factor to the correlation between molecular variability and rate of recombination described by BEGUN and AQUADRO (1992). In addition, it is probable that this process contributes to the reduced levels of molecular varia- tion seen in asexual and highly selfing taxa.
We are grateful to JAMES CROW, who independently proposed a similar mechanism, for helpful discussions. We also thank RICHARD HUDSON and two anonymous reviewers for suggestions for improv- ing the manuscript.
LITERATURE CITED
AGUADE, M., N. MIYASHITA and C. H. LANGLEY, 1989a Reduced variation in the yellow-achaete-scute region in natural popula- tions of Drosophila melanogaster. Genetics 122: 607-615. AGUADE, M., N. MIYASHITA and C. H. LANGLEY,
198913 Restriction-map variation at the reste-tko region in natural populations of Drosophila melanogaster. Mol. Biol. Evol.
ASHBURNER, M., 1989 Drosophila: A Laboratory Handbook. Cold Spring Harbor Laboratory, Cold Spring Harbor, N.Y.
BARRETT, S. C. H., and J. R. KOHN, 1991 Genetic and evolution- ary consequences of small population size in plants: implications for conservation, pp. 3-30 in Genetics and Conservation of Rare Plants, edited by D. A. FALK and K. E. HOLSINGER. Oxford
University Press, New York.
BEECH, R. N., and A. J. LEIGH-BROWN, 1989 Insertion-deletion variation at the yellow-achaete-scute region in two natural pop- ulations of Drosophila melanogaster. Genet. Res. 53: 7-15. BEGUN, D. J., and C. F. AQUADRO, 1991 Molecular population
genetics of the distal portion of the X chromosome in Drosoph- ila: evidence for genetic hitchhiking of the yellow-achaete region. Genetics 1 2 9 1147-1 158.
BEGUN, D. J., and C. F. AQUADRO, 1992 Levels of naturally occurring DNA polymorphism correlate with recombination rates in D . melanogaster. Nature 356: 519-520.
BERRY, A. J., J. W. AJIOKA and M. KREITMAN, 1991 Lack of polymorphism on the Drosophila fourth chromosome resulting from selection. Genetics 1 2 9 11 11-1 117.
BOLSHAKOV, V. N., A. A. ZHARKIKH and I. F. ZHIMULEV, 1985 Intercalary heterochromatin in Drosophila 11. Hetero- chromatic features in relation to local DNA content along the polytene chromosomes of Drosophila melanogaster. Chromo- soma 92: 200-208.
CHARLESWORTH, B., 1990 Mutation-selection balance and the ev- olutionary advantage of sex and recombination. Genet. Res. 55: 199-221.
CHARLESWORTH, B., 1992 New genes sweep clean. Nature 356: 475-476.
CHARLESWORTH, B., D. CHARLESWORTH and M. T. MORGAN, 1990 Genetic loads and estimates of mutation rates in very inbred plant populations. Nature 347: 380-382.