MCFARLAND, DANIEL CLINTON. Spatial Dependency of Muscular and Joint Loading During Dynamic Submaximal Pushing and Pulling. (Under the direction of Drs. Katherine Saul and Scott Ferguson).
This dissertation evaluates how workspace design impacts muscular demand and joint loading during dynamic submaximal push-pull tasks. Work involving extensive pushing and pulling is associated with higher frequency of shoulder complaints. While reports of shoulder muscle demand during submaximal isometric tasks are abundant, dynamic submaximal push-pull exertions are not well understood. First, the effects of task type and task target on muscle
demand (weighted EMG average) of surface glenohumeral muscles were evaluated. Seventeen healthy young adults performed unimanual and bimanual pushes and pulls to 3 thoracohumeral elevations (20º, 90º, 170º) and 4 elevation planes (0º, 45º, 90º, 135º) with loading at 15% of isometric push-pull capacity. Pulling required less demand than pushing (p<0.0001). Muscle demand varied more with elevation than elevation plane. The lowest target had highest demand for pulling (p<0.01), and the most elevated target had highest demand for pushing (p<0.0001). Working above the shoulder is known to increase demand during isometric tasks, however, these results suggest that for dynamic tasks working against gravity has a larger effect on demand than task target.
(planes of elevation: 0º, 45º, 90º, and 135º) at 90º thoracohumeral elevation and 3 elevation targets (thoracohumeral elevations: 20º, 90º, 170º) at 90º plane of elevation. The lateral 45º horizontal target was most stable regardless of exertion type and would be the ideal target placement when considering stability. This target is likely more stable because the applied load acts essentially perpendicular to the glenoid, limiting shear force production. The cross-body 135º horizontal target was particularly unstable for
unimanual pushing, and the applied force direction for this task is essentially parallel to the glenoid, likely creating shear forces. Pushing was less stable than pulling (all targets except sagittal 170º for both unimanual and bimanual and horizontal 45º for bimanual) (p<0.01), which is consistent with prior reports. There were limited stability benefits to task placement for pushing, and larger stability benefits may be seen from converting push tasks to pull rather than optimizing task layout. There was no difference in stability between bimanual and unimanual tasks, suggesting no stability benefit to bimanual operation.
model, leading to poor tracking and simulation failure. Therefore, force constraints may be more robust when representing stability.
Pulling
by
Daniel Clinton McFarland
A dissertation submitted to the Graduate Faculty of North Carolina State University
in partial fulfillment of the requirements for the degree of
Doctor of Philosophy
Mechanical Engineering
Raleigh, North Carolina 2018
APPROVED BY:
_______________________________ _______________________________ Dr. Katherine Saul Dr. Scott Ferguson
ii DEDICATION
iii BIOGRAPHY
iv ACKNOWLEDGMENTS
First and foremost, I would like to thank Dr. Katherine Saul. Without your support and guidance, I would have abandoned my graduate education long ago. Thank you for your patience and guidance as you helped me become the researcher I am today. I would also like to thank all the member of my committee for their continual support and guidance. I would like to thank the CFD Research corporation for funding much of the research presented here.
I would like to thank all my lab mates throughout the years. Emily McCain and Michael Poppo, thank you for making science fun. Nikhil Dixit, it has been a pleasure working with you, and I will always remember the fun we had on our conference trips. Matthew Berno, it has been fun getting to know you and your unique hobbies over the last year. And Alex Brynildsen and Lauren Levine, thank you for helping post-process much of the data that comprises this work.
v TABLE OF CONTENTS
LIST OF TABLES ... vii
LIST OF FIGURES ... viii
Chapter 1: Background ... 1
Work-related Musculoskeletal Disorders ... 1
Ergonomics of Pushing and Pulling ... 2
Strength Capacity ... 3
Electromyography and Muscle Demand ... 7
Joint Loading ... 12
Applications of Ergonomic Analyses ... 13
Glenohumeral Stability ... 15
Passive Stability Mechanisms ... 15
Active Stability Mechanisms ... 17
Recurrent Instability and Degenerative Wear ... 20
Computational Musculoskeletal Modeling ... 21
Upper Extremity Model ... 22
Modeling Glenohumeral Stability... 25
Computed Muscle Control ... 28
Specific Aims ... 30
Chapter 2: Spatial Dependency of Shoulder Muscle Demand During Dynamic Unimanual and Bimanual Pushing and Pulling ... 33
Abstract ... 33
Introduction ... 33
Methods ... 36
Experimental Protocol ... 36
Data Analysis ... 42
Statistical Analysis ... 43
Results ... 43
Fatigue... 43
Muscle Demand ... 45
Discussion ... 49
Fatigue... 49
Muscle Demand ... 49
Conclusion ... 57
Chapter 3: Spatial Dependency of Glenohumeral Joint Stability During Dynamic Unimanual and Bimanual Pushing and Pulling ... 58
Abstract ... 58
Introduction ... 59
Methods ... 61
Experimental Protocol ... 61
Musculoskeletal Modeling ... 64
Computational Simulations ... 66
Results ... 68
Simulation Performance... 68
vi
Discussion ... 73
Conclusion ... 78
Chapter 4: Comparison of Techniques to Incorporate Glenohumeral Stability Mechanisms into Inherently Stable Musculoskeletal Models ... 80
Abstract ... 80
Introduction ... 81
Methods ... 83
Musculoskeletal Modeling ... 84
Computational Simulations ... 85
Simulation Constraints ... 86
Statistical Analysis ... 88
Results ... 89
Discussion ... 101
Conclusion ... 106
Chapter 5: Conclusions ... 108
Contributions ... 108
Applications ... 109
Future Work ... 111
Summary ... 114
References ... 116
Appendices ... 129
Appendix A: Anthropometric Data for Chapters 2 and 3 ... 130
Appendix B: Strength Capacity and Dynamic Loading ... 132
Appendix C: Custom Push-pull Device Parts List, Manufacturing, and Assembly ... 133
Appendix D: Muscle Demand for Chapter 2 ... 141
Appendix E: CMC Code Unimanual Concavity Compression ... 146
Appendix F: CMC Code Unimanual Scapulohumeral Balance ... 150
Appendix G: CMC Code Bimanual Concavity Compression ... 154
Appendix H: Strength Scaling Code ... 160
Appendix I: Stability for Chapter 3 ... 167
Appendix J: Anthropometric Data for Chapter 4 ... 170
Appendix K: Stability for Chapter 4 ... 171
Appendix L: Joint Reaction Forces for Chapter 4 ... 174
vii LIST OF TABLES
Table 2.1 Subject push-pull capacity and demographic information ... 45
Table 3.1 Removed simulations ... 69
Table 4.1 Failed simulations ... 90
viii LIST OF FIGURES
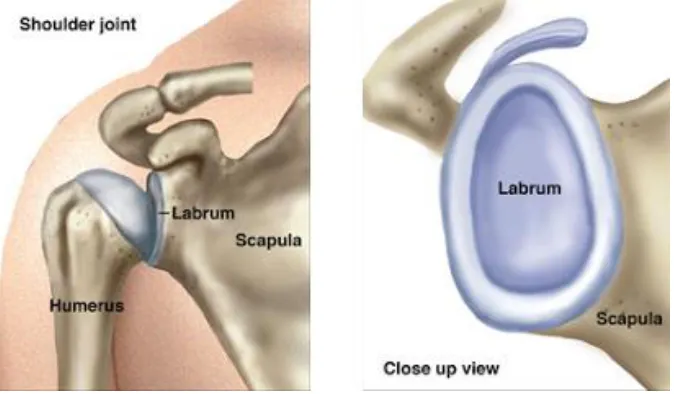
Figure 1.1 Glenohumeral joint ... 17
Figure 1.2 Coracohumeral and glenohumeral ligaments ... 18
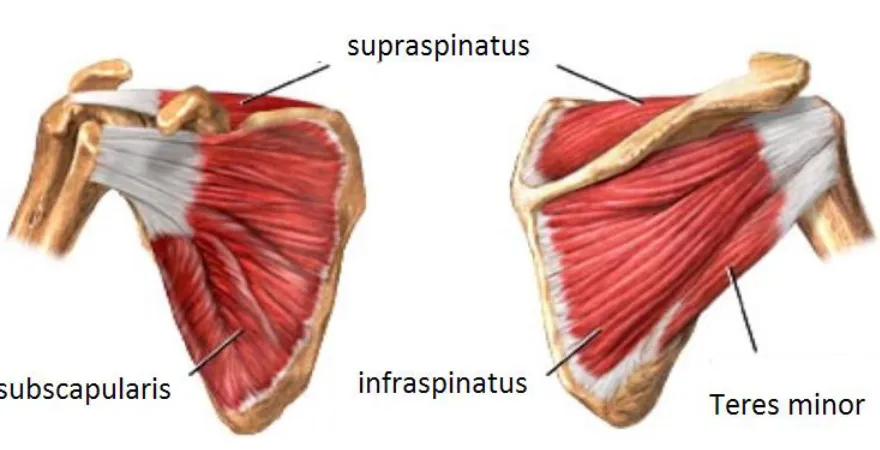
Figure 1.3 Rotator cuff muscles ... 19
Figure 1.4 Hill-type model of skeletal muscle ... 23
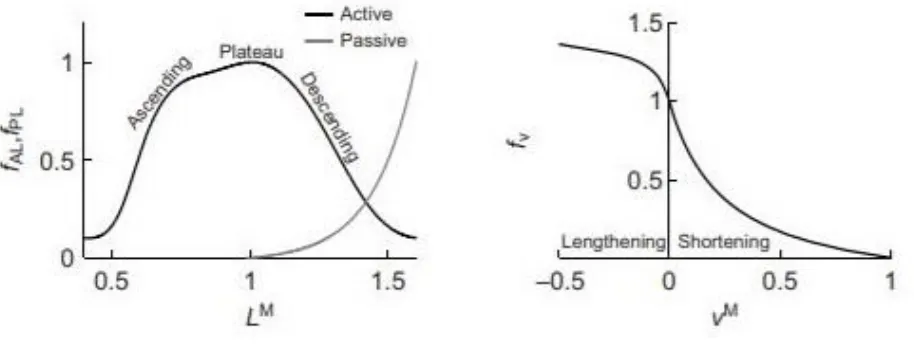
Figure 1.5 Force-length and force-velocity relationships ... 24
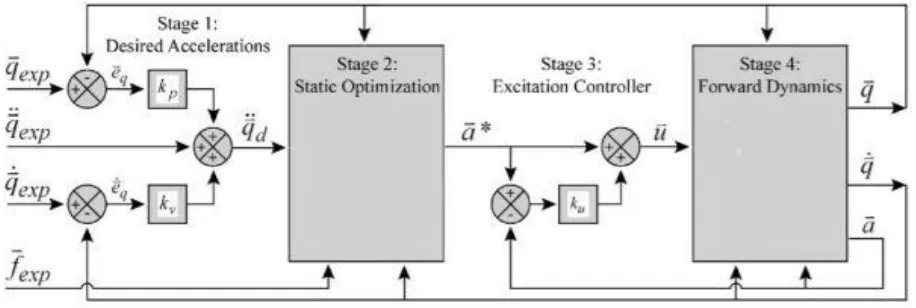
Figure 1.6 Computed Muscle Control algorithm ... 28
Figure 2.1 Task targets ... 40
Figure 2.2 Custom pulley resistance system ... 41
Figure 2.3 Fatigue analysis ... 44
Figure 2.4 Main effect of plane of elevation ... 46
Figure 2.5 Task type by thoracohumeral elevation interaction ... 47
Figure 3.1 Task targets ... 62
Figure 3.2 Upper limb marker set ... 64
Figure 3.3 Unimanual task direction by task target interaction ... 71
Figure 3.4 Bimanual task direction by task target interaction ... 72
Figure 4.1 Stability over time ... 92
Figure 4.2 Peak instability ... 94
Figure 4.3 Net glenohumeral reaction ... 95
Figure 4.4 Rotator cuff activations during flexion ... 99
1 CHAPTER 1
Background
Work-related Musculoskeletal Disorders
Work-related musculoskeletal disorders (WMSD) are a group of painful disorders to muscle, nerve and tendon that develop gradually due to overuse of the musculoskeletal system. These disorders do not include traumatic injuries such as tearing muscle or tendon during a workplace accident. WMSD is a broad category of disorders, and in this work, we will focus on WMSD that occur at the shoulder such as sprains, strains, and rotator cuff tendonitis.
Physically demanding occupations such as military service have high occurrence of musculoskeletal disorders, with active duty non-deployed service members having an injury rate of 62.8% per person-years (Hauret et al., 2010). In general, repetitive motion, excessive force, and working in awkward postures are associated risk factors for WMSD; however, each type of WMSD has different risk factors associated with it (da Costa and Vieira, 2010). For the
shoulder, working at or above shoulder height is a well-documented risk for muscle fatigue and musculoskeletal disorders (Fredriksson et al., 2002; Grieve and Dickerson, 2008; Hagberg and Wegman, 1987; Roquelaure et al., 2009; Wiker et al., 1989).
WMSD place a large burden on the economy and workers’ health, accounting for 29-35% of all occupational injuries and illnesses involving days away from work in private industries (Bhattacharya, 2014). The Bureau of Labor Statistics reports the number of WMSD cases in the United States was 335,390 in 2007 (Bhattacharya, 2014), and it is estimated that 20% of
2 Academy of Science, 2001), and estimates of total cost from work-related MSD range between $45 and $54 billion (National Academy of Science, 2001). As a result of these high costs, WMSD is the most expensive form of work disability (Thiehoff, 2002). Of these disorders, shoulder injuries in particular are taxing on worker health and the economy. A study of worker compensation claims found that shoulder claims resulted in the second highest total cost behind lumbar spine claims and that 30.6% of claims involving the shoulder resulted in over seven days of lost work (Dunning et al., 2010).
Ergonomics of Pushing and Pulling
3 Strength Capacity
Determining strength capacity for a task can help ergonomists develop workplace guidelines for maximum acceptable forces, such as Snook tables (Snook and Ciriello, 1991). Some workplace guidelines, like Snook tables, are based on psychophysical methods of
determining maximal capacity, where subjects self-select workloads that they could sustain for 8 hours without straining themselves (Boocock et al., 2006; Snook and Ciriello, 1991). More recently, ergonomic tools like 3DSSPP (University of Michigan, Ann Arbor, MI) have been based off quantitative strength measurements rather than psychophysical evaluations. To help inform such tools and guidelines, several studies have characterized one-handed manual force capacity in diverse scenarios (Das and Wang, 2004; Fischer et al., 2013; La Delfa et al., 2014; La Delfa and Potvin, 2016; J. Lin et al., 2013; MacKinnon, 1998; Roman-Liu and Tokarski, 2005). The majority of strength literature focuses on isometric strength capacity rather than isokinetic strength capacity, and relevant findings from these isometric studies are summarized here. Inferiorly directed forces have been reported to be the strongest exertion direction for both males and females (Chow and Dickerson, 2009; Fischer et al., 2013; La Delfa et al., 2014; La Delfa and Potvin, 2016). Chow and Dickerson (2009) suggest that mass of the arm is a contributing factor in increasing strength capacity in this direction. After the inferior direction, those studies
4 used seated tests without a torso restraint. On the other hand, Chaffin et al. (1983) and Chow and Dickerson (2016) both evaluated standing push-pull capacity without external stabilization of the lower limb and found push strength to be greater. Experimental task conditions vary between these studies, and different task conditions are known to influence strength capacity (Chow and Dickerson, 2009; Das and Wang, 2004; Fischer et al., 2013; La Delfa and Potvin, 2016); therefore, strength data needs to be interpreted in context of the experimental conditions.
Since experimental conditions can vary greatly between studies, knowledge of what factors influence strength is critical when interpreting results. Posture and task location have a strong influence on isometric strength capacity (Chow and Dickerson, 2009; Das and Wang, 2004; La Delfa and Potvin, 2016; J. Lin et al., 2013). La Delfa and Potvin (2016) suggest that maximal capacity is higher when the direction of applied force is parallel to the vector from the shoulder to the knuckles and weakest when the direction of force is perpendicular to this vector. For standing pulling, strength capacity is related to handle height, decreasing with increased handle height (J. Lin et al., 2013). Effects of sitting or standing on strength capacity have been reported with mixed results (Chow and Dickerson, 2009; Das and Wang, 2004). Chow and Dickerson (2009) report only marginal differences in strength capacity between sitting and standing whereas Das and Wang (2004) report standing strength as 79% of seated strength. These differing results may deal more with stability rather than strength, as Chow and Dickerson (2009) had participants sit in a stool without back support whereas Das and Wang (2004) had subjects sit in a chair. Stability and foot placement in standing exertions are known to influence strength capacity (Fischer et al., 2013). For example, when balance was removed as a
5 exertions as well. Other experimental factors including handle stability, orientation, and friction have been shown to influence strength (Seo and Armstrong, 2009; Seo et al., 2010). For
example, handles oriented perpendicular to applied force direction result in greater strength capacity than handles oriented parallel to the applied force direction (Seo et al., 2010).
Additionally, differences in isometric unimanual strength capacity exist between genders (Das and Wang, 2004; J. Lin et al., 2013). Studies agree that female strength capacity is less than that of males, however, the degree of reported strength difference varies. Lin et al. (2013) report female pulling strength was 70% of male pulling strength, whereas Das and Wang (2004) report female strength capacity was 56% of male strength capacity when considering both pushing and pulling.
These studies summarized thus far have all been isometric unimanual tasks; however, task speed also affects strength capacity during dynamic tasks (Calé-Benzoor et al., 2016a; Garg and Beller, 1990; Imrhan and Ramakrishnan, 1992; Mital et al., 1995). Several studies show that pull strength decreases with increased task speed (Garg and Beller, 1990; Imrhan and
Ramakrishnan, 1992; Mital et al., 1995). Calé-Benzoor et al. (2016a) compared both dynamic pushing and pulling strength at 2 task speeds (12.22 cm/s and 36.67 cm/s) and found similar strength capacity between pushing and pulling at the low task speed. However, at the high task speed, pulling capacity was higher than pushing.
6 standing exertions, so lower limb contributions may influence these results. To the author’s
7 Differences in strength capacity between sexes also exist for bimanual tasks with females having less absolute strength capacity than male counterparts (Chaffin et al., 1983; Chow and Dickerson, 2016; Kumar et al., 1995). Chow and Dickerson (2016) report that female push strength was 65% of male push strength and female pull strength was 70% of male pull strength, whereas Kumar et al. (1995) report less striking differences with female strength ranging from 1-29% lower than male strength capacity depending on task conditions.
Electromyography and Muscle Demand
Electromyography (EMG) is a tool frequently used by ergonomists to characterize task demand at the muscular level, since increases in muscular demand are linked with shoulder pain and discomfort (Wiker et al., 1989). Demand on individual muscles (Bennett et al., 2011; Kao et al., 2015; MacKinnon and Vaughan, 2005) and total muscle demand (Chopp et al., 2010;
McDonald et al., 2012; Meszaros et al., 2018) during push-pull tasks have been evaluated using EMG; total muscle demand is typically calculated as a sum or average of individual EMG signals (Nadon et al., 2016). Frequently, averaged muscular demand is calculated as a weighted average of individual EMG signals, with physiological cross-sectional area (PCSA) as the weighting factor (Chow et al., 2017; Meszaros et al., 2018; Nadon et al., 2016).
∑ 𝑁𝑜𝑟𝑚_𝐸𝑀𝐺𝑖[
𝑃𝐶𝑆𝐴𝑖 ∑𝑛𝑖=1𝑃𝐶𝑆𝐴𝑖
]
𝑛
𝑖=1
PCSA is the cross-sectional area of muscle perpendicular to muscle fibers and is related to a muscle’s maximum capacity through specific tension of muscle. By weighting individual EMG
8 Muscle demand has been previously reported for push-pull tasks with mixed results, but differences between studies may be explained by muscle selection. Multiple muscles and muscle compartments span the shoulder complex, but experimental EMG studies often only measure a subset of muscles due to experimental constraints such as number of available EMG channels. Selecting more muscles that are involved in pushing than pulling, for example, will artificially raise the demand of pushing, skewing the comparison; therefore, it is important to consider muscle section when evaluating results of EMG studies. Several studies on dynamic cart pushing report that pushing requires less demand at the muscular level than pulling (Bennett et al., 2011; Kao et al., 2015; C. Lin et al., 2010). However, these studies evaluated a limited selection of upper limb “push” muscle. For example both Bennett et al. (2011) and Lin et al.
(2010) only measure anterior deltoid and no other push muscles such as pectoralis major or triceps brachii. In a full-body two-handed maximum push-pull study, Chow et al. (2017) evaluated a more extensive selection of upper limb muscles (pectoralis major, biceps brachii, middle deltoid, middle trapezius, and triceps brachii)and found that pushing resulted in 82% higher EMG activation in comparison to pulling. These studies highlight the importance of evaluating muscle selection when comparing muscular demand results.
9 the torso, MacKinnon and Vaughan (2005) reported that shoulder complex muscles worked at a higher percent of the maximum voluntary capacity (MVC) than did trunk muscles. Therefore, muscle demand of the shoulder complex during pushing and pulling is critical under a variety of performance conditions.
Muscle demand for the shoulder complex is influenced by both exertion direction and task location, but exertion direction has a stronger influence on demand than does task location (Chopp et al., 2010; Cudlip et al., 2016; Meszaros et al., 2018). . Two prior studies that focused solely on overhead isometric exertions of 30 and 40N found that backward (posteriorly directed pull) exertions resulted in highest muscular demand (Chopp et al., 2010; Cudlip et al., 2016) whereas Meszaros et al. (2018) evaluated more spatially varied task targets at varying loads between 20 and 60N and report that upward exertions were the most demanding. All three studies, however, concurred that downward exertions were the least demanding which agrees with isometric strength capacity studies that report inferiorly directed exertions are the strongest (Chow and Dickerson, 2009; Fischer et al., 2013; La Delfa et al., 2014; La Delfa and Potvin, 2016). Furthermore, Meszaros et al. (2018) found that increasing submaximal loading increased muscle demand regardless of exertion direction, but exertion direction had a dominant influence on demand, that is, downward exertions at the highest load were less demanding than upward exertions at the lowest load. Therefore, more benefits in reducing muscular demand may be seen by first considering task direction if possible rather than just optimizing task location.
Muscular demand during seated isometric exertions is spatially dependent on task location (McDonald et al., 2014; McDonald et al., 2012; Meszaros et al., 2018; Nadon et al., 2016), with superior tasks generally increasing muscular demand (McDonald et al., 2014;
10 for right-handed subjects, however, did not show an increase in demand with more elevated targets (McDonald et al., 2014; Nadon et al., 2016). Lateral location also affects demand, with increased demand for pushing, pulling, and upward exertions as task location moved laterally to either side of the subject (McDonald et al., 2012; Nadon et al., 2016); horizontal task placement influenced muscular demand more than superior/inferior and anterior/posterior target location during pushing and pulling (McDonald et al., 2012). When contextualizing these results, it is important to note that pushing and pulling are defined as purely anterior and posterior forces in this study. Another noteworthy finding from this study was that pulling was more spatially influenced than pushing. Similarly, upward exertions showed more spatial dependency than downward exertions (Nadon et al., 2016). These studies evaluated the effects of spatial location throughout the reachable workspace; other studies have considered the effects of task location in purely overhead work (Chopp et al., 2010; Cudlip et al., 2016). From Cudlip et al. (2016), it was concluded that overhead work should remain within 15 cm in the medial/lateral direction of their pelvis since substantial changes in muscular activity occurs beyond this threshold. This is
11 one such report, pulling with a handle at waist height and pushing with the handle at shoulder height were less demanding than other handle heights (Chow et al., 2017).
Lastly, sex differences exist in muscle demand for push-pull tasks (Chow et al., 2017; Cudlip et al., 2015). Both of these studies report that females require higher activations to perform the same tasks. Chow et al. (2017) accounted for differences in strength capacity between men and women by dividing EMG averages by maximal force capacity; however, differences in activation still persisted, indicating that women were less efficient at converting muscular activity to force. Chow et al. (2017) did note that tasks were performed at fixed handle heights, and differences in anthropometry between males and females may contribute to these differences. Lin et al. (2013) also compared sex differences for cart pushing tasks, but found no significant difference between sexes; however, their sample size was much smaller than the other studies, and this report may be limited due to statistical power.
12 the torso and lower limb are unconstrained, upper limb muscle demand is most affected by task requirements. Further, isolated shoulder movement will require more extreme motion that may represent the worst-case scenarios if operators were constrained, i.e. by a seatbelt during machine operation.
Joint Loading
Overuse and repetitive joint stress can lead to joint wear and disease such as
13 and do not consider how the net reaction force acts at the glenohumeral joint. The direction of the net joint reaction force is critical to glenohumeral stability (see section 1.3). Nimbarte et al. (2013) evaluated the resultant joint reaction force at the glenohumeral joint during dynamic cart pushing tasks, and found that higher transverse to compressive forces act at the glenohumeral joint, indicating stability risks for cart pushing tasks. Additionally, they found that reaction forces at the glenohumeral joint were influenced by task conditions including cart weight and walkway gradient. Marchi et al (2014) calculated a stability index related to the direction of the net reaction force for hand positioning tasks and report that pushing resulted in less stable reactions than pulling. Furthermore, Vidt et al. (2014) found that the net joint reaction force was directed within the glenoid for entire duration of a functional pull tasks, further suggesting that pulling is a stable motion. Future work evaluating how task conditions such as task location influence the net joint reaction at the glenohumeral joint would provide valuable information to improve the design of workspaces.
Applications of Ergonomic Analyses
Strength capacity studies have been applied to the design of workplaces by informing guidelines for maximum acceptable forces for particular tasks (Snook and Ciriello, 1991). These studies take the approach of evaluating a range of specific tasks and developing tables of
maximum acceptable forces based on task condition. Many of these studies are based on
14 predicts static strength requirements for tasks such as pushes and pulls based on input data of posture, force parameters and subject anthropometry. Outputs include percentages of men and women who have the strength to perform the tasks and data comparisons to NIOSH guidelines. Such software packages are useful when designing workspaces to determine if novel tasks are too demanding, but 3DSSPP is most useful for analysis of slow movements in heavy material handling tasks, since the computations assume effects of acceleration and momentum are negligible. Characterization of submaximal tasks throughout the reachable workspace is needed to expand the relevance of these types of tools to dynamic repetitive tasks that also pose a risk for injury.
Muscle demand studies have also been used to refine workspace and task design. Several authors have developed 3-dimensional spatial maps of muscle activities for a variety of
submaximal isometric exertions (McDonald et al., 2014; McDonald et al., 2012; Nadon et al., 2016). Data from these studies were used to develop predictive equations to extrapolate demand of individual muscles to all hand locations within the reachable workspace. These predictive relationships demonstrate the complex non-linear relationship between hand location and individual and overall muscle demand. Such predictive equations can be beneficial to
15 Glenohumeral Stability
The glenohumeral joint is the most mobile joint in the human body due to a lack of an intrinsically stable osseous socket like the acetabulum of the hip joint. Despite the shallow glenoid fossa, the humeral head remains centered throughout motion, exhibiting kinematics similar to a ball-and-socket (Howell et al., 1988). Even under anterior loading during abduction, in-vivo humeral head translations are on the order of millimeters (Cereatti et al., 2014). When excessive or symptomatic translations of the humeral head occur, however, the joint is said to be clinically unstable, and normal function of the shoulder complex is inhibited (Pagnani and Warren, 1994; Soslowsky et al., 1997) Glenohumeral stability is provided through a combination of passive structures and active contributions of muscles, with muscle contributions acting as the primary stabilizers during motion. Here we provide a summary of both active and passive
stabilizers.
Passive Stability Mechanisms
superior-16 inferior having increased depth over the anterior-posterior direction (Halder et al., 2001; Lippitt et al., 1993).
In addition to the labrum providing additional depth to the glenoid concavity, the passive capsuloligamentous structures surrounding the glenohumeral joint provide a critical component of glenohumeral joint stability (Lippitt and Matsen, 1993; Terry et al., 1991). Major ligaments include the coracohumeral ligament and inferior, middle, and superior glenohumeral ligaments (Figure 2). The function of these ligaments is highly dependent on the position of the humerus relative to the scapula, and several cadaveric studies have evaluated their role in stability in different postures (Bigliani et al., 1996; Burkart and Debski, 2002; Felli et al., 2012; Terry et al., 1991). The inferior glenohumeral ligament is the major static stabilizer of the abducted
glenohumeral joint against anterior instability (Bigliani et al., 1996; Felli et al., 2012; Terry et al., 1991). The superior glenohumeral ligament and the coracohumeral ligament act as stabilizers in the inferior direction (Burkart and Debski, 2002). Furthermore, the superior glenohumeral ligament works with the middle glenohumeral ligament to stabilize the joint in adducted postures (Felli et al., 2012). The middle glenohumeral ligament also provides anterior stability in
abducted postures (Burkart and Debski, 2002; Felli et al., 2012). Ligaments, however, are
17
Active Stability Mechanisms
Muscles act to stabilize the glenohumeral joint by controlling the direction of the
resultant joint reaction force. The rotator cuff is the primary active stabilizer of the glenohumeral joint and is comprised of four muscles (infraspinatus, supraspinatus, subscapularis, and teres minor) (Figure 3). Rotator cuff muscles originate on the scapula, and the four tendons connect with each other prior to insertion on the humeral head to form a common cuff (Sonnabend and Young, 2009). Rotator cuff muscles lie under the deltoids, and their activity is typically measured with fine-wire EMG since surface measurements of these muscles can be inaccurate (Rajaratnam et al., 2014).
Figure 1.1: Glenohumeral joint.
The glenohumeral joint is the articulation of the humeral head with the glenoid fossa of the scapula. The glenoid fossa is a shallow concavity whose depth is extended by the glenoid labrum. Concavity depth is directionally depended with the superior-inferior direction having increased depth over the anterior-posterior direction. (adapted from
18 Figure 1.2: Coracohumeral and glenohumeral ligaments.
Ligaments are passive stabilizers that provide additional stability under tension. Attachment and insertion points of the coracohumeral and glenohumeral ligaments are displayed. (adapted from (Yang et al., 2010)).
Active stabilization is provided through muscles by two mechanisms: concavity
inferior-19 superior direction corresponds to the increased concavity depth in the superior-inferior plane (Lippitt and Matsen, 1993).
Figure 1.3: Rotator cuff muscles.
The rotator cuff consists of four muscles (supraspinatus, infraspinatus, subscapularis, and teres minor) and is the primary active stabilizer of the glenohumeral joint. (adapted from
http://www.drtylermarshall.com/rotater/).
The other active stability mechanism, scapulohumeral balance, requires that the net joint reaction force pass through the glenoid; therefore, the larger the arc of the glenoid concavity, the larger the range of net forces that can be balanced by the glenoid fossa. This range of stable net reaction force vectors can be estimated through geometric calculations; however, the glenoid fossa does not have a symmetric concavity, but rather a complex ‘inverted-comma’ shape
20 reaction forces stabilized by scapulohumeral balanced have been estimated by coaxially loading the humeral head and incrementing glenoid angulation until the humeral head dislocates (Lippitt and Matsen, 1993). The range of stability from scapulohumeral balance was greater in the superior-inferior direction than anterior-posterior direction, which again correlates with the greater concavity depth in this direction.
Recurrent Instability and Degenerative Wear
21 stability ratio in the direction of the defect by 65%. Therefore, wear to the glenoid concavity from overuse or atraumatic instability can lead to further instability. Furthermore, Marchi et al. (2014) reported reduction in the stability index, a measure of transverse to compressive forces calculated using a musculoskeletal model (informed with experimental force, EMG and kinematic data), for subjects with prior dislocation when compared against healthy controls. If damage to the glenohumeral joint is severe, recurrent instability can occur and surgical
intervention may be needed to restore stability and function. Surgical intervention can restore functional stability with a high success rate; for example, a postoperative follow up of Bankart repairs, a procedure in which the torn labrum and ligaments are reattached, showed that 90% of subjects did not experience a recurrent instability at the follow up at least 4 year later (Saper et al., 2017). While surgical intervention can be successful at restoring glenohumeral instability, preventing initial instability by preventing wear to the joint would be a preferable solution.
Computational Musculoskeletal Modeling
Computational musculoskeletal modeling is an effective framework to perform exploratory studies that would not be possible experimentally. Through modeling and
22
Upper Extremity Model
A previously developed and validated three-dimensional upper extremity model will be used in this work to characterize joint reaction forces during unimanual and bimanual pushing and pulling (Holzbaur et al., 2005; Saul et al., 2015). This model was developed in OpenSim (OpenSim, Stanford University, Palo Alto, CA) (Delp et al., 2007). OpenSim is an open-source musculoskeletal modeling and simulation platform capable of performing and analyzing muscle driven simulations of motion. The unimanual upper extremity model contains 7 degrees of freedom including 3 at the shoulder (plane of elevation, thoracohumeral elevation, axial rotation) as well as elbow flexion, forearm pronation/supination, and wrist flexion and deviation as
defined by the International Society of Biomechanics (Wu et al., 2005). Scapular and clavicle movement are constrained to move with scapulohumeral rhythm through regression equations developed by de Groot and Brand (2001). We will employ an implementation of the model with expanded internal shoulder rotation range of motion (Vidt, 2014).
The model contains 50 muscles and muscle compartments spanning the shoulder, elbow, forearm, and wrist joints. The upper extremity model employs Hill-type muscle actuators (Figure 4), a lumped parameter muscle-tendon model that accounts for nonlinear force production in muscle (Zajac, 1989). The Hill-type muscle incorporates a contractile element, a passive elastic element, and a series elastic element.
23 velocity of muscle fibers. Isometric force production occurs when muscle fiber remains at a constant length and fiber velocity is 0. When the muscle contracts, muscle fiber length decreases, and as the shortening velocity increases muscle force production decreases. As a muscle
lengthens, the force that a muscle produces is greater than the isometric force. Force production increases with increasing lengthening velocity in a non-linear manner until the force plateaus (Zajac, 1989). This plateau in force production occurs because muscle tissue begins to fail mechanically at this fiber-velocity. In musculoskeletal models, muscle excitation and activation continuously vary from 0 (unexcited) to 1 (fully excited). At full activation, the contractile element of the Hill-type muscle model can achieve its maximal force, but as activation decreases peak force on the force-length and force-velocity curves also decreases.
Figure 1.4: Hill-type model of skeletal muscle.
Mechanical model of skeletal muscle, developed by A.V. Hill (Hill, 1938). The contractile element (CE) represents active force production in muscle and is dependent on muscle fiber length and contraction velocity. The passive elastic element (PE) is modeled as an elastic spring in parallel to the contractile element. The passive element represents titin and connective tissues. The series elastic element (SE) is an elastic spring acting in series to the CE and PE and
24 The passive elastic element represents passive stretch in muscle. Passive force production occurs in muscle when the fiber length stretches beyond the optimal fiber length and has
nonlinear behavior as described by the passive force length curve (Figure 5). Passive force production only depends on stretch in muscle fiber and is not dependent on muscle activation. Total force production of muscle is the combined force of the active and passive components. The serial elastic element represents tendon and is modeled as a non-linear spring, and acts in series to the contractile element and the passive elastic element which act in parallel to each other.
Figure 1.5: Force-length and force-velocity relationships.
Force-length relationship of muscle represents an isometric contraction of a muscle fiber where contraction velocity is held constant. Active force production is maximal at optimal fiber length (LM = 1), and force production tapers off as muscle fiber strays in either direction from the
25 The lumped parameters in the Hill-type muscle model (pennation angle, maximum
isometric force, optimal fiber length and tendon slack length) can be adjusted to represent specific muscles. Pennation angle is the angle between the muscle fibers and the tendon and alters how much force is transmitted to the line of action of the muscle. Maximum isometric force is the maximum force the muscle is capable of producing at its optimal fiber length and is related to the physiological cross-sectional area of muscle through specific tension of muscle. In musculoskeletal modeling, specific tension of muscle of 50.8 N/cm2 is typically used for upper limb muscles (Saul et al., 2015). Optimal fiber length is the length where muscle can produce its’ peak force. Tendon slack length is the length at which the tendon must be stretched to before it can produce force. In the upper extremity model that we will employ, these parameters have been defined for each muscle and muscle compartment to represent a 50th percentile male (Holzbaur et al., 2005; Saul et al., 2015). Maximum isometric force can be altered to represent individual’s strength profiles.
Modeling Glenohumeral Stability
Upper limb musculoskeletal models typically model the glenohumeral joint as an ideal ball-and-socket joint, ignoring translations of the humeral head within the glenoid concavity (Chadwick et al., 2009; Dickerson et al., 2007; Holzbaur et al., 2005). Quental et al. (2016) developed a 6 degree of freedom model of the glenohumeral joint and compared to an ideal ball-and-socket joint with a concavity compression-based stability constraint (Quental et al., 2015). Their study concluded that the ideal ball-and-socket was an appropriate model for the
26 constraints into dynamic simulations can improve calculation of muscle activations by forcing the model to account for active stabilization of the joint that occurs in-vivo. Stability constraints at the glenohumeral joint have been modeled using both mechanisms of active glenohumeral stability, i.e. scapulohumeral balance and concavity compression (Chadwick et al., 2009;
Dickerson et al., 2007; van der Helm, 1994a). These stability criteria constrain the resultant joint reaction force at the glenoid, thereby guaranteeing that the humerus would not theoretically dislocate.
The Delft Shoulder and Elbow Model (DSEM) (Chadwick et al., 2009) uses a
scapulohumeral balance type stability criteria requiring that the resultant force remains within the curvature of the glenoid. The glenoid concavity is modeled as an ellipse and stability is defined according to the following equation
𝐺𝐻𝑠𝑡𝑎𝑏 = (𝜃 𝜃𝑎)
2
+ (𝜑 𝜑𝑎)
2
where 𝜃 and 𝜑 are the angles of the joint reaction force away from the normal of the glenoid along the major and minor axis of the ellipse and 𝜃𝑎 and 𝜑𝑎 are the angles of that vector as it
27 degrees of rotator cuff tears to determine how different tear types influence glenohumeral
stability (Steenbrink et al., 2009; van Drongelen et al., 2013).
On the other hand, concavity compression has been incorporated in the models by
Dickerson et al. (2007) and Blache et al. (2017) which employ multi-directional dislocation force thresholds from cadaveric studies to constrain the resultant joint reaction. The stability
dislocation force thresholds were calculated in eight directions around the glenoid by
determining the amount of transverse force required to dislocate the humeral head when a fixed compressive force was applied (Lippitt and Matsen, 1993). Dickerson et al (2007) evaluated the effect of this constraint by scaling the reported dislocation thresholds by factors ranging from 0.4 to 1.0 and found that more restrictive constraints resulted in increased muscular force. In a sensitivity analysis of this model, Chopp-Hurley et al. (2014) concluded that predicted rotator cuff muscle forces were more sensitive to origin-insertion locations of the rotator cuff muscles than these glenohumeral stability thresholds. However, the inferior stability threshold influenced predicted rotator cuff forces when the model was abducted, and an internal or external rotation force was applied at the hand. The concavity compression constraint has also been evaluated in a different model during a lifting task (Blache et al., 2017). Blache et al (2017) ran static
28 predicted muscle forces for primary movers correlated well with experimental data while
predicted muscle forces for secondary muscles were less accurate (Dickerson et al., 2008). Direct comparison of both styles of glenohumeral stability constraint against experimental data could provide valuable insight into modeling glenohumeral stability.
Computed Muscle Control
Computed muscle control (CMC) is a previously developed algorithm to determine muscle activations while tracking experimental kinematic (Thelen et al., 2003). In this algorithm, CMC considers time dependent properties of muscle force generation (Figure 6).
Figure 1.6: Computed Muscle Control Algorithm.
29 Muscles are not capable of producing force instantaneously, and time delays exist
between converting neural excitations to muscle activations. The relationship between muscle excitation and muscle activation is modeled through the following first order differential equation (Zajac, 1989).
𝑑𝑎(𝑡) 𝑑𝑡 + [
1 𝜏𝑎𝑐𝑡∗ (
𝜏𝑎𝑐𝑡
𝜏𝑑𝑒𝑎𝑐𝑡+ [1 −
𝜏𝑎𝑐𝑡
𝜏𝑑𝑒𝑎𝑐𝑡] ∗ 𝑢(𝑡))] ∗ 𝑎(𝑡) =
1
𝜏𝑎𝑐𝑡∗ 𝑢(𝑡)
Where a(t) is activation, u(t) is excitation, and 𝜏𝑎𝑐𝑡 represents physiological activation time
delays, and 𝜏𝑑𝑒𝑎𝑐𝑡 represents physiological deactivation time delays.
CMC incorporates a static optimization with feedforward and feedback algorithms to determine required muscle activations while tracking kinematics. Unlike a static optimization which optimizes muscle activation at a singular time point, CMC takes into account muscle activation dynamics by including feedforward and feedback components. CMC first calculates desired joint accelerations that when achieved drive the model to track the experimental joint kinematics through the following error dynamics equation:
𝑞𝑑𝑒𝑠′′ = 𝑞
𝑒𝑥𝑝′′ + 𝑘𝑣(𝑞𝑒𝑥𝑝′ − 𝑞′) + 𝑘𝑝(𝑞𝑒𝑥𝑝− 𝑞)
Where 𝑞𝑑𝑒𝑠′′ is the desired acceleration, 𝑞
𝑒𝑥𝑝′′ is the experimental acceleration, 𝑞′and q are the
model’s coordinates’ velocities and positions respectively, 𝑞𝑒𝑥𝑝′ and 𝑞𝑒𝑥𝑝 are the experimental
coordinate velocities and positions, and 𝑘𝑣 and 𝑘𝑝are critically damped feedback gains. The next
step in CMC, is to perform a static optimization that computes muscle activations that will achieve the desired accelerations. The optimization is static in that the optimization criterion is dependent only on the current time instant. The default static optimization criterion for CMC is
∑ 𝑥𝑖2+ ∑(𝑞
𝑑𝑒𝑠′′ − 𝑞′′)2 𝑚
𝑗=1 𝑛
30 Where 𝑥𝑖 represents the forces of the actuators and 𝑞𝑑𝑒𝑠′′ − 𝑞′′ represents error between the
model’s acceleration and the desired acceleration for each tracked joint. This criterion can be
altered to incorporate additional criteria such as a stability constraint for the glenohumeral joint. The final step in CMC is to use the computed controls to drive a forward dynamic simulation, advancing forward in time by a small timestep. Typically, 0.01 seconds is used such that the time step is still small, but long enough for activation dynamics to change force production in the muscle models. These steps are repeated until time advances to the end of the desired movement.
CMC has been shown to generate required muscle activations to track input kinematics within 1º of experimental kinematics (Thelen et al., 2003; Thelen and Anderson, 2006). CMC has been validated against experimental kinematics and EMG recordings for cycling, walking, and forward reaching (Saul et al., 2015; Thelen et al., 2003; Thelen and Anderson, 2006).
Specific Aims
Appropriate workplace design is critical to maximizing productivity and minimizing work-related musculoskeletal disorders. Since most modern industrial workspaces are
characterized by predominantly light repetitive work (Das and Sengupta, 1996), there is a need to understand biomechanical demands during submaximal work. Among manual work tasks, push-pull tasks in particular have been shown to be significantly related to shoulder complaints
(Hoozemans et al., 2002). In order to effectively design workplaces for these tasks, knowledge of the demands placed on muscles and joints is needed. While much is known on mechanical
31 cart pushing, isometric tasks, and strength. Loading under these conditions cannot be directly applied to isolated arm dynamic submaximal push-pull tasks since EMG and force exertion under dynamic conditions can be much different from those recorded isometrically (Antony and Keir, 2010; Kumar, 1995), and foot placement influences pushing force (Rancourt and Hogan, 2001). Therefore, the objective of this research is to quantify mechanical loading of muscles and joints during dynamic push-pull tasks. This objective will be accomplished through the following specific aims:
Specific Aim 1: Determine the effect of task and task target on muscle activation during dynamic push-pull tasks. Task target has been shown to influence muscle demand during lifting (Blache et al., 2015) and isometric push-pull tasks (McDonald et al., 2012). Knowledge of muscle loading under dynamic push-pull tasks is needed to develop a more complete
understanding of workspace design for preventing fatigue and injury. Methods: We will collect EMG data of healthy young subjects performing unimanual and bimanual dynamic push-pull tasks in the sagittal and horizontal planes. Hypothesis 1: (i) Superior and lateral task locations will increase muscle activation levels. (ii) Task type will influence muscle activation levels.
32 calculate joint reaction forces at the shoulder during push-pull tasks across the workspace.
Hypothesis 2: (i) Task target will influence the ratio of translational and compressive forces acting at the shoulder. (ii) Pushing will result in less stable joint reactions than pulling.
33 CHAPTER 2
Spatial Dependency of Shoulder Muscle Demand during Dynamic Unimanual and Bimanual Pushing and Pulling (In review for Applied Ergonomics)
Daniel C. McFarland, Michael N. Poppo, Emily M. McCain, and Dr. Katherine R. Saul
Abstract
Work involving extensive pushing and pulling is associated with higher frequency of shoulder complaints. While reports of shoulder muscle demand during submaximal isometric tasks are abundant, dynamic submaximal push-pull exertions are not well understood. We
evaluated how muscle demand (weighted EMG average) of surface glenohumeral muscles varies with task type and target. Seventeen healthy young adults performed seated unimanual and bimanual pushes and pulls to 3 thoracohumeral elevations (20º, 90º, 170º) and 4 elevation planes (0º, 45º, 90º, 135º) with loading at 15% of isometric push-pull capacity. Pulling required less demand than pushing (p<0.0001). Muscle demand varied more with elevation than elevation plane. The lowest target had highest demand for pulling (p<0.01), and the most elevated target had highest demand for pushing (p<0.0001). Working above the shoulder is known to increase demand during isometric tasks, however, these results suggest that for dynamic tasks working against gravity has a larger effect on demand than task target.
Introduction
Work-related musculoskeletal disorders (MSD) place a large burden on the economy and workers’ health, with MSD accounting for 29-35% of all occupational injuries and illnesses
34 disorders, with active duty non-deployed service members having an injury rate of 62.8% per person-years (Hauret et al., 2010). Annual total cost from work-related MSD in the United States ranges between $45 and $54 billion (National Academy of Science, 2001). Shoulder injuries, in particular, are taxing on worker health and the economy. A study of worker
compensation claims found that 30.6% of claims involving the shoulder resulted in over seven days of lost work and that shoulder claims resulted in the second highest total cost behind lumbar spine claims (Dunning et al., 2010).
Ergonomics research has identified push-pull tasks as related to shoulder complaints (Hoozemans et al., 2002). Since Hoozemans et al. (1998) identified a lack of knowledge
regarding the biomechanical demands placed on shoulder muscles and joints as a result of these exertions, numerous efforts have been made to characterize such tasks. Much of the push-pull literature considers how various conditions including exertion direction and task location influence strength capacity (Calé-Benzoor et al., 2016; Chaffin et al., 1983; Chow and
35 and the resulting spatial dependency (McDonald et al., 2014; McDonald et al., 2012; Meszaros et al., 2018; Nadon et al., 2016). All these studies, however, evaluated isometric tasks and the results may not be directly applicable to dynamic exertions since EMG and force exertion under dynamic conditions frequently differ (Antony and Keir, 2010; Kumar, 1995). There has been some effort to characterize muscular loading during dynamic tasks (Bennett et al., 2011; Kao et al., 2015; Lin et al., 2010), but these studies involve full-body cart pushing and may not be applicable to seated or stationary dynamics tasks, such as work on an assembly line or opening and closing hatches on military equipment, since foot placement is known to influence push-pull capacity (Rancourt and Hogan, 2001).
36 tasks. This research aims to expand understanding of how task design contributes to overuse injuries, thereby enabling the development of preventive measures to reduce risk of shoulder MSD and lower the associated economic burden.
Methods
Experimental Protocol
Seventeen healthy young adults (8 males/9 females) between the ages of 20 and 32 years participated in this study. A power analysis (power: 0.8, α=0.05) was used to estimate the number of required subjects. Effect size for the power analysis was informed by previously reported weighted demand results for upward exertions (Nadon et al., 2016). Required subjects ranged from 9 to 22 depending on how conservative an estimate of effect size was used. The participants were recruited from the local community using the following inclusion criteria: 1) no history of injury or pathology of the upper limb, 2) no neuromuscular impairments, and 3) no physical impediments to performing the required physical exertions. Fifteen of the subjects were right-dominant, and two were left-dominant. Hand dominance was self-reported by subjects, and their dominant hand was used for all unimanual tasks. All subjects provided written informed consent in accordance with North Carolina State University Institutional Review Board. Each subject completed the testing protocol in a single session on a single day.
37 made at 2000 Hz using 1-cm Ag/AgCl dual electrodes with 16-channel capacity (Noraxon
Telemyo DTS system, Noraxon, Scottsdale, AZ) (input impedance >100Mohm, CMRR>100dB, gain 500).
Subjects performed a series of isometric joint moments on a Biodex System 4 Quick Set (Biodex, Shirley, NY), and EMG data collected during these trials was used in subsequent EMG normalization. Maximum isometric joint moments of shoulder abduction and elbow flexion for the dominant hand were collected following a previously described standard protocol (Holzbaur, Delp et al., 2007). Subjects were seated with their torso restrained in a vertical posture with straps to prevent changes in posture during the trials. At the shoulder, maximum isometric abduction moment was assessed with the shoulder abducted to 60ºand the elbow braced in full extension. At the elbow, maximum isometric flexion moment was assessed with the shoulder in neutral abduction and the elbow flexed to 90º. Three trials of each moment were obtained, and participants received standardized verbal and visual feedback to encourage MVC. To minimize the effects of fatigue, 60 seconds of rest was provided in between trials.
38 used to determine loading for the testing protocol. Studies of sustained isometric, continuous dynamic, and intermittent isometric contractions have reported fatigue thresholds ranging from 7-25% maximum isometric strength (Bjorksten and Jonsson, 1977; Hagberg, 1981; Rohmert, 1973), with intermittent contractions associated with higher thresholds. Therefore, loading was set at 15% of the maximal push-pull force in the tested baseline posture to avoid participant fatigue. This load was applied as a set weight to a pulley system that allowed resistance for each task to be explicitly controlled. This load did not change between task targets or task type (unimanual or bimanual pushing and pulling) in the testing protocol.
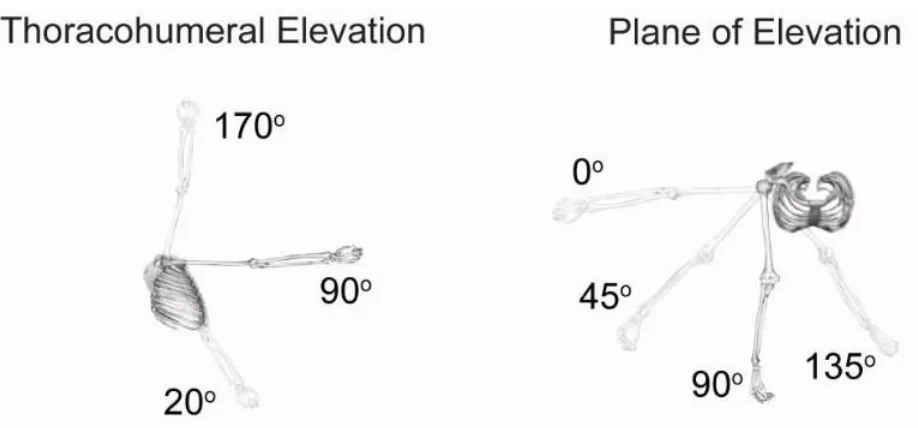
A series of unimanual and bimanual push and pull tasks were performed by subjects. Tasks were performed to a combination of 3 thoracohumeral elevation angles (20º, 90º, 170º) and 4 planes of elevation (0º/abduction, 45º, 90º/flexion, and 135º) as defined by the International Society of Biomechanics (Wu et al., 2005) for a total of 12 task targets (Figure 2.1). These task targets represent the angle of the dominant arm at the end of the push task and start of the pull task. Subjects performed both unimanual and bimanual pushes and pulls at each task target for a total for 48 unique tasks. Three repetitions of each unique task were performed for a total of 144 exertions per subject. To prevent fatigue, participants were provided with a rest period of one minute between each task. For each task, all three repetitions were performed consecutively without a rest period. The order of tasks was randomized to avoid any ordering effects.
Participants performed tasks in a seated position (chair height: 0.53m) with their torso
restrained by straps to standardize incline across participants. Tasks were performed on a custom pulley resistance system (Figure 2.2) to reduce variability in the direction of applied force
39 allows for height adjustments and locks at 3 angles to achieve the thoracohumeral elevation angle targets (Powertec Strength, Powertec Fitness, Long Beach, CA). Plane of elevation angle selection was achieved by rotating the seat. For pulling, participants held a fixed-length handle in the dominant hand (unimanual tasks) or both hands (bimanual tasks). The handle was mounted on a carriage that slides along a linear track. Handle orientation was perpendicular to the linear track. Hand trajectory was controlled by the linear tack, but other joint angles were not
controlled to encourage natural movement choices. For pulling, subjects began with the handle away from the body along the desired trajectory at approximately 80% of full limb length
(Figure 2.2A) and pulled until the humerus was in a neutral posture (Figure 2.2B), approximately 0º thoracohumeral elevation. Pushing tasks were accomplished in a similar manner. Subjects received instructions on desired timing, approximately 1 sec (60bmp) although task speed was not explicitly controlled with a metronome to prevent jerky movement. Trials that deviated noticeably from these instructions were repeated.
40 Figure 2.1: Task targets.
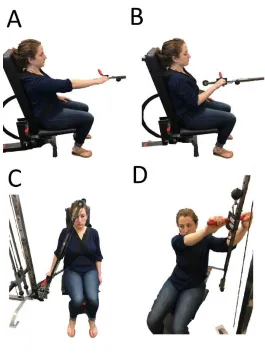
41 Figure 2.2: Custom pulley resistance system.
Subjects performed push-pull tasks on a custom device designed to reduce variability in force applied between participants and trials. The custom device has a resistance pulley system employing a linear track that allows for height adjustments and locks at the 3 angles to achieve the thoracohumeral elevation targets. Planes of elevation selection were achieved by rotating the seat. The start (A) and stop (B) for a pull task at the baseline target (90º thoracohumeral
42
Data Analysis
To evaluate subject fatigue at the end of the testing protocol, median frequency analysis of biceps brachii and triceps brachii was conducted on EMG data from the isometric elbow flexion joint moment and the fatigue test (Potvin and Bent, 1997). Median frequency was chosen over mean frequency because it is less susceptible to noise (Hof, 1991). Raw EMG data was post-processed for evaluation by removing DC offset, bandpass filtering with cutoff frequencies of 30 and 300 Hz to remove signal noise (Shair et al., 2017) and dividing data into
non-overlapping epochs of 0.5 seconds (Hawkes et al., 2015). Median frequency was calculated for each epoch excluding the first and last 2.5 seconds. For the isometric elbow flexion joint moment (rested condition), average median frequency for the trial was calculated. For the fatigue trial, a linear regression of the changes in median frequency over the time course of the fatigue trial was performed to calculate slope and intercept (Hawkes et al., 2015). Initial and final median
frequency for the fatigue trial were calculated from the linear regression. A one-way ANOVA (α<0.05) and Tukey’s honest significant difference post-hoc test were performed to analyze
changes in median frequency, since decrease in median frequency is an indicator of localized muscle fatigue (Cifrek et al., 2009; Shair et al., 2017).
43 Muscle demand of the superficial glenohumeral muscles evaluated was calculated for each task as an average of each participant’s weighted total of normalized EMG output (Nadon
et al., 2016). Physiological cross-sectional areas (PCSAs) were used to determine weightings for EMG signals. Deltoid, bicep brachii, triceps, latissimus dorsi, and pectoralis major PCSA were as reported by Holzbaur et al. (2007), and the deltoid weighting was divided into anterior, middle and posterior components using PCSA fraction from Langenderfer et al. (2004).
∑ 𝑁𝑜𝑟𝑚_𝐸𝑀𝐺𝑖[ 𝑃𝐶𝑆𝐴𝑖
∑7𝑖=1𝑃𝐶𝑆𝐴𝑖]
7
𝑖=1 .
Statistical Analysis
Differences in peak muscle demand were analyzed across thoracohumeral elevation angles, plane of elevation angles, and task type (unimanual and bimanual pushing and pulling) using a three-way ANCOVA (α<0.05) with sex as a covariate. When interactions were not present, they were removed from the model and a Tukey’s honest significant difference post-hoc test was used to analyze results. If an interaction was present, simple main effect test was
performed at each factor level using a Bonferroni correction to adjust the α.
Results
Fatigue
Average rested median frequency was 69.38±10.81 Hz and 61.25±6.18 Hz for biceps brachii and triceps brachii respectively. Average median frequency at the start of the fatigue trial was 66.74±9.19 Hz and 62.75±5.37 Hz for biceps brachii and triceps brachii respectively.
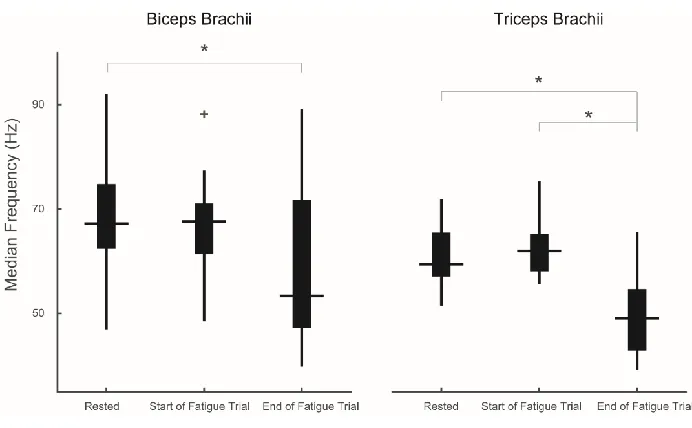
44 respectively. For biceps brachii, time of measurement influenced median frequency (p=0.0173). Rested condition and final median frequencies were significantly different from each other (p=0.0171), but rested and start of the fatigue trial were not (p=0.7593) (Figure 2.3). Start of the fatigue trial and final median frequency were also not significantly different (p=0.0928). For triceps brachii, time of measurement influenced median frequency (p<0.0001). Rested condition and the start of the fatigue trial were not significantly different from each other (p=0.7488), but the final median frequency was significantly different from both rested (p<0.0001) and start of fatigue trial conditions (p<0.0001) (Figure 2.3).
Figure 2.3: Fatigue analysis.
45
Muscle Demand
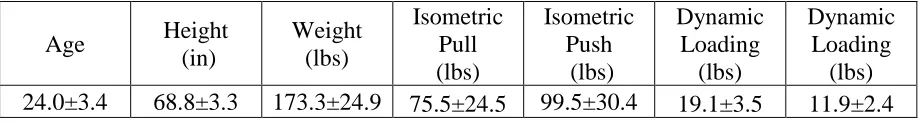
Isometric push strength was greater than isometric pull strength (Table 1). This was true for all subjects; therefore, the constant task loading was higher than 15% of subjects’ isometric pull capacity, but exactly 15% of their push capacity. Demand during the isometric pull trial was 0.41 whereas demand during the isometric push trial was 0.55. Task duration for a subset of the trials was evaluated to confirm that subjects performed the trials at similar speeds. Task duration for this subset of task was 0.96 ± 0.3 seconds. During the testing protocol, one subject was unable to complete the push trial at the 170º thoracohumeral elevation/135º plane of elevation target. For another subject, the pull trial at the 170º thoracohumeral elevation/135º plane of elevation target was not collected successfully and had to be removed.
All factors were present as main effects (p<0.0001) for thoracohumeral elevation and task type, (p=0.0148) for plane of elevation. Post hoc analysis of the main effect for plane of
elevation revealed that only the 0º and 45ºtarget were significantly different from each other, with the most lateral 0ºtarget being more demanding (Figure 2.4), although difference in demand between these targets was only 0.03. The only interaction present was between task type and thoracohumeral elevation angle (p<0.0001); therefore, the interaction rather than the main effects for these factors were analyzed with a simple main effects tests at each level of the interaction.
Table 2.1: Subject push-pull strength capacity and demographic information.
46 For pulling, elevation targets below the shoulder were most demanding, but for pushing, elevation above the shoulder was most demanding. When pulling, the 20º elevation target was more demanding than other targets (p<0.0001) (Figure 2.5). Moving the task target to a low elevation from baseline 90º elevation resulted in an average increase in demand of 111% and 103% for unimanual and bimanual pulling, respectively (0.22 and 0.13 increase in weighted demand, respectively). When pushing, the 170º elevation target required the most demand (p<0.0001) (Figure 2.5). Moving the task target to a high elevation from baseline 90º elevation resulted in 45% and 51% average increase in demand for unimanual and bimanual pushing, respectively (0.16 and 0.13 increase in weighted demand, respectively). Additionally, for
bimanual pushing, the 90º target was more demanding than the 20ºtarget(p=0.0014).Moving the task target to a low elevation from baseline 90º elevation for bimanual pushing resulted in an average 21% reduction in demand (0.06 reduction in weighted demand).
Figure 2.4: Main effect of plane of elevation.
47 Figure 2.5: Task type by thoracohumeral elevation interaction.
49 Discussion
Fatigue
Fatigue analyses suggest that the task evaluations were not affected by muscle fatigue. Neither biceps nor triceps median frequency were significantly different between the rested condition at the start of the assessment and start of the fatigue protocol following assessment. This supports the claim that subjects were not fatigued at the end of the testing protocol, since localized muscle fatigue is associated with a shift in median frequency to lower values (Cifrek et al., 2009; Shair et al., 2017). Potvin and Bent (1997) reported similar rested mean frequencies for biceps brachii of 72.6±8.4 Hz compared with this study’s rested and start of fatigue trial median frequencies of 69.38±10.81 Hz and 66.74±9.19 Hz respectively. Mean frequencies are always slightly higher than median frequencies because of the skewed shape of the EMG power
spectrum (Knaflitz et al., 1990). In addition, the fatigue analysis suggests we were able to induce and detect fatigue in our participants during the fatigue trial, as evidenced by the shift to a lower median frequency from the rested condition to the final condition for both biceps and triceps. In addition, Potvin and Bent (1997) reported fatigued mean frequencies for bicep brachii of
53.0±9.9 Hz similar to this study’s final median frequency of 58.77±14.00 Hz.
Muscle Demand
50 pulling from the lowest thoracohumeral elevation target increased muscular demand. Demand during both of these exertions neared the respective push-pull demand of the maximal isometric capacity trials suggesting certain task target and task type interactions for low load dynamic tasks can be as demanding as maximal isometric exertions. Furthermore, pushing was more
demanding than pulling at all elevation angles except the low target, suggesting that exertion direction with respect to gravity plays a larger role in determining demand than task target or task, i.e. pushing or pulling, alone. Working against gravity to elevate the handle during the pull from the lowest target and the push to the highest target likely makes these tasks more
demanding. Prior work with isometric force exertions suggest that, in general, more elevated tasks increase muscular demand (McDonald et al., 2014; McDonald et al., 2012; Meszaros et al., 2018; Nadon et al., 2016), although task direction plays an integral role in determining spatial dependency. Contextualizing our results against the spatial dependency for a given exertion in these studies is somewhat difficult as their exertion directions are defined relative to a fixed axis and our exertions are defined relative to the torso. Of these isometric studies, Meszaros et al. (2018), however, directly evaluated the effect of task direction, reporting that downward exertions were the least demanding over a range of task targets whereas upward exertions were the most demanding. Despite differences in task definition, our current study agrees with this isometric study that working against gravity increases demand. The results from the current dynamic study are also consistent with isometric strength data that has found inferiorly directed force to be the strongest for both males and females (Chow and Dickerson, 2009; La Delfa et al., 2014; La Delfa and Potvin, 2016). While it is well documented that maintaining elevated
51 dependent on exertion direction with respect to gravity than actual location of the task target or task type alone. With this in mind, workspaces involving dynamic tasks can be designed to make better use of the whole reachable workspace without compromising safety conditions for
52 our exertions in the current study were in this direction and may contribute to why there was limited effect of elevation plane. One explanation for why the 0º target required slightly more demand than the 45º target is that subjects have reduced stability from the backrest of the chair for this test target. These results highlight that task definition needs to be considered before generalizing results to workspace design for a specific task.
Pushing, in general, resulted in higher demand than pulling except for the low
thoracohumeral elevation target. Even at the neutral elevation angle 90ºin which motion with respect to gravity was not in play, pulling required 47% and 54% lower demand compared to pushing for unimanual and bimanual tasks respectively. This is true even though pulling tasks occurred at a higher percentage of isometric capacity because the resistance was defined based on 15% max push-pull exertion (which for these participants was always a push exertion; Table 1). Two primary factors explain this result. First, differences in dynamic strength capacity