Report No. 362
ROLE OF SEDIMENT PROCESSES IN CONTROLLING WATER QUALITY IN THE CAPE FEAR RIVER
By
P. V. Sundareshwar and Curtis J. Richardson Duke University Wetland Center
Nicholas School of the Environment and Earth Sciences Duke University
Durham, North Carolina
UNC-WRRI-362
ROLE OF SEDIMENT PROCESSES IN CONTROLLING WATER QUALITY IN THE CAPE FEAR RIVER
P. V. Sundareshwar and Curtis J. Richardson Duke University Wetland Center
Nicholas School of the Environment and Earth Sciences Duke University
Durham, North Carolina
The research on which this report is based was supported by funds from the U.S.
Department of the Interior, U.S. Geological Survey, Grant Agreement No. 01HQGR0096 and the Water Resources Research Institute of The University of North Carolina.
The views and conclusions contained in this document are those of the authors and should not be interpreted as necessarily representing the official policies, either expressed or implied, of the U.S. Government, the Water Resources Research Institute of The University of North Carolina, or the State of North Carolina.
This report fulfills the requirements for a project completion report of the Water
Resources Research Institute of The University of North Carolina. The authors are solely responsible for the content and completeness of the report.
WRRI Project No. 70191
ACKNOWLEDGMENTS
We would like to thank UNC Water Resources Research Institute and the U.S. Geological Survey for funding this study. This study could not have been completed without the support of the staff of US Army Corps of Engineers. We also wish to thank the lock-masters and the support staff of the three lock and dam structures on the Cape Fear River. We are especially grateful for the enthusiastic support of Mr. Robin Hall, Mr. Buddy Ray and Mr. Phil Edge.
Several field and laboratory technicians helped with sample collection and analysis. Mr. Paul Hiene, Ms. Julie Rice and Mr. Wes Willis contributed immensely to the successful completion of this report. We are grateful for his time and effort.
ABSTRACT
Sediment loading and sediment processes were evaluated for their role in regulating water quality conditions at three lock and dam (LD) structures on the Cape Fear River (CFR) in fall of 2001. In comparison to the upstream site LD 3, surface waters at
downstream sites LD 2 and LD 1 generally had higher concentration of dissolved reactive phosphorus during the May to December 2001 study period. 137Cs dating of sediment cores from the floodplains at the three LD locations reveal that the sedimentation rates vary from 0.5 cm/yr at LD 3 to 1.5 cm/yr and 1.3 cm/yr at LD 2 and LD 1, respectively. The sedimentation rates correspond well to the total sediment phosphorus concentrations, indicating that sediment deposition during the recent decades (≈ 40 years) has caused an increase in nutrient loading to the CFR. The floodplain sediments at LD 2 had the greatest phosphorus binding capacity, while the most downstream site, LD 1, had the lowest. However, the intra-site variability in phosphorus sorption capacity and mineral element composition increases downstream, most likely in response to differential sorting of the riverine sediment. 31P Nuclear Magnetic Resonance (NMR) analyses of
concentrated river water and floodplain sediments reveal that phosphorus loading in this river occurs in diverse chemical forms. Although the surface water concentration of these forms of phosphorus may be very low, over time the phosphorus binding properties of the deposited sediments may concentrate these forms of phosphorus in the floodplain of the CFR. Importantly, increasing variability downstream in the mineral element composition and the P-binding capacity of riverbank sediments suggests that moving seaward,
TABLE OF CONTENTS
ACKNOWLEDGMENTS ... ii
ABSTRACT... iii
LIST OF FIGURES ... v
LIST OF TABLES... vi
SUMMARY AND CONCLUSIONS ... vii
RECOMMENDATIONS... ix
INTRODUCTION ... 1
Problem Statement ... 1
Goals and Objectives ... 2
MATERIALS AND METHODS... 3
Study Area ... 3
Surface water monitoring... 3
Pyrophosphate analysis in water samples ... 5
Sediment sampling and analyses ... 5
137Cs dating on sediment cores ... 5
Sediment Nutrients and Mineral element analysis... 5
Sediment Characterization ... 6
Nutrient buffering capacity of sediments... 6
31P NMR Studies... 6
Estimation of current Land-use patterns... 6
RESULTS AND DISCUSSION ... 9
Phosphorus in surface waters:... 9
Sedimentation rates and phosphorus accumulation ... 12
Phosphorus binding capacity of floodplain sediments... 17
31P NMR analyses of sediments and surface waters... 21
Landscape ... 24
CONCLUSIONS... 29
REFERENCES ... 31
LIST OF FIGURES
Figure 1 A map showing the location of the three lock and dam structures on the Cape Fear River (CFR) and approximate sampling locations for surface water quality parameters ... 4
Figure 2 Concentrations of a) dissolved reactive phosphorus (DRP), b) unfiltered total phosphorus (UTP), c) organic phosphorus, and d) particulate phosphorus concentrations (μg/L) in surface water at the three lock and dam (LD) sites... 10
Figure 3 Down-core 137Cs profiles at two locations at LD 1... 13
Figure 4 Down-core variation in total phosphorus for sediment cores collected from floodplain sediments of the three lock and dam structures on the
Cape Fear River ... 14
Figure 5 Total phosphorus accumulation at the three lock and dam structures on the CFR basin since 1964 ... 16
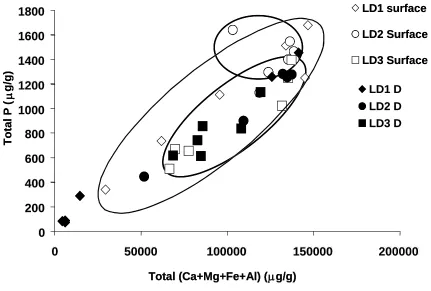
Figure 6 Relationship between sedimentary TP concentrations and the sum of Al, Fe, Ca and Mg. Note that the relationship is linear for all sites and
depths except for LD 2 surface sediments ... 18
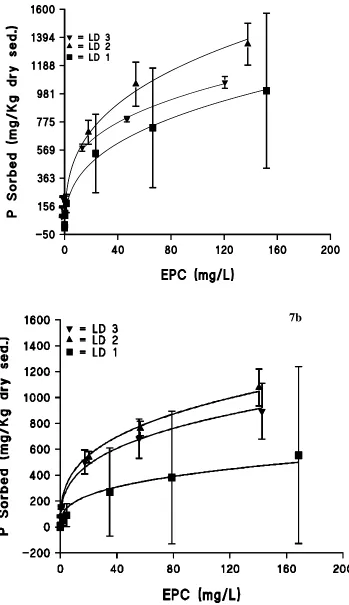
Figure 7 Phosphorus sorption isolpleths of floodplain sediments from the lock and dam sites; a) Surface sediments (0 – 10 cm depth) and b) sub-surface
(10 – 20 cm depth) sediments ... 19
Figure 8 31P solution NMR spectra of sediment extracts. a) LD 3, b) LD 2 and
c) LD 1 ... 22
Figure 9 31P NMR spectra of surface water from the most upstream site LD 3
that was concentrated 140-fold ... 26
Figure 10 31P solution NMR spectra for sediments from areas under varying land use; a) a natural bay forest, b) a bay forest converted to agriculture, and
c) a restored wetland after 5 growing seasons ... 27
Figure 11 ARC info and GIS based relative land-use patterns within the sub- watersheds (estimated on a hydrologic unit basis) of the three
LIST OF TABLES
Table 1 Mean concentrations (± 1 SD), by depth, of mineral elements in cores
from lock and dam sites on the Cape Fear River ... 17
SUMMARY AND CONCLUSIONS
The primary objectives of this pilot study were: a) to identify the chemical forms in which nutrients are input into the Cape Fear River basin, and b) to address the previously overlooked role of sediments in buffering water quality in order to facilitate its
incorporation in future water quality management programs. These objectives were achieved with a focus on Phosphorus (P) fractions. We monitored surface water quality parameters for eight months to evaluate present water quality at three lock and dam sites. Water samples collected from above the dams at the three locations were analyzed for dissolved phosphorus, total phosphorus, dissolved organic carbon concentrations and mineral elements such as Ca, Mg, K, Fe and Al. To estimate historical nutrient loading, we collected sediment cores from mudflats along the bank of the Cape Fear River at the three lock and dam sites. Sedimentation rates were estimated using 137Cs dating, and these data were related to total phosphorus mineral element concentrations in
corresponding depth fractions. Patterns in total phosphorus accumulation and sediment mineral element composition were then related to land-use practices within the sub-watersheds of the three lock and dam sites. We used the phosphorus-binding capacity of floodplain sediments to assess their role as a sink or source of nutrients under sustained nutrient loading. To identify the chemical forms in which nutrients are input into the CFR basin we used solution 31P NMR spectrometry of floodplain sediments and concentrated river water samples.
Our results indicate that there are differences in water quality parameters among the three lock and dam (LD) structures. In comparison to the upstream site, LD 3, downstream sites LD 2 and LD 1 generally had higher concentration of nutrient parameters such as dissolved reactive phosphorus (DRP) and total phosphorus (TP) in surface waters. However, the relative contributions of organic and particulate fractions of phosphorus were generally higher at LD 3 than those measured at downstream sites LD 2 and LD 1. While trends in DRP concentrations may partly be due to the difference in the number of permitted discharge locations just upstream of these sites, accumulation of phosphorus in the riverbank sediments is most likely controlled by sediment loading from the sub-watersheds and in situ sediment processes. Results from our previous study indicate that the sedimentation rates vary from 0.5 cm/yr at LD 3 to 1.5 cm/yr and 1.3 cm/yr at LD 2 and LD 1, respectively. The sedimentation rates correspond well to the total sediment phosphorus concentrations, which indicate that sediment deposition during the recent decades (≈ 40 years) has been associated with an increase in phosphorus loading to the CFR at LD 3. The present study reveals that the total phosphorus in sediments at these sites, in general, was positively correlated with the sum of total Fe, Al, Ca and Mg. This positive relationship was observed for surface and sub-surface sediments at all sites except in surface sediments at LD 2. At this site, while sub-surface sediments exhibited a positive relationship, the surface sediments did not. This suggests that recent input of phosphorus and mineral elements from external sources may have altered this
lower than the binding capacity of corresponding surface sediments. Importantly, the intra-site variability in P-sorption capacity and mineral element composition increases downstream, most likely due to hydraulic sorting of the riverine sediment load. Despite the higher sorption capacity of LD 2 sediments, the surface water concentrations of dissolved phosphorus were highest at this site.
31P Nuclear Magnetic Resonance (NMR) analyses of concentrated river water and floodplain sediments reveal that phosphorus loading in this river occurs in diverse chemical forms. NMR analyses of riverbank sediments reveal the presence of P-forms such as Glyphosate (a commonly used weedkiller), Aminomethylphosphonic Acid (a degradation product of Glyphosate) and pyrophosphate (the smallest chemical form of polyphosphate with wide industrial applications), in addition to more commonly observed P-forms. The concentration of pyrophosphate in surface waters was below detection; however, 31P NMR analysis of surface water that was concentrated 140-fold showed a peak that corresponded to pyrophosphate. Although the surface water
concentration of these forms of phosphorus may be very low, over time the phosphorus binding properties of the deposited sediments may concentrate these forms of phosphorus in the floodplain of the CFR.
Our NMR analyses of sediment samples from the areas under varying landuse within the Barra Farms site demonstrates that converting natural wetlands to agricultural land results in the loss of natural ‘diversity’ in the chemical forms of phosphorus – analogous to the loss of ‘biodiversity’ in impacted ecosystems. Results from the restored site indicate that restoration of impacted sites may result in re-establishment of the lost diversity in
chemical speciation of nutrients. This also provides a valuable tool to track the progress of a restored site relative to a corresponding undisturbed and natural wetland.
The diversity in the chemical forms of phosphorus in the riverbank sediments helps identify the types and sources of nutrient loading in the CFR. It is conceivable that, after a few years of sustained nutrient loading (e.g. phosphorus), floodplain sediments of the Cape Fear River system will eventually become saturated with nutrients and thus will be unable to ameliorate nutrient-driven surface water quality degradation. Importantly, increasing variability downstream in the mineral element composition and the P-binding capacity of riverbank sediments suggests that moving seaward, sediment sorting will lead to creation of ‘hot spots’ for efficient P-sorption and release along the riverbank of the CFR, and this could pose a considerable challenge with regard to water quality
management. This implies that sources for sediment load to the CFR need to be
identified and effective BMPs implemented to restrict the sediment loading in the upper reaches of the watershed. These findings have important implications for water quality management in this largest river system in North Carolina.
RECOMMENDATIONS
Our pilot study has provided a first cut at understanding the chemical forms in which phosphorus occurs in the Cape Fear River. We also show here that changes in mineral composition of the floodplain sediment varies among the three LD locations in the middle Cape Fear River Basin. It is clear from our data that sediment and nutrient inputs to the Cape Fear River are high, phosphorus input occur in diverse chemical forms
potentially indicating their sources, and the variability in the phosphorus binding capacity increases downstream. These findings have strong implications for managing water quality in the region of the Cape Fear River. Since sediment and nutrient inputs influence algal and bacterial dynamics in aquatic environments, this study also has implications for biological productivity in this part of the Cape Fear River.
Given the importance of understanding the role of sediments and nutrients in controlling water quality we recommend the following:
1. Further research needs to be targeted toward our understanding of the
relationships between the chemical speciation of nutrients and their potential sources in the Cape Fear River.
2. It appears that characteristics of floodplain sediments become more variable from the Piedmont to the Coastal Plain. This probably is a function of changing energy regimes of the river leading to differential sediment sorting and / or changes in types of sediment input from diffuse sources. This variability in sediment characteristics increases the variability in phosphorus binding capacity, thus creating ‘hot spots’ downstream. This complicates our ability to predict if the floodplain sediments on the Cape Fear River will act as a sink or source of
phosphorus. Our findings suggest that it is best to restrict sediment loading to the Cape Fear River in the upper reaches of the watershed prior to these sediments being subjected to differential sorting forces.
4. Studies that focus on both the biological components (e.g. phytoplankton and microbial dynamics) and the abiotic components (sediment + nutrient dynamics) need to be integrated. It is recommended that collaborative research linking these fields be conducted to establish reliable relationships between biotic production and sediment and nutrient dynamics in the water column.
INTRODUCTION Problem Statement
Globally, human activities have altered the cycling of nutrients such as nitrogen
(Vitousek et al. 1997) and phosphorus (Kronvang et al. 1999) and increased the potential for runoff to aquatic ecosystems. The accumulation of nutrients in soils due to various types of land use practices (such as agricultural operations) may affect the health of downstream aquatic ecosystems. This is particularly true for phosphorus, as phosphorus can be sequestered onto sediment particles (Sundareshwar and Morris 1999), and
transported to rivers and lakes during runoff events in this soil bound form (Daniel et al. 1994, Sharpley et al. 1994). For river systems in the United States, estimates indicate that approximately 50% of nitrogen and phosphorus inputs are derived from point sources from urbanized areas (Newman 1995), but non-point sources are also known to be a significant source of nitrogen and phosphorus to most surface waters in the United States (Carpenter et al. 1998). Finding effective solutions to such problems has been a priority for the past two decades in the United States.
During recent decades the Cape Fear River (CFR) system, the largest river system in North Carolina, has experienced a proliferation of agriculturally-related industries, including large-scale agricultural operations, agrochemical manufacturing, and intensive livestock (e.g. swine) operations. This has resulted in dramatic increases in
anthropogenic imports of nitrogen and phosphorus into the river basin. Between 1985 and 1995 swine production in North Carolina increased by 248% and turkey production increased by 92% with more than 50% of the statewide hog production occurring within the Cape Fear River basin (Cahoon et al. 1999). While the total fertilizer shipped during 1985-1995 in the State of North Carolina increased by 0.2%, the change for the Cape Fear River Basin was around +2.2% (Cahoon et al. 1999). While the Neuse River basin has been the focus of numerous water quality related investigations (e.g. Paerl et al. 1998; Pickney et al. 1997; Paerl et al. 1995), the Cape Fear River basin has been accorded relatively little attention. However, there is a clear trend in water quality degradation on the Cape Fear River (Cahoon et al. 1999, Mallin 2000).
In the CFR basin, human activities have led to high sediment loads and associated nutrients from point and non-point sources. For example, Crawford (1985) in a
comprehensive analysis of water quality trends from selected sites in the Cape Fear River Basin show that between 1955 – 1980 more than 50% of most dissolved substances and over 80% of certain forms of nitrogen and phosphorus resulted from development within the watershed. A 1995 CFR Basinwide water quality management plan concluded that, “Sedimentation is the most widespread cause of water quality use support impairment in the Cape Fear River Basin as it is throughout most of the state” with an estimated 380 km of streams in the CFR Basin deemed impaired by sediment loadings. The dominant sources of sediment in the CFR Basin include construction, urban development,
Recognizing the diversity in the chemical forms of nutrient inputs into the system is critical to developing successful water quality improvement schemes, as is understanding their fate in the environment.
Although surface waters in North Carolina rivers have been the focus of intense monitoring and research, the role of the sediment chemical environment (SCE) in
influencing surface water quality has been essentially ignored. The reciprocal interaction between surface water quality and the processes occurring within the SCE underscores the need to better understand this important but least understood component of nutrient biogeochemistry and its relation to the nutrient status and quality of adjoining water bodies.
Goals and Objectives
The primary objectives of this study were to assess the role of sediments in mitigating the effects of nutrient enrichment of surface waters of the CFR, and to investigate the
diversity in the chemical forms of nutrients being loaded in the CFR. Specifically, we estimated the phosphorus retention capacity of riverbank sediments, and using 31P NMR, investigated the diversity in chemical forms of phosphorus in the riverbank sediments. This is important since some bioavailable forms (such as pyrophosphate) escape
detection by standard analytical techniques employed in routine water quality monitoring programs (Sundareshwar et al. 2001). Moreover, increase in P concentration can lead to accelerated eutrophication in the downstream estuarine ecosystem.
MATERIALS AND METHODS
Study Area
Water quality data and sediment samples were collected from three stations in the Middle Cape Fear River Basin. These stations were located upstream of three lock and dam (LD) structures on the CFR (Fig. 1). These LD structures, constructed by the US Army Corp of Engineers, were designed to allow commercial shipping on the Cape Fear River. These structures consist of locks designed to lift vessels between nine (2.7 m) and eleven feet (3.4m). LD 1 (which is located furthest downstream) was completed in 1915, LD 2 was complete in 1917, and LD 3 (the furthest upstream) was completed in 1935. Upstream of each lock is a large artificial pool approximately 400 feet wide and twelve feet deep. River sediments have accumulated in these pools and in the adjoining riverbanks since their construction. Dredging activities have been confined to a narrow band at the center of the river channel, leaving large areas of sediment undisturbed.
Additionally, sediment samples were collected from the Barra Farms site for NMR analyses. The Barra Farms Cape Fear River Mitigation Bank is located at the headwaters of Harrison Creek, a tributary of the Cape Fear River. The confluence of Harrison Creek with the Cape Fear River is located just downstream of LD 3 and upstream of LD 2. The Barra Farms site was originally part of a Carolina Bay wetland, large areas of which were ditched and converted to agricultural production. In 1997 about 600 acres of this
converted agricultural land was restored to wetland, while adjacent agricultural areas remained in production.
Surface water monitoring
Locations of study sites and sub-basins along the Cape Fear River. Locations of study sites and sub-basins along the Cape Fear River.
Figure 1. Map of study area showing locations of the three locks and dams on the Cape Fear River.
Pyrophosphate analysis in water samples
We used a new technique to specifically measure pyrophosphate (Ppi) in water samples. This technique relies on a cascade of enzymatic reactions, of which the first enzyme is Ppi dependent. Thus the reaction will only occur in the presence of Ppi (e.g. in water samples from our sites). We have previously used this technique successfully to measure pyrophosphate in river water samples (Sundareshwar et al. 2001)
Sediment sampling and analyses
Duplicate sediment cores were collected at the banks of the river upstream of each lock and dam. Samples were collected using a 7.5 X 7.5 cm by 60 cm deep stainless steel box corer with a removable fourth side (C. J. Richardson, unpublished design). Additional samples were also collected from ‘over-wash’ wetlands at LD 1, to assess the
contribution of high flood events versus sustained riverine sediment load to the
sedimentation rates. Compaction of the cores was minimized by pushing the three-sided corer into the soil and then sliding in the fourth side. The intact cores were then removed and the 50-55 cm deep cores were sectioned in the field in 10 cm depth fractions. These fractions were used for 137Cs dating and nutrient and mineral element parameter analysis. Field observations suggested high sediment load in these regions; thus, we opted to use larger depth fractions of 10 cm for our 137Cs dating analysis to reliably partition pre- and post-1964 periods (see description for 137Cs analysis below).
137Cs dating on sediment cores
Rates of sedimentation using 137Cs were measured as described in Craft and Richardson (1993). Briefly, each depth fraction of the cores was air-dried and ground to pass a 2 mm mesh sieve and weighed into a plastic petridish. Sedimentation rates were estimated by counting for 137Cs in the depth fractions. The 137Cs maximum in the soil profile
corresponds to the soil surface in 1964, the period of maximum deposition of 137Cs from aboveground thermonuclear weapons tests. Accumulation of sediments above the 137Cs maximum represents the net accretion of sediments in 36 years. The 137Cs activity in samples was measured by counting gamma emissions at 661.26keV for 8 hours using a high purity germanium (2.08% efficiency) detector (EG&G Ortec, Oak Ridge TN).
Sediment Nutrients and Mineral element analysis
Sediment Characterization
Bulk densities of riverbank sediments were determined gravimetrically after drying intact sediment cores to a constant weight. The organic matter content of the sediments was calculated as weight loss upon ignition at 550°C for 12 hrs. Total carbon and nitrogen were measured on a CHN analyzer, while total P and elemental composition of the sediments was determined using an autoanalyzer after acid digestion of the sediment samples.
Nutrient buffering capacity of sediments
Triplicate samples of surface sediments (0 – 10 cm depth) from three lock and dam sites were used to estimate their nutrient buffering capacity. Sediment samples were incubated with solutions of increasing phosphorus concentration. The sorption coefficients were estimated by fitting the data to sorption models such as Freundlich adsorption model. The zero equilibrium phosphate-P concentration (ZEPC) (a concentration at which no net adsorption or desorption occurs) was also estimated from the above data set. Phosphorus binding capacities of sub-surface sediments (10-20 cm depth) from our sites were also estimated (Sundareshwar and Morris 1999).
31P NMR Studies
The occurrence of various phosphorus species in the riverbank (from the three lock and dam structures) and Barra Farms sediments (from agricultural lands, restored wetlands and a natural wetland) were assessed using 31P solution NMR spectroscopy as described in Sundareshwar et al. 2001. Briefly, triplicate surface sediment cores (0-10 cm depth) from each site were pooled and extracted overnight at room temperature (using a soil:solution ratio of approximately 10 g dry sediment : 100 ml 0.5 M NaOH + 0.1 M EDTA). Extraction efficiencies were calculated as the difference in total phosphorus concentrations between un-extracted sediment samples and the total phosphorus in the NaOH+EDTA extract. Extracts were centrifuged at 3200 rpm after adjusting the pH to 12.5, and 3 ml of the supernatant was used for NMR analyses after adding 0.3 ml of Deutrium Oxide (D2O). All spectra were collected over 24 hrs with a 100 ppm window centered at 0 ppm on a Varian 500 spectrometer. Chemical shifts (relative to 85% phosphoric acid) were assigned based on external standards and literature. 31P NMR analysis was also run on surface water from LD 3 that was concentrated approximately 140-fold using a rotary evaporator.
Estimation of current land-use patterns
We estimated the current land-use patterns within the sub-watersheds of the lock and dam structures to assess the relationship between types of anthropogenic impact and forms of phosphorus input. Using ARC info and GIS analysis we categorized the sub-watersheds on the basis of hydrological units prior to the estimation of land-use. Using a land-use classification scheme as defined under the National Land Cover Data (NLCD) and ARC
RESULTS AND DISCUSSION
Phosphorus in surface waters
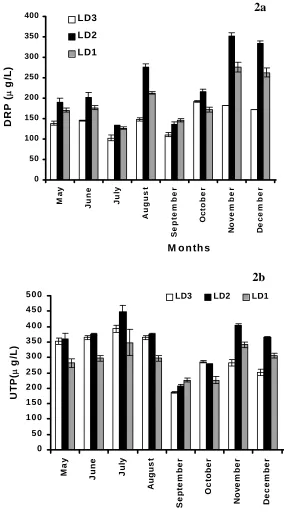
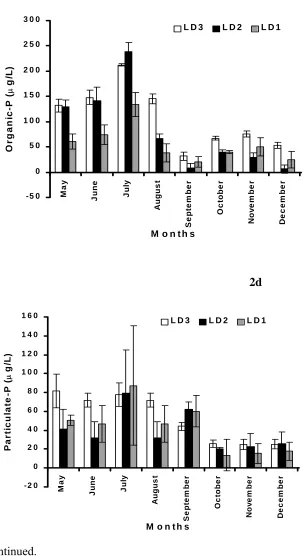
Our results indicate that there are differences in water quality parameters among the three LD structures during May-December, 2001. In comparison to the upstream site, LD 3, downstream sites LD 2 and LD 1 generally had higher concentration of nutrient parameters such as dissolved reactive phosphorus (DRP) and total phosphorus (TP) in surface water (Fig. 2 a, b). However, the relative contributions of organic fractions of phosphorus were generally higher at LD 3 site than those measured at downstream sites LD 2 and LD 1 while particulate phosphorus was more variable (Fig. 2c, d). These results are consistent with observations in 2000 (Sundareshwar and Richardson, 2001).
During the course of this study, the concentrations of DRP and total phosphorus in surface waters within a site varied seasonally, possibly the influence of streamflow and precipitation conditions. For instance, surface water concentrations of DRP at the LD 3 site were generally lower during the summer months but increased during the fall and winter months. However, surface water TP concentrations at this site were generally greater during the summer months and relatively lower during October to December (Fig. 2b). Correspondingly, the concentrations of organic and particulate phosphorus were highest during the summer months (Fig. 2 c, d) and declined during October - December. This suggests that in this section of the Cape Fear River, the portioning of phosphorus in inorganic, organic and particulate pools differs seasonally, but among-site differences generally persist (Fig. 2 a - d).
The higher concentrations of DRP in surface water at LD 2 may partly be due to the difference in anthropogenic inputs from point sources upstream of LD 2. For instance, there are relatively greater numbers of permitted point discharge locations in between LD 3 and LD 2 sites, than there are over a comparable distance upstream of LD 3 site
(CH2MHILL 1999). While the volume of discharged material is likely to be more important than the numbers of point sources per se, higher numbers may nevertheless indicate a greater degree of anthropogenic influence.
Figure 2. Monthly means for a) dissolved reactive phosphorus (DRP), b) unfiltered total phosphorus (UTP), c) organic phosphorus, and d) particulate phosphorus concentrations (μg/L) in surface water at the three lock and dam (LD) sites. Data are for the year 2001. Error bars represent ± 1 SD. n= 3 per site per sampling event.
0 50 100 150 200 250 300 350 400 Ma y Ju n e Ju ly A u gus t Se p te m b e r Oc to b e r No v e m b e r De c e m b e r
M o n th s
DRP ( μ g/ L ) LD3 LD2 LD1 2a 0 5 0 1 0 0 1 5 0 2 0 0 2 5 0 3 0 0 3 5 0 4 0 0 4 5 0 5 0 0
May Jun
e Ju ly A ugus t S e pte m be r O c tobe r No v e m b e r De c e m b e r
M o n th s
UT P ( μ g/ L )
LD3 LD2 LD1
2b
-5 0 0 5 0 1 0 0 1 5 0 2 0 0 2 5 0 3 0 0
May June Ju
ly Au g u s t S e pte m be r Oc to b e r No v e m b e r De c e m b e r
M o n t h s
Or g a ni c -P ( μ g/ L )
L D 3 L D 2 L D 1
2c
- 2 0 0 2 0 4 0 6 0 8 0 1 0 0 1 2 0 1 4 0 1 6 0
Ma y Ju n e Ju ly Au g u s t S e pte m be r Oc to b e r No v e m b e r D e ce m b er
M o n t h s
Pa r ti c u la te -P ( μ g/ L )
L D 3 L D 2 L D 1
2d
Sedimentation rates and phosphorus accumulation
Accumulation of phosphorus in the riverbank sediments is most certainly controlled by sediment loading from the sub-watersheds and in situ sediment processes. 137Cs dating reveals that LD 3 site has accumulated about 20 cm of sediments in approximately the past four decades. In contrast, LD 2 site accumulated about 55 cm of sediment and LD 1 site accumulated at least 50 cm of sediment during the same interval. This suggests that the sedimentation rates differ among the three lock and dam structures, with LD 2 and LD 1 supporting relatively higher rates (1.5 cm/ year and 1.3 cm/ year, respectively) than LD 3 (0.5 cm/year).
The higher sedimentation rates observed at LD 2 and LD 1 may be due to upstream inputs (i.e. from LD 3 sub-watershed and sources located further upstream) or may be a function of local land-use practices within its sub-watershed. While there are many factors that influence local depositional processes, we found that the channel gradient for LD 3 (0.013%) is 4 times that at LD 2 (0.003 %) and 6 times that at LD 1 (0.002%). This suggests that the upstream reaches of LD 3 are much less favorable for sediment
deposition. Such a change in the channel gradient could mean that LD 2 and LD 1 sites are better depositional environments and consequently could be trapping sediment loads from LD 3 and upstream sources. Importantly, our data suggests that the high sediment load in CFR basin is a chronic and ongoing phenomenon and that high sedimentation rates observed in the Cape Fear River Basin are not due to episodic major flood events. This is illustrated by a comparison of down-core 137Cs profiles in sediment cores from floodplain at the LD 1 site and an over-wash wetland (located adjacent to the LD 1 site). The sedimentation rate in the over-wash wetland at LD 1 (0.33 cm/yr) was lower than that estimated from the floodplain sediments at LD 1 (1.3 cm/yr) (Fig. 3). If the
sedimentation rates were due to episodic high flood events then the sedimentation rates at over-wash wetland and the adjoining floodplain location at LD 1 would have been similar or sedimentation rates would have been greater in the over-wash wetland.
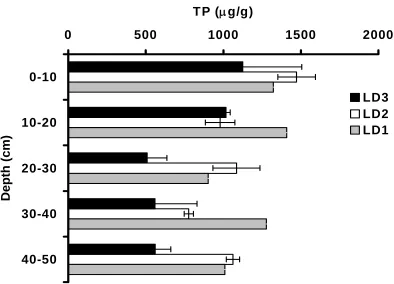
The difference in sediment deposition rates also implies that the magnitude of input of sediment-bound nutrients (such as P) may also differ among these sites. Down-core trends in sedimentary total phosphorus concentrations in floodplain cores from the lock and dam sites suggest that this hypothesis is indeed true (Fig. 4). For instance, at the LD 3 site, highest concentrations of sediment total phosphorus are restricted to the top 20 cm of the soil depth profile, which corresponds to the depth of sediment deposited at this site during the past four decades. In contrast, deeper sediments (20 – 50 cm) at this site support relatively lower total phosphorus concentrations. Depth-related trends in total phosphorus for sediment cores from LD 2 and LD 1 are less pronounced, indicating a more even distribution of total phosphorus across the depth profile at these two downstream sites.
Figure 3. Down-core 137Cs profiles at two locations at LD 1. Sedimentation rate in an over-wash wetland adjoining the sampling site on a floodplain at LD 1 was relatively lower and captures a sediment deposition rate reflective of very high flood events. Inset shows that 137Cs peak occurs at 8 –12 cm depth fraction in the sediment core from the over-wash wetland.
0 500 1000 1500 2000
0-10
10-20
20-30
30-40
40-50
Depth (cm)
T P (μg/g)
LD3 LD2 LD1
Figure 4. Down-core variation in total phosphorus for sediment cores collected from floodplain sediments of the three lock and dam structures on the Cape Fear River. (n=3 for LD 3 and LD 2, n= 1 for LD 1; bars represent ± 1 SD)
These down-core changes in total phosphorus in the floodplain cores from the LD sites provide a means of evaluating past changes in phosphorus content in suspended
sediments in this region of the Cape Fear River. Coupling information on changes in sediment phosphorus with average sedimentation rates estimated from 137Cs profiles suggests that sediment deposition during the recent decades has caused an increase in the nutrient loading to the Cape Fear River Basin. At least at one site (LD 3) there are
marked differences in nutrient accumulation rates between pre- and post 1964 periods, with the post-1964 period accumulating more than 2000 μg of phosphorus / g of dry sediment (Fig. 5). This represents nearly a doubling in phosphorus accumulation when compared with accumulations during the pre-1964 era. For LD 2 and LD 1 sites, which experience relatively higher sedimentation rates however, phosphorus accumulation during the pre-1964 era could not be calculated directly as the 137Cs counts did not reach background levels even at the last depth fraction of the sampled sediment cores. When compared to the pre-1964 estimate for the LD 3 site however, post-1964 sediment phosphorus accumulation levels at LD 2 and LD 1 sites were about 4.2 and 4.5 times higher, respectively (Fig. 5).
These data suggest that LD 2 and LD 1 sites are subjected to higher sediment and nutrient inputs than LD 3. A tight coupling between sediment load and total phosphorus loading has also been reported for other rivers around the world. For instance, Walling (1999) reported that rivers in the United Kingdom that drained watersheds that supported intensive agriculture transported and accumulated higher total phosphorus during 1950 – 1990 than rivers that drained primarily non-agricultural watersheds. The total
phosphorus accumulation in the floodplain sediments of these rivers was also closely related to corresponding sedimentation rates (Fig. 4).
Figure 5. Total phosphorus accumulation at the three lock and dam structures on the CFR basin since 1964. Data for pre-1964 is shown only for LD 3 and is computed over 20 – 50 cm depth. Note: Sedimentation rates are described in the text. The net accumulation in 36 years at LD 3 was 20 cm, while at LD 2 and LD 1 it was at least 50 – 55 cm in 36 years and could be greater.
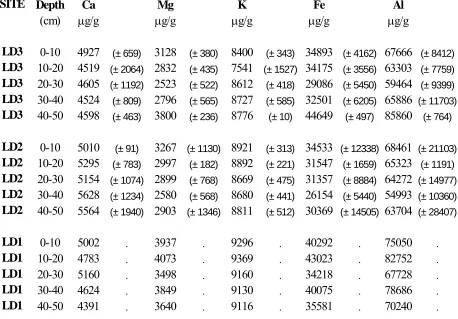
Table 1. Mean concentrations (± 1 SD), by depth, of mineral elements in sediment cores from lock and dam sites on the Cape Fear River. (n = 3 for LD 3 and LD2, n = 1 for LD
1)
Depth Ca Mg K Fe Al
(cm) μg/g μg/g μg/g μg/g μg/g
0-10 4927 (± 659) 3128 (± 380) 8400 (± 343) 34893 (± 4162) 67666 (± 8412) 10-20 4519 (± 2064) 2832 (± 435) 7541 (± 1527) 34175 (± 3556) 63303 (± 7759) 20-30 4605 (± 1192) 2523 (± 522) 8612 (± 418) 29086 (± 5450) 59464 (± 9399) 30-40 4524 (± 809) 2796 (± 565) 8727 (± 585) 32501 (± 6205) 65886 (± 11703) 40-50 4598 (± 463) 3800 (± 236) 8776 (± 10) 44649 (± 497) 85860 (± 764)
0-10 5010 (± 91) 3267 (± 1130) 8921 (± 313) 34533 (± 12338) 68461 (± 21103) 10-20 5295 (± 783) 2997 (± 182) 8892 (± 221) 31547 (± 1659) 65323 (± 1191) 20-30 5154 (± 1074) 2899 (± 768) 8669 (± 475) 31357 (± 8884) 64272 (± 14977) 30-40 5628 (± 1234) 2580 (± 568) 8680 (± 441) 26154 (± 5440) 54993 (± 10360) 40-50 5564 (± 1940) 2903 (± 1346) 8811 (± 512) 30369 (± 14505) 63704 (± 28407)
0-10 5002 . 3937 . 9296 . 40292 . 75050 .
10-20 4783 . 4073 . 9369 . 43023 . 82752 .
20-30 5160 . 3498 . 9160 . 34218 . 67728 .
30-40 4624 . 3849 . 9130 . 40075 . 78686 .
40-50 4391 . 3640 . 9116 . 35581 . 70240 .
SITE
LD3 LD3 LD3 LD3 LD3
LD2 LD2 LD2 LD2 LD2
Phosphorus binding capacity of floodplain sediments
Our results reveal that the total phosphorus in floodplain sediments of the CFR, in general, was positively correlated with the sum of total Fe, Al, Ca and Mg (Fig. 6). This positive relationship was observed for surface and sub-surface sediments at all sites except in surface sediments at LD 2. At this site, while sub-surface sediments exhibited a positive relationship, the surface sediments at LD 2 did not (Fig. 6). This suggests that recent input of phosphorus and mineral elements from external sources may have altered this relationship.
Among the three lock and dam sites, the floodplain sediments at LD 2 had the greatest phosphorus binding capacity, while the most downstream site LD 1 had the lowest (Fig. 7a). This trend in P-sorption capacity of the riverbank sediments persisted for the sub-surface sediments (Fig. 7b), although the P-binding capacity of the sub-sub-surface sediments was lower than the binding capacity of corresponding surface sediments. Importantly, the intra-site variability in P-sorption capacity and mineral element composition increases downstream, most likely due to differential sorting of the riverine sediment load. Despite the higher sorption capacity of LD 2 sediments, the surface water concentrations of dissolved phosphorus were highest at this site.
0 200 400 600 800 1000 1200 1400 1600 1800
0 50000 100000 150000 200000
LD1 surface
LD2 Surface
LD3 Surface
Total P (
g/g) 0 200 400 600 800 1000 1200 1400 1600 1800
0 50000 100000 150000 200000
LD1 D LD2 D LD3 D 0 200 400 600 800 1000 1200 1400 1600 1800
0 50000 100000 150000 200000
μ 0 200 400 600 800 1000 1200 1400 1600 1800
0 50000 100000 150000 200000
Total (Ca+Mg+Fe+Al) (μg/g) Total (Ca+Mg+Fe+Al) (μg/g) Total (Ca+Mg+Fe+Al) (μg/g) 0 200 400 600 800 1000 1200 1400 1600 1800
0 50000 100000 150000 200000
LD1 D LD2 D LD3 D 0 200 400 600 800 1000 1200 1400 1600 1800
0 50000 100000 150000 200000
LD1 surface
LD2 Surface
LD3 Surface
Total P (
g/g) 0 200 400 600 800 1000 1200 1400 1600 1800
0 50000 100000 150000 200000
LD1 D LD2 D LD3 D 0 200 400 600 800 1000 1200 1400 1600 1800
0 50000 100000 150000 200000
μ 0 200 400 600 800 1000 1200 1400 1600 1800
0 50000 100000 150000 200000
Total (Ca+Mg+Fe+Al) (μg/g) Total (Ca+Mg+Fe+Al) (μg/g) Total (Ca+Mg+Fe+Al) (μg/g) Total (Ca+Mg+Fe+Al) (μg/g) Total (Ca+Mg+Fe+Al) (μg/g) Total (Ca+Mg+Fe+Al) (μg/g) 0 200 400 600 800 1000 1200 1400 1600 1800
0 50000 100000 150000 200000
LD1 D LD2 D LD3 D
7a
7b
Figure 7. Phosphorus sorption isolpleths of floodplain sediments from the lock and dam sites; a) Surface sediments (0 – 10 cm depth) and b) sub-surface (10 – 20 cm depth) sediments. n=3 for each site and depth. Error bars represent ± 1 std. Err.
31
P NMR analyses of sediments and surface waters
31P Nuclear Magnetic Resonance (NMR) analyses of riverbank sediments reveal that phosphorus-speciation in the floodplain sediments of the CFR is chemically diverse, indicating diverse sources of P to the CFR. 31P NMR analyses of floodplain sediments from the three LD sites revealed the presence of diverse P-forms such as Glyphosate (a commonly used weedkiller), Aminomethylphosphonic Acid (a degradation product of Glyphosate) and pyrophosphate (the smallest chemical form of polyphosphate with wide industrial applications), in addition to more commonly observed P-forms (Fig. 8a-c). The degree of accumulation of phosphonates (e.g. glyphosate and aminomethylphosphonic acid) differed among sites. For instance, the floodplain sediments at LD 3 had lower sedimentary concentrations of these forms of P than its downstream counterparts (Fig. 8a-c).
Interestingly, while the concentration of pyrophosphate in surface waters was below detection, 31P NMR analysis of surface water from the LD 3 site that was concentrated 140-fold showed peaks that corresponded to glyphosate, aminiomethylphosphonic acid, and pyrophosphate (Fig. 9). Although the surface water concentration of these forms of phosphorus may be very low, over time the phosphorus binding properties of the
deposited sediments may concentrate these forms of phosphorus in the floodplain of the CFR. This suggests that phosphorus loading in this river occurs in diverse chemical forms.
To investigate the effect of land use practices on chemical speciation of phosphorus, we performed 31P NMR analyses on sediments from areas under varying land use within the sub-watershed of the LD 2 site. The Barra Farms Mitigation Banking site has areas that are actively farmed, restored wetlands, and natural bay forests. This site is hydrologically connected to the LD 2 site and thus the land use practice here directly contributes to the water quality conditions at the LD 2 site.
NMR analyses of sediments revealed differences in concentration and diversity of chemical speciation of phosphorus across these land use types. For instance, while the sediments underlying a natural bay forest had the highest diversity in P-forms (Fig. 10a), inorganic orthophosphate was the only major P-form in sites under active agriculture which suggested that converting natural wetlands to agricultural land results in the loss of natural ‘diversity’ in the chemical forms of phosphorus (Fig. 10b) – analogous to the loss of ‘biodiversity’ in impacted ecosystems. However, 31P NMR of sediments from the restored wetland site indicates that restoration of impacted sites may result in
smallest chemical form of polyphosphate with wide industrial application) in ecosystems is related to the degree and type of high impact urban area around the site.
Importantly, our results suggest that P loading in the CFR occurs in diverse forms, reflecting a myriad of sources. It is clear that land use practices alter the diversity in P-forms, and such alterations have important biogeochemical consequences for nutrient bioavailability and storage.
Pyro-p AMPA
Glyphosate
?
31
P ppm
LD 2
Inorganic orthophosphate
Diesters Monoesters
LD 3
LD 1
31
P ppm
Figure 8 continued.
Landscape
Pyro-p AMPA
Glyphosate
31
P ppm
Inorganic orthophosphate
Figure 9. 31P NMR spectra of surface water from the most upstream site LD 3 that was concentrated 140-fold. Note the peaks corresponding to pyrophosphate, glyphosate and its degradation product aminomethylphosphonic acid (AMPA).
-25 -15
-5 5
15 25
Diester
a
Phopshonate
Inorganic orthophosphate
Monoester Polyphosphate
-25 -15
-5 5
15 25
b
31 P ppm
Figure 10. 31P solution NMR spectra for surface sediments (0 – 10 cm) from areas under varying land use in the Barra Farms. a) a natural bay forest, b) a bay forest under agriculture, and c) a restored wetland after five growing seasons.
-25 -15
-5 5
15 25
Figure 11. ARC info and GIS-based relative land-use patterns within the
sub-watersheds (estimated by basin) of the three lock and dam structures. Shown are the relative contributions of individual sub-watersheds of LD 3, LD 2 and LD 1, to each land use category within the total Basin area upstream of LD 1. For example, the total area of land under agriculture (denoted as AG) within the sub-watershed of LD 3 constitutes approximately 80% of the cumulative total of land area that is under
agriculture within all three sub-watersheds. LIU and HIU refer to low impact and high impact urban areas.
0% 10% 20% 30% 40% 50% 60% 70% 80% 90% 100% WAT E R LI
U HIU BARRE
CONCLUSIONS
Our findings suggest that sediments provide important clues about factors influencing current water quality of the Cape Fear River as well as historical nutrient inputs. The diversity in the chemical forms of phosphorus in the riverbank sediments helps identify the types and sources of nutrient loading in the CFR. It is conceivable that, after a few years of sustained nutrient loading (e.g. phosphorus), floodplain sediments of the Cape Fear River system will eventually become saturated with nutrients and thus will be unable to ameliorate nutrient-driven surface water quality degradation. Importantly, increasing variability downstream in the mineral element composition and the P-binding capacity of riverbank sediments suggests that moving seaward, sediment sorting will lead to creation of ‘hot spots’ for efficient P-sorption and release along the riverbank of the CFR, and this could pose a considerable challenge with regard to water quality
REFERENCES
Cahoon, L.B., Mikucki, J.A., and M.A. Mallin, 1999. Nitrogen and phosphorus imports to the Cape Fear and Neuse River basins to support intensive livestock
production. Environmental Science & Technology 33 (3):410-415.
Cape Fear River Basinwide water quality management plan 1995. N.C. Department of Environment and Natural Resources, Division of Water Quality, Raleigh. Carpenter, S.R., N.F. Caraco, D.L. Correll, R.W. Howarth, A.N. Sharpley, and V.H.
Smith, 1998. Nonpoint pollution of surface waters with phosphorus and nitrogen. Ecological Applications 8(3):559-568.
Craft, C. B. and C. J. Richardson, 1993. Peat accretion and N, P, and organic C accumulation in nutrient-enriched and unenriched Everglades peatlands. Ecological Applications 3(3):446-458.
Crawford, K. J., 1985. Water quality of North Carolina streams—Water-quality characteristics for selected sites on the Cape Fear River, North Carolina, 1955-80—Variability, Loads, and Trends of selected constituents. U.S. Geological Survey Water-Supply Paper 2185-F. 44pg.
CH2MHILL, 1999. Ambient and Comprehensive Monitoring Data Review – July through December 1998. Technical Memorandum prepared for the Middle Cape Fear River Basin Association (MCFRBA).
Daniel, T.C., A.N. Sharpley, D.R. Edwards, R. Wedepohl and J.L. Lemunyon, 1994. Minimizing surface water eutrophication from agriculture by phosphorous management. Journal of Soil and Water Conservation 49(2):30-38.
Horowitz, A.J., M. Meybeck, Z. Idlafkih and E. Biger, 1999.Variations in trace element geochemistry in the Seine River Basin based on floodplain deposits and bed sediments. Hydrological Processes 13(30):1329-1340.
Kronvang B., C.C. Hoffmann, L.M. Svendsen, J. Windolf, J.P. Jensen and J. Doerge, 1999. Retention of nutrients in river basins. Aquatic Ecology 33:29-40.
Mallin, M. A., 2000. Impacts of Industrial Animal Production on Rivers and Estuaries. American Scientist 88(1):26-37.
Newman, E.I., 1995. Phosphorus inputs to terrestrial ecosystems. Journal of Ecology 83,
(4):713-726.
Paludan and Morris, 1999. Distribution and speciation of phosphorus along a salinity gradient in intertidal marsh sediments. Biogeochemistry 45:197-221
Paerl, H.W., M.A. Mallin, C.A. Donahue, M. Go and B.L. Peierls, 1995. Nitrogen loading sources and eutrophication of the Neuse River estuary, NC: Direct and indirect roles of atmospheric deposition. Report No. 291 of the UNC Water Resources Research Institute, Raleigh, NC.
Paerl, H. W., J. L. Pinckney, J. M. Fear, and B. L. Peierls, 1998. Ecosystem responses to internal and watershed organic matter loading: consequences for hypoxia in the eutrophying Neuse River Estuary, North Carolina, USA. Mar. Ecol. Prog. Ser.
166:17-25.
Richardson, C. J. and P. V. Sundareshwar, 2001. Present and historical water quality in the Cape Fear River: Effect of lock and dam structures. Report of the Water Resources Research Institute, Raleigh, N.C.
Sharpley, A.N., S.C. Chapra, R. Wedepohl, J.T. Sims, T.C. Daniel, and K.R. Reddy, 1994. Managing agricultural phosphorus for protection of surface waters: Issues and options. Journal of Environmental Quality 23(3):437-451.
Sommers, L.E and D.W. Nelson, 1972. Determination of total phosphorus in soils: a rapid perchloric acid digestion procedure. Soil Sci. Soc. Amer. Proc. 36:902-904.
Sundareshwar, P.V. and J.T. Morris, 1999. Phosphorus sorption characteristics of
intertidal marsh sediments along an estuarine salinity gradient. Limnol. Oceanogr.
44:1693-1701.
Sundareshwar, P. V., J. T. Morris, P. J. Pellechia, H. Cohen, D. E. Porter, and B. C. Jones, 2001.Occurrence and ecological significance of pyrophosphate in estuaries. Limnol. Oceanogr. 46:1570-1577.
Vitousek, P.M., J.D. Aber, R.W. Howarth, G.E. Likens, P.A. Matson, D.W. Schindler, W.H. Schlesinger, and D.G. Tilman, 1997. Human alteration of the global nitrogen cycle: Sources and consequences. Ecological Applications, 7:737-750.
Walling, D.E., 1999. Linking land use, erosion and sediment yields in river basins. Hydrobiologia 410:223-240.