ISSN(Online) : 2319 - 8753
ISSN (Print) : 2347 - 6710
I
nternational
J
ournal of
I
nnovative
R
esearch in
S
cience,
E
ngineering and
T
echnology
(An ISO 3297: 2007 Certified Organization)
Vol. 4, Issue 4, April 2015
Estimation of Channel Performance of
Satellite Communication and Frequency
Reader
G.Bhargavi
1, G.Sai Meghana
2, G.Sai Keerthana
2,
A.V.V.Prasad
3, N.JagadeshBabu
1P.G Student, Department of Electronic Instrumentation Engineering, GITAM University, Vishakapatnam, A.P, India1
P.G Student, Department of Electronic Communication Engineering, VR Siddhartha Engineering College, Vijayawada,
A.P, India2
P.G Student, Department of Electronic Communication Engineering, VR Siddhartha Engineering College, Vijayawada,
A.P, India2
Head, OBSSR, DPO&AD/NRSC, Hyderabad, India3
Assistant Professor, EIE, GITAM University, Vishakapatnam, A.P , India1
ABSTRACT: National Remote Sensing Center (NRSC) receives data from different remote satellites like IRS-P6, IRS-P5, Cartosat-2, Cartosat-2a, etc., and processes it depending on the user requirements. The satellite data received in X band is in a particular data format. This data has to be frame synchronized using a special hardware. The receiver hardware setup must be ready at any time to make it ready it‟s performance is to be tested continuously.The frequency with which satellite data is coming is also continuously tested . In the proposed project VHDL code has been developed for BER reader with differential encoding and decoding and frequency reader. The external frequency and number of errors in satellite data will be displayed on HP display devices. This project has been implemented and tested using the ALTERA EPLDs. This needs crystal oscillators, thumb wheel switches,7 segment display etc., must be programmed as per the requirement. The hardware required for this has been implemented on the wire-warp board.
KEYWORDS: Very High Speed Integrated Circuit Hardware Description Language (VHDL), Binary CodedDecimal (BCD), Bit error rate reader(BER), Electrically Programmable Logic Device (EPLD)
I. INTRODUCTION
Indian Remote sensing satellites sends data serially and continuously in X-band frequency. The satellite data coming must be with exact frequency which is known already, but some times during bit synchronization there is a chance of varying frequency. So frequency reader is used at receiver side to know the frequency. The satellite data is Frame synchronized and BER reader is used to detect the errors in coming satellite data. Here differential and decoding techniques are used.
In satellite communication QPSK modulation technique is used and in this modulation I and Q channels are combined. So there is a chance of phase ambiguity to overcome this problem satellite data is differentially encoded at transmitter side and differentially decoded at receiver side.
The Frequency reader consists of one internal clock which is fixed and it is considered as 10MHz.This clock is further divided into 1Hz clock. This 1Hz clock is considered as reference clock and based on this a 1Hz window is generated. By using this window the external clock is measured.
ISSN(Online) : 2319 - 8753
ISSN (Print) : 2347 - 6710
I
nternational
J
ournal of
I
nnovative
R
esearch in
S
cience,
E
ngineering and
T
echnology
(An ISO 3297: 2007 Certified Organization)
Vol. 4, Issue 4, April 2015
Fig.1. Project over view
II. RELATED WORK
Remote sensing satellites are in the orbit of 600 to 800km height from the earth surface and send data continuously covering whole globe in some specified times ,that send particulars of any continent, may be weather information, sea particulars, etc., Satellite is visible to the earth station for a short duration of about 12 to 15min.Therefore ground segment is required to be planned and developed for the above efficiency on a continuous basis uninterruptedly on 24/7 basis .Before launch of a satellite in to its orbit ,it is important to check all the health parameters of Ground Station equipments are proper. The systems and process are required to be designed to demonstrate the reliability of all on day-to-day basis .So a system is created at the groung station so that it can check the system performance. The ground system mainly consists of two parts.
Generator:
PRBS generator is used to generate a PN sequence.The tapping bits are xored and feed back is given to generate PN sequence.PN sequence is differentially encoded to avoid phase ambiguity.To the encoded sequence errors are injected using reset button.The clock is resynchronized to avoid glitches by inverting clock and passing through D flip flop.By using resynchronized clock output and clock of generator are taken as input for reader.
Reader:
In BER reader the clock and output of generator are taken as inputs .First encoded sequence is decoded.Then property of PN sequence is checked.Window‟s are generated.Mismatch counter is used to count errors.These errors are displayed using seven segment displays.If no error occur then zero is displayed.
Frequency reader:
Initially internal clock is to be considered which is used for reference. A 10MHz clock is considered as basic clock. This 10 MHz clock is divided into 1Hz clock by using decimal counters. This 1Hz clock is considered as reference clock. Based on Reference clock 1HZ window is generated. This window will be continuously repeating for every interval of time. At every rising edge of reference clock window is made high at regular intervals. When window is made high then external clock tick events are measured and displayed using seven segment display.
III. PRBS GENERATOR
Psuedo Random Binary Sequence generator uses Linear feedback shift register logic.So PRBS generator is
nothing but random binary number generator. It is „random‟ in a sense that the value of an element of the sequence is
independent of the values of any of the other elements. It is 'pseudo' because it is deterministic and after N elements it
ISSN(Online) : 2319 - 8753
ISSN (Print) : 2347 - 6710
I
nternational
J
ournal of
I
nnovative
R
esearch in
S
cience,
E
ngineering and
T
echnology
(An ISO 3297: 2007 Certified Organization)
Vol. 4, Issue 4, April 2015
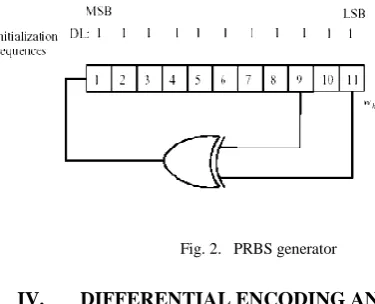
shift register).If we consider a 11 bit sequence 9 and 11 are the tapping bits.those tapping bits should be xored and is
send as a feed back to the first bit and finally sequence is generated which is as shown in fig2.
Fig. 2. PRBS generator
IV. DIFFERENTIAL ENCODING AND DECODING
For normal coding techniques a reference signal must be sent to the receiver to decode the data. But by using differential coding techniques any reference signal is not necessary. It depends on present and previous value. In satellite communication QPSK modulation technique is used. In this technique I and Q channels are combined. At receiver side it is difficult to differentiate I and Q channels. So by using differential encoding and decoding we can avoid this problem.fig3 shows differential encoding and decoding.
fig. 3. Differential encoding and decoding
V. ERROR INJECTION
In order to calculate errors in reader error injection must be done manually using reset switch. When reset is pressed errors are injected at generator side. For using reset switch, switch debouncer is used(DM700N).DM700N is used for latching operation.
VI. BER READER
Bit error rate (BER) of a communication system is defined as the ratio of number of error bits and total number of bits transmitted during a specific period. It is the likelihood that a single error bit will occur within received bits, independent of rate of transmission. There are many ways of reducing BER.
The errors coming from the transmitter are to be detected at receiver side. For the measurement of these errors first property of LFSR is to be checked and mismatch counter is activated whenever property is not satisfied mismatch counter will get incremented.
ISSN(Online) : 2319 - 8753
ISSN (Print) : 2347 - 6710
I
nternational
J
ournal of
I
nnovative
R
esearch in
S
cience,
E
ngineering and
T
echnology
(An ISO 3297: 2007 Certified Organization)
Vol. 4, Issue 4, April 2015
displayed using seven segment display. The hardware is checked using logic analyzer. Thumb wheel switch is used to select window.
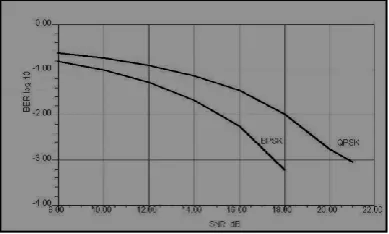
Figure5(a) shows the BER performance to AWGN channel, where BPSK and QPSK systems are compared. BPSK requires 3 dB less of signal to noise ratio than QPSK to achieve the same BER. This outcome will hold true only if we consider BER in terms of SNR per carrier. In terms of signal to noise ratio per bit the BER is same for both QPSK and BPSK.
The effect of convolutional coding on BPSK for different convolutional code rates is displayed in figure5(b) , and for example, coding with rate K/N = 1/2 results in a saving of 4 dB and with rate 1/3 more than 5 dB (example is
for BER = 10
-3
).
Fig. 5(a). Bit error performance in terms of SNR per carrier for BPSK and QPSK
fig. 5(b). Effect of convolutional coder with different rates for BPSK system
If no errors exist then the output of ber reader will be zero and if errors occurs those will be displayed and window are checked continuosly.
VII. FREQUENCY READER
ISSN(Online) : 2319 - 8753
ISSN (Print) : 2347 - 6710
I
nternational
J
ournal of
I
nnovative
R
esearch in
S
cience,
E
ngineering and
T
echnology
(An ISO 3297: 2007 Certified Organization)
Vol. 4, Issue 4, April 2015
fig. 6(a). Satellite data acquisition system
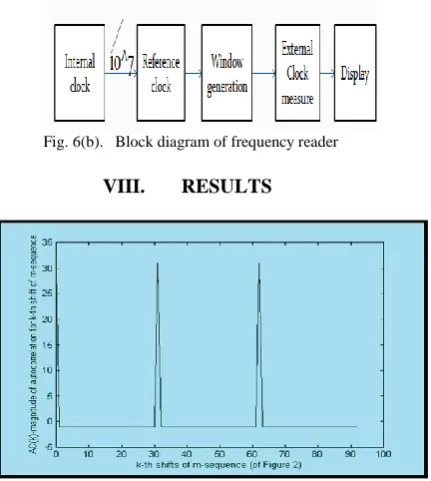
Frequency reader receives frequency from the external crystal oscillator . It outputs the frequency of external clock and is displayed using seven segment display. To measure the external clock as a reference we will use 10MHz clock and it is divided into 1Hz clock. If frequency is not measured then if frequency change during bit synchronization it is difficult to find. Then if it is not detected there is possibility to receive wrong data.Figure shows block diagram of frequency reader.
Fig. 6(b). Block diagram of frequency reader
VIII. RESULTS
fig. 7. PRBS wave form in matlab
ISSN(Online) : 2319 - 8753
ISSN (Print) : 2347 - 6710
I
nternational
J
ournal of
I
nnovative
R
esearch in
S
cience,
E
ngineering and
T
echnology
(An ISO 3297: 2007 Certified Organization)
Vol. 4, Issue 4, April 2015
Fig 8 shows the hardware part of prbs seqence.It consists of an EPLD in which the program has to be dumped.After dumping the program we can get the desired sequence by using a logic analyzer.
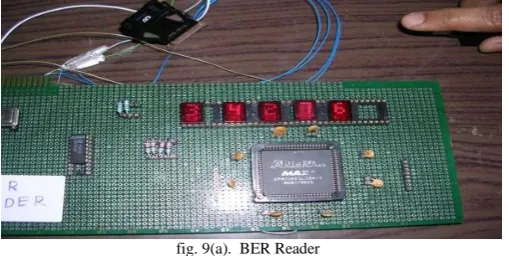
Fig 9(a)and Fig9(b) shows the system performance of the data at the genertor side.Seven segment displays are used for showing the errors
fig. 9(a). BER Reader
The number of errors that are present are displayed by using a 7segment display.fig9(a) is showing the errors that are present while the data is transmitting by unsing the display
fig. 9(b). BER Reader
fig. 10. Output of frequency reader
Fig10 is the hardware part of a fequency reader which is used for knowing the frequency at which he data is received
IX. VIII.CONCLUSION
ISSN(Online) : 2319 - 8753
ISSN (Print) : 2347 - 6710
I
nternational
J
ournal of
I
nnovative
R
esearch in
S
cience,
E
ngineering and
T
echnology
(An ISO 3297: 2007 Certified Organization)
Vol. 4, Issue 4, April 2015
encoding and decoding techniques are also used to avoid phase ambiguity.
REFERENCES
[1] S.W Golomb, “Digital communications with space applications” [2] Seymour Lip Schulz, Theory of probability
[3]G.E.Lewis, “Communications Services Via Satellite”.
[4]Walter L.Morgan, GaryD.Gordon, “Communications Satellite Hand Book”
[5]Bruce R.Elbert, “Ground segment and Earth Station Handbook”.
[6]ZainalabedinNavabi, “VHDL Analysis and Modeling of Digital Systems”. [7]G.Maral and M.Bousquet, “Satellite Communications Systems”.