ABSTRACT
XIA, SIBEI. Sizing Systems Created Using SizeUSA Data for Three Body Shapes. (Under the direction of Dr. Cynthia Istook).
Literature reviews showed that consumers were not satisfied with the fit of garments
sold in stores, primarily due to outdated sizing systems used by companies and the limited
number of sizes being produced. Classifying body shapes has been combined with pattern
making to improve the fit of apparel and ASTM has updated its standards to cover curvy and
straight body shapes. However, the shape definitions used in the studies were fuzzy.
Simmons developed a software, Female Figure Identification Technique (FFIT©) for Apparel,
that can classify people into nine body shapes with clear criteria. Newcomb (2006) used the
FFIT© and developed a sizing standard for the rectangle body shape based on SizeUSA data.
It turned out that the rectangle body shape standard was better at serving the rectangle body
shape subjects than the ASTM D5585-95 standard (D13 Committee, 1995a). This study was
continuous with Newcomb's study and expanded the number of body shapes to three.
The purpose of this study was to create a sizing system included sizes designed for
different body shapes based on SizeUSA anthropometric data. A total of 6308 subjects in
SizedUSA data were classified into a training set and a validation set. Subjects in both sets
went through the same process. The results from the validation set were then compared with
the results from the training set to test the repeatability and stability of the sizing system
creation method. The sizing system creation process included natural log transformation,
principle component analysis (PCA), multivariate linear regression analysis, size range
A total of 62 key measurements were transformed into their natural log values.
Within the 62 transformed variables, 60 variables, along with two variables not transformed
went through the PCA and determined two principle components (PCs). Two transformed
variables were excluded from PCA for too many missing values. These Principle
Components were used as independent variables in the multivariate linear regression to
predict all 64 measurements. Multivariate linear regressions were done on the rectangle body
shape, the spoon body shape, the bottom hourglass body shape and the whole data set with no
shape specification. Sizes were determined by classifying PCs within ranges set by mean
value and standard deviation value (SD). PC2 was divided into 3 groups evenly with a range
set to [mean-2SD, mean+2SD]. PC1 was divided into 14 groups evenly with a range set to
[mean-2.3SD, mean+2SD]. The center PC values for each sizes were applied to formulas
created in multivariate linear regression analysis to calculate measurement values. Calculated
values were then rounded to the nearest 1/8".The created sizing system was then compared
with ASTM D5585-11e1 (D13 Committee, 2011a).
Analysis of the results showed that the method used to create the sizing system was
reliable and repeatable. The created sizing system provided a better fit for the subjects from
the validation set than the ASTM D5585-11e1 standard did. Thus, it is necessary to include
body shape information in sizing systems. This was an important research effort for apparel
manufactures, as it demonstrated the importance of body shape classification, as well as
© Copyright 2013 Sibei Xia
Sizing Systems Created Using SizeUSA Data for Three Body Shapes
by Sibei Xia
A thesis submitted to the Graduate Faculty of North Carolina State University
in partial fulfillment of the requirements for the degree of
Master of Science
Textiles
Raleigh, North Carolina
2013
APPROVED BY:
________________________________ ________________________________
Dr. Cynthia L. Istook Dr. Lori Rothenberg
Committee Chair
DEDICATION
BIOGRAPHY
The author, Sibei Xia, was born in China in 1990. She received her Bachelor of
Engineering degree in 2011 from the Fashion, Art and Design Institute, Donghua University,
majoring in Fashion Design and Engineering. She enrolled at North Carolina State University
in the Fall of 2011 as a graduate student in Textile and Apparel, Technology and
Management Department. She had been a teaching assistant for two years. With the help of
wonderful faculties and friends in NCSU, she got used to the new culture fast and was able to
follow her passion for apparel technology. She is currently completing her graduate
requirements for the master degree in Textile Technology and Management and hopes to
ACKNOWLEDGMENTS
This dissertation could not have been completed without the help of many people, who I
would like to acknowledge and thank for their assistance.
First and foremost, I would like to thank my committee for their important and useful
guidance throughout my research and writing process
Dr. Cynthia L. Istook'. It is my fortune to have you as my advisor and mentor. You
have believed in me to provide me with opportunities in teaching where I gained a
lot of experience. Thank you for trusting me and supporting me since I have been to
the United State. I hope to remain friends and continue to learn from you in the
future.
Dr. Trevor J. Little: Thank you for being patient to answering a lot of my questions.
Without your help, I could not be able to know many technologies. I hope I can
learn more things from you in the future.
Dr. Yingjiao Xu: Thank you for helping me generate ideas and methods at the
beginning stage of my thesis study. Also, thank you for helping me to get used to the
new culture in both academic and daily life.
Dr. Lori Rothenberg: Thank you for being my committee member. Your thoughtful
advice and feedback improved my research design methods and final output.
Prof. Debra McLendon: Thank you for tolerating all mistakes I have made. Without your
support, I could not be a good teaching assistant. Thank you for explaining things with a
Dr. Kate Carroll: Thank you for sharing a lot of resources with me. Thank you for
teaching me and telling me how to teach others.
Ms. Lisa Fitzmorris: Thank you for studying with me last summer. Thank you for the
time you have spent for editing this paper. Thank you for thinking about me and keeping
me in touch. Lots of thanks. I hope we can remain friends in the future.
Mr. Robert Cooper: Thank you for dealing with all the paper work for me.
Last, but certainly not least, I would like to thank my family and friends for their continued
love and support throughout my education
Xia's Family: Many thanks to my dearest parents. You always trust me and give me
great support. I miss you so much.
Liwen Zou: Thank you for looking after me. Thank you for giving me a lot of advise
for this paper. Thank you for helping me get through the hardest period of this study.
You are a friend like a family member.
Fangfang Zhang: Thank you for listening to my complaints and understanding me.
TABLE OF CONTENTS
LIST OF TABLES ... ix
LIST OF FIGURES ... xi
CHAPTER ONE: INTRODUCTION ... 1
Rationale ... 3
Research Questions ... 3
Limitations ... 4
Definition of Key Terms ... 4
CHAPTER TWO: REVIEW OF LITERATURE ... 6
Sizing Seeking Opportunities in Mass Customization... 6
Fitting Issues of RTW Sizing System ... 6
Trend of Mass Customization ... 8
Mass Customized Sizing ... 9
Methods Used to Create Body Sizing Systems... 14
Preparing Data ... 15
Control variables ... 16
Proportion ... 18
Intervals and Size number ... 19
Secondary Dimensions... 21
Labeling ... 22
Female Figure Shapes ... 22
History of Sizing Systems ... 24
1851-1900: Sizing Grew with Ready-to-Wear ... 29
1901-2000: Sizing Bloomed with Mass Production ... 32
2001-2013: Sizing Combined with Mass Customization ... 33
Anthropometric Surveys and Sizing Standard in the U.S. ... 33
CHAPTER THREE: METHODOLOGY ... 43
Research Questions ... 43
SizeUSA Data Collection ... 44
Sampling Strategy ... 44
Data Description ... 46
Data Analysis ... 50
Research Question 1 ... 50
Research Question 2 ... 57
CHAPTER FOUR: RESULTS ... 59
Development of Sizing System ... 59
Prepare Data ... 59
Principle Component Analysis ... 63
Linear Regression ... 66
Size Range and Intervals ... 68
Compare Training Set and Validation Set ... 70
Compare sizes from different body shape categories ... 70
Compare Created Sizing System with ASTM D5585-11e1 ... 74
Summary of Results ... 76
CHAPTER FIVE: DISCUSSION, CONCLUSIONS AND FUTURE RESEARCH ... 79
Brief Review of Study ... 79
Discussion of Results ... 80
Discussion of the Development Process of the Sizing System ... 80
Discussion of the Comparisons and Sizing Strategy ... 82
Conclusion and Implication ... 87
Future Research ... 87
REFERENCES ... 89
APPENDICES ... 99
Appendix B: Errors deleted from SizeUSA data ... 104
Appendix C: Histograms of transformed vales compared to values before transformation ... 105
Appendix D: Codes for SPSS analysis ... 107
Appendix E: Coefficients results of PCs with all subjects (without consideration of shapes)... 109
LIST OF TABLES
Table 1. Comparison of PS 42-70 petite, PS 42-70 Misses and PS 42-70
Misses-tall sizing standards. ... 39
Table 2. Comparison between ASTM D5585-11e1 and ASTM D5585-95. ... 41
Table 3. Calculation methods of drop values... 52
Table 4. An example of natural log transformation ... 55
Table 5. List of key variables used in the study ... 60
Table 6. Options of demographic survey and body shape categories ... 61
Table 7. Comparison of measurements' skewness before and after transformation ... 62
Table 8. Comparison of PCs between the training set and validation set ... 65
Table 9. Number of subjects of the top three body shapes ... 66
Table 10. Variables with adjusted R2 values smaller than 0.3 ... 67
Table 11. Pearson correlations matrix of PCs and drop values ... 68
Table 12 R2 result of regressions to predict drop values ... 68
Table 13. Sizes labeling rules ... 69
Table 14. The number of subjects fell within each size group ... 71
Table 15. Comparison between predicted values and real mean values ... 72
Table 16. Comparison between results from the training set and the results from the validation set ... 72
Table 17. Comparison of predicted values between different body shapes ... 73
Table 18. Compare Created sizing system with ASTM D5585-11e1 with 2 criteria variables ... 74
Table 19. Compare Created sizing system with ASTM D5585-11e1 with 3 criteria variables ... 75
LIST OF FIGURES
Figure 1. The final wireframe and the final cutting pattern of Yuchun's 3D to 2D
flattening method. Source: Yunchu & Weiyuan, 2007, pp. 343, & 345. ... 10
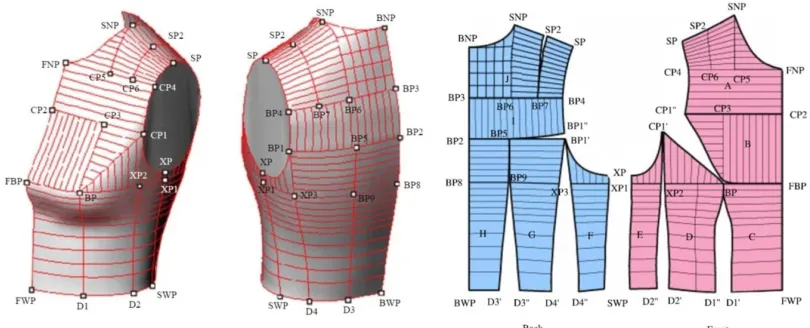
Figure 2. The final block patterns for three body shapes. ... 12
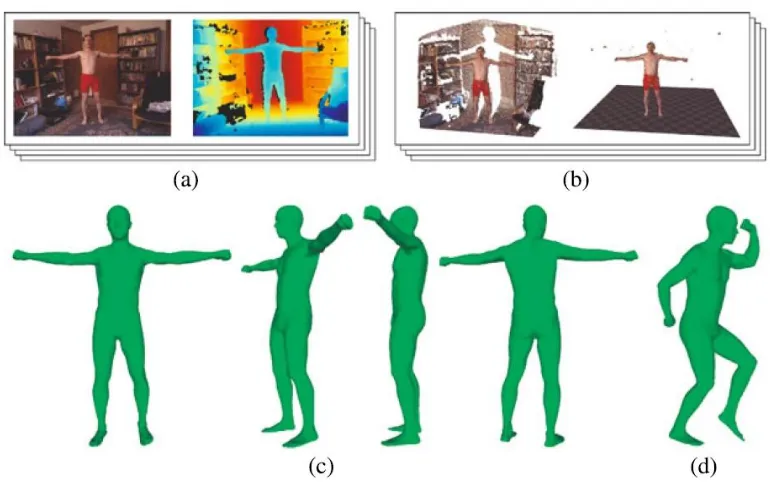
Figure 3. Overview of Kinect body scanning: (a) capture image (b) segment 3D body point cloud (c) recovered pose and shapes from 3D body point cloud (d) recovered body shapes using the SCAPE model presented in the literature. ... 13
Figure 4. Computer aided Design. Source: Lectra, 2013, p. 6. ... 14
Figure 5. Faust's potential size labeling with facing silhouette and measurements. ... 23
Figure 6. Body shapes divided by FFIT©... 24
Figure 7. One of the earliest size tables. ... 26
Figure 8. Graded men's bottom wear Source: Cook, 1826, pp. 24-25. ... 27
Figure 9. A grading system based on a square. Source: Byfield, 1825, plate II. ... 28
Figure 10. Stone's proportional sizing table. Source: Stone, 1897, p. VIIII. ... 31
Figure 11. The average women in O'Brien and Shelton's anthropometric survey. ... 35
Figure 12. Anthropometric surveys and sizing standards in the U.S. ... 37
Figure 13. Missy Petite Avatar Curvy in ASTM D7878. Source: D13 Committee, 2013a, p. 5... 42
Figure 14. The SizeUSA Demographics – Sex. Source: [TC]2, 2004, p.8. ... 47
Figure 15. The SizeUSA Demographics – Scan Location. Source: [TC]2, 2004, p. 39. 47 Figure 16. The SizeUSA Demographics – Ethnicity. Source: [TC]2, 2004, p. 39. ... 47
Figure 17. The SizeUSA Demographics – Age. Source: [TC]2, 2004, p. 39. ... 48
Figure 18. The SizeUSA Demographics – Income. Source: [TC]2, 2004. p. 39. ... 48
Figure 19. The SizeUSA Demographics – Lifestyle. Source: [TC]2, 2004. p. 39. ... 48
Figure 21. The SizeUSA Demographics – Educational Level. Source: [TC]2, 2004. p. 39.
... 49
Figure 22. The SizeUSA Demographics – Weight Perception. Source: [TC]2, 2004. p. 39... 49
Figure 23. The SizeUSA Demographics – Current Employment. Source: [TC]2, 2004. p. 39... 50
Figure 24. The sizing system creation steps ... 56
Figure 25. Histogram comparison between A2Waist and transformed lnA2Waist ... 62
Figure 26. Scree plot of pre-PCA ... 64
Figure 27. Total variance explained by principle components in pre-PCA ... 65
CHAPTER ONE: INTRODUCTION
Sizing systems were originally developed for ready-to-wear (RTW) and mass
production. Body sizing systems and garment sizing systems are two subgroups of sizing
systems. A garment sizing system begins with a body sizing system and is tested on
prototypes for fitting. The study of standard body sizing systems began in the first half of
twentieth century and bloomed in the late twentieth century.
A good sizing system benefits both the consumers and the manufacturers (Chen-Yu,
Williams, & Kincade, 1999). However, studies have shown that consumers were not satisfied
with the fit of apparel (Alexander, Connell, & Presley, 2005; Anderson-Connell, Ulrich, &
Brannon, 2002; Goldsberry, Shim, & Reich, 1996; [TC]2, 2004). One reason is the grade
rules companies have used are outdated (Ashdown, 1998; Ashdown & Loker, 2010; Shin &
Istook, 2007; Workman & Lentz, 2000). Another reason is the number of sizes provided by
RTW is limited. An updated and more flexible sizing system is needed.
For the past few years, the clothing industry is turning towards mass customization.
This trend is the beginning of the third wave defined by Toffler in his famous book The Third Wave (Toffler, Longul, & Forbes, 1981). A goal of mass customization is to give a better fit at a low cost and fast speed (Loker, 2007). Mass customized sizing has been considered a
strategy for this. There are three ways of making customized fit patterns: 1)
three-dimensional to two-three-dimensional flattening (Hinds, McCartney, & Woods, 1991; Kwong,
2004; Okabe, Imaoka, Tomiha, & Niwaya, 1992; Yunchu & Weiyuan, 2007); 2) automatic
2002; Song & Ashdown, 2012). A good method of creating sizes based on anthropometric
data is critical for the alteration method.
Collecting anthropometric data in the beginning was costly and time consuming. The
development of the 3D body scanner in 1990 shortened the measuring time from hours to
minutes. Large scale anthropometric surveys have been done in the UK, the USA, Greece
and Japan with 3D body scanners. The human body changes as time goes by. People tend to
be taller and weigh more compared to 30 years ago, For this reason, ASTM has suggested
that body sizing systems need to be updated every 10 years. Keeping track of the growth of
population is important for updating body sizing systems. SizeUSA, conducted in 2002 is the
most recent large scale anthropometric survey in the United States. Several studies have been
done on the SizeUSA data (Kim, Pyun, & Choi, 2010; Lee, Istook, Nam, & Park, 2007).
Newcomb (2006) created a sizing standard for the rectangle body shape person with
SizeUSA data, using the waist measurement as the only predictor. It would be interesting to
see how the standard looks like with multi-predictors and for other body shapes.
Kinect invented in the first decade of 21st century, is trying to break the limitation of
scanning place. It is blowing a wind of evolution for the 3D world. The access to 3D body
data in the future could be more accessible than today. This will bring opportunities as well
as challenges. How can we analyze the data and make full use of it is a question that apparel
companies have to face in the near future. Thus, it is important to study the sizing creation
Rationale
The study of consumers has revealed that consumers are not satisfied with the fit of
apparel. Reasons identified by researchers include the outdated grading rules and the limited
number of sizes for production. SizeUSA has the most recent anthropometric data. A sizing
system created based on this data would be more accurate and practical. The apparel industry
is heading towards mass customization. Altering from standard sizes is a way to approach
mass customized fit and this relies strongly on a good sizing system. This addressed the need
for creating a sizing method. Many studies have been done on the use of anthropometric data
to generate sizes with different methods. It would be interesting to study each of the methods
and come up with a method that combines the advantages of other methods.
The result of this study will lead to a better understanding of the value of
anthropometric data and how a flexible body sizing system can be created from
anthropometric data. With the comparison of different demographic groups, consumers can
be served better.
Research Questions
The goal of this study was to demonstrate a way of using anthropometric data and prove
the value of it. To guide the research, the following questions were developed:
1. Can the SizeUSA data be used to create a flexible women's body sizing system that
will represent a large population?
a) What are the key measurements for a sizing system?
c) What are the key differences between different body shapes that help define a
sizing system?
d) How are the intervals between each size created?
e) How does the created sizing system work, compared to ASTM D5585-11e1?
2. What is a sizing strategy that could be used by the industry based on the analysis of
SizeUSA and body shapes?
Limitations
This study was limited in the following ways:
The created sizing system was only based on analysis of SizeUSA data. Only 3 out of 9
shapes defined by Simmons (2003) in the Female Figure Identification Technique (FFIT©)
for Apparel were studied. Principle Components extracted from the 64 measurements were
influenced by too many variables. A reduction in variables may have led to different results.
Definition of Key Terms
Anthropometry: Refers to the measurement of the human individual. It has been used for the purposes of understanding human physical variation, and in various attempts to correlate
physical with racial and psychological traits.
Sizing system: "A table of numbers which presents the value of each of the body dimensions used to classify the bodies encountered in the population for each size group in the system"
(Petrova, 2007, p. 57).
Rectangle Body Shape: The rectangle body shape represents people whose bust and hip measurement values are fairly equal, and bust-to-waist and hip-to-waist ratios are low
Hourglass Body Shape: The hourglass body shape represents people who have a very small difference in the comparison of the circumferences of their bust and hip, and the ratios of
their bust-to-waist and hip-to-waist were about equal and significant (Simmons et al., 2004).
Bottom Hourglass Body Shape: The bottom hourglass body shape represents people who have a larger hip circumference than bust circumference and the ratios of their bust-to-waist
and hip-to-waist are significant enough to produce a definite waistline (Simmons et al., 2004).
Spoon Body shape: The Spoon body shape represents people who have large difference between hip and waist, and great high hip-to-waist ratio. The bust-to-waist ratio of this body
shape is smaller than that of the Hourglass (Simmons et al., 2004)
American Society of Testing and Materials (ASTM): Formerly known as the American Society for Testing and Materials (ASTM), is a globally recognized leader in the
development and delivery of international voluntary consensus standards (ASTM, 2013).
IBM SPSS Statistics: An integrated family of products that addresses the entire analytical process, from planning to data collection to analysis, reporting and deployment (SPSS, 2013).
Linear Regression: An approach to model the relationship between a scalar dependent variable y and one or more explanatory variables denoted as X.
Bespoke: A British English word that means that a clothing item was made to a buyer's specification (personalized or tailored). It was applied to only men's tailored clothing in old
times. It now generally includes footwear and other apparel and implies measurement and
CHAPTER TWO: REVIEW OF LITERATURE
To help understand the importance of a sizing system and the way sizing systems were
built, literature was reviewed on sizing and mass customization, methods used to create a
body sizing system, female figure shapes, the history of sizing systems and anthropometric
surveys and sizing standards in the U.S.
Sizing Seeking Opportunities in Mass Customization
A sizing system is a product of ready-to-wear (RTW). The limited number of sizes that
RTW can produce has forced consumers to make a sacrifice in garment fit. Although
customization is oriented to an individualized fit, the cost of making customized patterns is
relatively high. Mass customization is a combination of RTW and customization and can
offer a better fit than RTW with a lower cost than bespoke. Mass customized sizing is the
sizing strategy for mass customization. The following is a review of RTW sizing and fitting
issues, the trend of mass customization, mass customized sizing studies and some advanced
technologies.
Fitting Issues of RTW Sizing System
A sizing system is defined by Petrova (2007, p. 57) as "a table of numbers which
presents the value of each of the body dimensions used to classify the bodies encountered in
the population for each size group in the system". Sizing systems were originally developed
to help ready-to-wear (RTW) manufacturers predict the fit of their potential consumers. They
have been studied for decades. Even though much work has been done by companies and
researchers to improve sizing systems, studies and reports continue to show that a large
Evidence of women's dissatisfaction with the fit of ready-to-wear can be found in both
academic literature and popular literature (Anderson-Connell et al., 2002). Alexander (2005)
noted that 54% of the respondents were somewhat satisfied to mostly dissatisfied with the fit
of RTW. This result is consistent with Goldsberry's study and Kurt Salmon Associates'
survey. Goldsberry et al. (1996) stated that 70% of females over 55 years of age indicated
dissatisfaction with the fit of RTW. Kurt Salmon Associates' survey found that more than 50%
of women could not achieve good fit with RTW clothing ([TC]2, 2004).
Fit is related to ease and to body measurements. Ease can be divided into fit ease and
style ease. It is linked to a consumer's fit preference and varies from person to person. Ease is
relatively subjective (Alexander et al., 2005). Body measurements, on the other hand, are
more objective. However, the human body shape has not remained constant over the years
(Ashdown & Loker, 2010). The National Health and Nutrition Examination Survey
(NHANES) showed that the average body mass index for adults has increased from 22.2 to
26.8 since 1962 (Ogden, Fryar, Carroll, & Flegal, 2004). The formula for calculating BMI is
weight (lb) / [height (in)]2 x 703 and BMI is correlated to body fat (“Healthy Weight,” n.d.).
Re-evaluating consumers' body measurements is important for ensuring a good fit over time
(Ashdown & Loker, 2010).
A common way used in the USA for forming a sizing system for ready-to-wear is to
create a size based on the ideal consumer. This size is then transformed it into multiple sizes
with incremental grading which has been derived from outdated standards (Ashdown, 1998;
Ashdown & Loker, 2010; Shin & Istook, 2007; Workman & Lentz, 2000). Because many
to choose and are forced to try on numerous sizes and brands before they find one that fits
them. This is time consuming and causes a significant challenge for e-ecommerce, since bad
fit leads to a high return rate (Ashdown & Loker, 2010).
Chen-Yu (1999) found that good fit product increases consumers' loyalty to the
company and helps retain customers. It is imperative for companies to solve fit issues if they
want to stay competitive. Studying updated body measurement data is a good start. With the
development of 3D scanning techniques, it is easier for companies to have access to a large
number of 3D anthropometric data. How can a company deal with this data and make use of
it all? The study of how to use anthropometric data, thus, is necessary and valuable.
Trend of Mass Customization
Pine (1993) defined mass customization as a strategy that uses information and
manufacturing technology to efficiently produce goods with maximum differentiation and
low-cost production. Because clothing products are designed to fit consumers' preference and
needs, the clothing industry has naturally become an industry in which mass customization is
applied (Anderson et al., 1997; Choy & Loker, 2004; Kamali & Loker, 2002; Lee & Chen,
1999; Loker, 2007).
Toffler mentioned in his book that the clothing industry was turning its tend towards
mass customization which was the beginning of the third wave. The third wave was oriented
at producing "partially or completely customization products", while the first wave was
civilization and the second wave was oriented to "the long 'run' of millions of identical,
A traditional customized company, Tom James, had a $266M sales growth in 2012
(Tom James Company, 2013). A newly founded customized apparel company, Trumaker,
received $1.9M in funding from Venrock and others and plans to bring made-to-measure to
the masses (Taylor, 2013).
Consumers are more knowledgeable and seek more personal products than before. A
shorter product life cycle, increased product varieties, and greater customization are the trend
of the apparel industry (Peppers & Rogers, c2011; Simonson, 2005). Mass customization is a
strategy that can build a stronger relationship between consumers and companies, reduce
waste, improve productivity and increase consumer satisfaction (Ko & Kincade, 1998;
Warkentin, Bapna, & Sugumaran, 2000).
Mass Customized Sizing
The clothing industry was one of the earliest adopters of mass customization. But the
development of mass customization in the clothing industry seems very slow, compared to
the development of mass customization in the electronics industry. An important aspect that
the clothing industry has tried to customize is fit. Researchers who work to solve this
question can be divided into three groups. They are 1) automatic two-dimensional drafting, 2)
three-dimensional to two-dimensional flattening and 3) altering from tested sizes.
Customized-sizing emphasizes producing individualized fit with advanced technology at a
low cost and fast speed (Loker, 2007). Compared to the first two methods, altering from
standard sizing tends to be more reliable and repeatable.
Automatic two-dimensional drafting is approached by linking one-dimensional
can be altered based on an individual measurements chart. Kang and Kim (2000) developed a
pattern drafting and grading system by formulating and coding this drafting principle.
Accurate measurements are needed for generating well fitting patterns.
Three-dimensional to two-dimensional flattening is a process that transforms curved
surfaces into a plane (Kwong, 2004). Okabe et al. (1992) developed a flattening method by
first projecting the 3D surface into 2D, adding darts on the 2D pattern and then meshing on
the 2D to simulate the 3D shape. Hinds et al. (1991) created and flattened an offset 3D
surface which simulated the ease of the garment. McCartney, Hinds, Seow, & Gong (2000)
flattened the 3D surface that contained darts and gussets and this was more realistic.
Yunchun & Weiyuan (2007) flattened a 3D prototype by slicing 3D surfaces into stripes,
flattening the stripes by keeping the same edge length and then re-pasting them back together
into 2D (Figure 1). The 3D to 2D flattening method has high requirements for 3D models.
Last but not least is the method where alterations are made from tested sizes. Altering
patterns was a traditional way to achieve accurate fit for customized apparel, and was time
consuming and required experience (Istook, 2002). With the help of computer aided design,
pattern alteration requires less effort. Different from drafting methods, alterations are only
made on measurements which are of key importance for the fit of a specific garment (Istook,
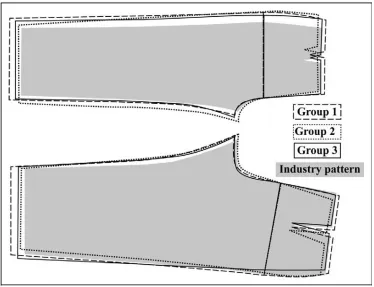
2002). Song & Ashdown (2012) developed an automated custom-made pants system. These
alterations were made to fit individuals on tested pants patterns for three body shapes (Figure
2). It turned out that the altering method which incorporated shape information into block
patterns resulted in a better fitting garment. Because the altering method is based on sizes or
patterns that have been pre-tested and proved, the study of body dimensions and shape are
important.
Technology Possibilities
Three dimensional technology and computer aided design (CAD) are two techniques
that are changing the way apparel the industry thinks and works, especially in the production
development stage.
Since the invention of the 3D body scanner, researchers have had technology that helps
them understand the shape of the human body and that offers them an easy way to collect and
store anthropometric data (Chun, 2007). Anthropometric data for the SizeUSA, the SizeUK,
the French National Size Survey and Size Korea were all collected by a 3D scanner. Without
Figure 2. The final block patterns for three body shapes. Source: Song & Ashdown, 2012, p. 323.
Now the 3D scanner is moving towards a less costly and more portable model. The
invention of Kinect by Microsoft made 3D scanning available at home (Figure 3), even
though the technique is not yet perfect. Anthropometric data will be more accessible in the
future.
CAD is a technique that has been talked about and used for decades. Some popular
apparel CAD software packages include Kaledo, Adobe Illustrator, Photoshop, Modaris,
Accumark and Optitex. Design stages like style design, pattern making, grading, marking and
Figure 3. Overview of Kinect body scanning: (a) capture image (b) segment 3D body point cloud (c) recovered pose and shapes from 3D body point cloud (d) recovered body shapes
using the SCAPE model presented in the literature. Source: Weiss, Hirshberg, & Black, 2013, p. 101.
time. Creating 3D avatar is one of the most advanced CAD techniques. It is based on a 3D
body model that has been built in a 3D capable software and then generally used in pattern
making software to check the fit of patterns. For example, the pattern making software
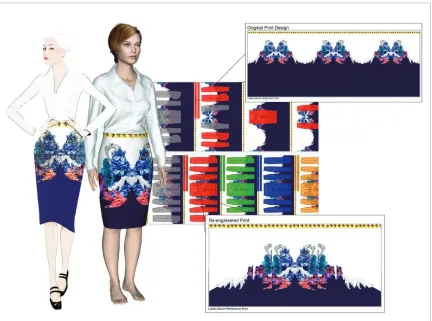
Modaris by Lectra can "sew" 2D patterns and fit it on a 3D model (Figure 4). A 2D avatar is
already available on some companies' websites to help consumers make decisions about
design and styles. It would be interesting to see a 3D avatar online which can both
Figure 4. Computer aided Design. Source: Lectra, 2013, p. 6.
Methods Used to Create Body Sizing Systems
The purpose of creating a sizing system is to help manufactures produce ready-to-wear
clothes that will fit the potential consumer as well as possible and at the same time, allow
manufacturers to make a profit (Petrova, 2007; Winks, 1997). A good sizing system benefits
both the company and the consumers.
Sizing systems can be classified as either a garment sizing system or a body sizing
sizing system is the estimation of the body dimensions. The garment sizing system includes
both body information and design ease. Because ease is largely influenced by the garment
style and the consumer's personal preference, recently published sizing systems are body
sizing systems.
To create a body sizing system, a couple of aspects need to be considered. 1) the
proportion of the population to be covered; 2) the number of sizes to be designed; 3) the size
interval; 4) the control variables to classify size groups; 5) the secondary dimensions to help
construct garments; and 6) labeling to avoid miscommunication (Petrova, 2007). Creating a
body sizing system often follows the process of collecting and preparing anthropometric data,
picking control variables, deciding a size range for each control dimension (deleting outliers),
developing a subgroup population based on intervals and size numbers, calculating secondary
dimensions and, finally, labeling the sizing system. The following discusses some common
methods used in each stage of creating a body sizing system.
Preparing Data
In order to collect body data, an anthropometric survey is designed and conducted. The
number of big scale anthropometric surveys in history around the world is countable because
"the cost of conducting a statistically significant manual sizing study is astronomical" ([TC]2,
2004). Even though we now have the body scanner to help us save time on measuring, it is
still costly. Body scanners can cost up to a hundred thousand dollars.
A good survey should be able to get a representative sample of the target population
which requires thousands of subjects to meet the criteria of statistical validity ([TC]2, 2004).
demographic data is a valuable resource for comparison and advanced analysis, because the
human body differs between ethnic groups, age groups, countries, etc. The most commonly
used body dimensions are height, front waist length, back waist length, cervical height, waist
height, hip height, shoulder width, out-seam, arm length, neck girth, bust girth, waist girth,
hip girth, thigh girth, knee girth, ankle girth, upper arm girth and wrist girth (O’brien &
Shelton, 1941; [TC]2, 2004).
Because anthropometric surveys have many steps and requires the effort of many
people over a long period, there are always some missing values and sometimes a few errors
within the data. One way of dealing with missing values is deletion. For example, one
method is list wise deletion. In the list wise deletion method, only cases with available data
on each variable are analyzed (Humphries, 2013). The advantage of this method is that it is
simple, but because anthropometric surveys always contain a lot of variables, the proportion
of deletion can be large, which reduces the statistical significance. Hsu & Wang (2005) used
the list wise deletion method and the number of subjects was reduced from 610 to 590. The
other way of dealing with missing values is by replacing the missing value with its estimation,
for example, using the series mean method. In the series mean method, the missing value is
replaced with the mean for the entire series. Esfandarani & Shahrabi (2012) used the series
mean algorithm to replace the missing values when they were preparing data for a suit sizing
system.
Control variables
Control variables are the body measurements which are used to classify size groups
variables should be the measurements that best describe the body size for each individual.
Because the body shape variation in the population is large and the number of control
variables is limited, the selected dimension should be representative and predictive of other
non-control variables. Secondly, they should also be easy to measure, because consumers
need to be able to use their own measurements to find the right sizes. Thirdly, if more than
one measurement is chosen as the control dimension, there should not be too much
correlation between the control variables. This is because when control variables are
controlling sizes, the whole population is first divided into groups based on the distribution
of the primary control dimension. Then, within each group, subgroups are classified based on
the distribution of the second control dimension. If the two control variables are correlated to
each other, some subgroups will be empty, which is against the efficient goal of sizing. Last
but not least, control variables may change when a sizing system is designed for different
styles.
A statistical method that is usually used to find control variables is called the
Principle-Component Analysis (PCA). It is a method of Factor Analysis and the purpose of it is to
remove redundant variables from the data, replacing the entire data with a smaller number of
uncorrelated variables (SPSS Statistics, 2011). The following is cited from SPSS about how
PCA works.
The principal components method of extraction begins by finding a linear
these components can be used to replace the original variables. (SPSS Statistics, 2011, online help)
Guan (2012) used PCA to reduce 12 dimensions into three principle components (PCs)
in a truck driver anthropometric study. Because sometimes principal components with small
eigenvalue may be as important as those with a large variance (Jolliffe, 1982) , Esfandarani
& Shahrabi (2012) did a test on the suit sizing chart with a different numbers of PCs. Loss of
fit for each cluster was calculated and it was found that two components were the best choice
in that situation.
The PCs extracted from the PCA can sometimes be represented by measurements,
which can be classified as principle measurements. When selecting representatives for the
PCs, practical situations must be considered. For example, O'Brien and Shelton (1941)
found weight to be a principle measurement, but stores and homes often do not have scales
available. This has limited the expansibility of their theory. With the consideration of
predicting both the top part and bottom part of the body, Newcomb (2006) used waist
measurement to represent her PC1. This was the only PC she extracted, while creating a
sizing system for the rectangle body shape which was more practical and applicable. Another
example is when Hsu & Wang (2005) used waist girth to represent the girth factor, even
though hip girth was more closely related to the girth factor. Waist girth was actually the
most important factor for pants design.
Proportion
When designing for the majority of the population, a sizing system is usually set to
population that is covered by the sizing system is called the accommodation rate of the sizing
system (Petrova, 2007). Even within the sizing system, not all sizes will be produced. Only
those garments with sizes which represent majority of the target consumers will be
manufactured. The actual production accommodation rate is between 65% and 85% (Petrova,
2007). This means no matter how accurate the sizing system is, at least 15% to 35% of the
population will not be able to find the right size, and this gives manufacturers an opportunity
for garment customization.
When the sample size is large, percentiles of the control variables or the PCs can set the
size range. The 90th percentile of body mass index (BMI) was used in Song & Ashdown's
research on body shape categorization (2011). However, percentile values are not additive. A
subject with a 95-percentile height does not necessary have a 95-percentile waist girth. Guan
et al used a 95% accommodation level with a 5% exclusion for the ellipsoid created by the
three orthogonal PCs (2012).
Intervals and Size number
The control variables are divided into small scales and are ranges for each size. The
increments are called the size intervals. The interval can be either a constant or a variable.
The size number is determined by the size range and the intervals. For a garment sizing
system, the value of the interval depends on the absolute value of the control variables, the
fabric properties, and the tolerance level of consumers for the control variables (Ashdown &
DeLong, 1995; Petrova, 2007). As mentioned before, the number of designed sizes is not
that contain a large number of people or sizes that fit within the fixed accommodation rate
will be manufactured (Petrova, 2007).
There are two types of methods for determining intervals. One method is to set
intervals according to convenience, common practices and fit consideration (Petrova, 2007).
Mpama, Azariadis, & Sapidis (2010) classified the population into seven body types by
setting the intervals of the drop value between chest girth and waist girth manually to a
constant value of 4cm. Gupta & Gangadhar (2004) classified sizes by using the standard
deviation as the interval for height. The other method is to use a using statistical procedure.
For example, the K-means cluster analysis, can be used to set and optimize the intervals
automatically (Petrova, 2007).
SPSS defines the K-means analysis as a tool designed to assign cases to a fixed number
of clusters whose characteristics are not yet known but are based on a set of specified
variables (SPSS Statistics, 2011). The K-means cluster is most useful for classifying a large
number of cases. In K-means cluster analysis, 1) the initial cluster centers are chosen by the
computer or you design your own initial cluster center; 2) each subject is examined and
assigned to the closest cluster center depending on the distance; 3) the centroid position is
then recalculated and the subjects are re-assigned; 4) the centroid position continues to
recalculate until no changes are necessary and the final cluster center is achieved (“k-Means
clustering Algorithm,” 2013). The K-means cluster center is very sensitive to the initial
cluster centers (Bradley & Fayyad, 1998). The number of sizes has to be pre-defined.
Sometimes you have to rerun the analysis a couple of times with different initial centers and
Song & Ashdown (2012) applied K-means cluster analysis with three PCs and two
z-scores as variables of 2,488 female subjects with the number of clusters fixed on two, three
and four. Finally, the three clusters result was picked as the best one. To help identify each
new subject's body shape, discriminant analysis (DA) was performed. DA attempts to find
discriminants among variables that provide maximum separation between clusters (Taylor,
1998).
Secondary Dimensions
Patterns cannot be drawn only with control variables. Secondary dimensions are
necessary to describe the detail of a body (Petrova, 2007). Secondary dimensions usually
have a strong relationship with the control variables and can be calculated by them.
The statistical method often used to calculate secondary dimension functions is called
linear regression. (SPSS Statistics, 2011) described linear regression is used to model the
value of a dependent scale variable based on its linear relationship to one or more predictors.
Predictors here refer to the control variables. A secondary measurement y is calculated by
control variables xi1...xip using formula . The variable p is the number of control variables. The linear regression model assumes that the error term has
a normal distribution with a mean of 0, the variance of the error term is constant across cases
and independent of the variables in the model and the value of the error term for a given case
is independent of the values of the variables in the model and of the values of the error term
for other cases (SPSS Statistics, 2011). Newcomb (2006) used linear regression to predict
bust, high hip, hip, upper arm and thigh max with waist as the predictor. Koblyakova (1980)
linear regression. The formula used in quadratic regression is
.
Labeling
The sizing system is not complete until it is coded and labeled. Most ASTM standards
labels sizes with a number from 00 to 20. Some companies use bust measurements to label
the sizes. Knit wear is often labeled as small, median, and large. Top wear and bottom wear
have different labeling systems. Outwear and underwear have different labeling systems.
Consumers often get confused with all these labeling systems or methods. Faust & Carrier
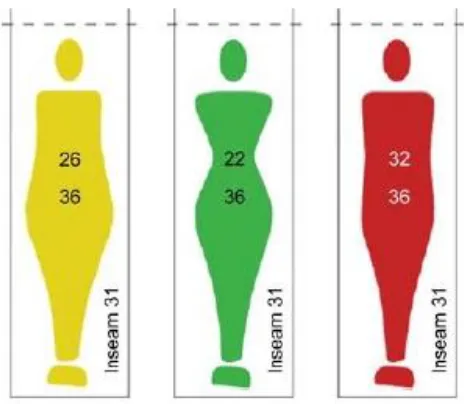
designed a labeling system with a graph illustrating the silhouette (Figure 5) which would
"not only convey better information but also be highly predictive of the garment (pants in this
case) that women would find fitting"(2010, p. 122). Female Figure Shapes
The early body shape studies, or "Somatotyping" defined by Sheldon (1970), were mostly
focused on exploring the relationship between the morphology and the psychology of various
people (Devarajan, 2004; Simmons, 2003). Douty was the first to combine shape and apparel
fit together. She developed a method that she called "visual somatometry" which classified
body types by the body silhouette (Douty, 1968). Later on, pattern making and grading
researchers started to combine sizes with shapes. Words like junior/misses/women,
petite/regular/tall, pear/cone/ruler/apple and V frame/H frame/X frame/O frame were used to
Figure 5. Faust's potential size labeling with facing silhouette and measurements. Source: Faust & Carrier, 2010, p. 122.
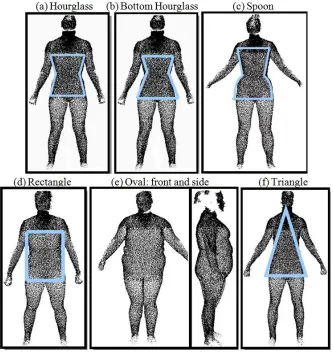
Research done by Simmons et al. categorized body shapes in a 3D view by calculating
and grouping the drop value of bust to waist, hips to waist and bust to hip, along with ratio of
high hip to waist (2003, 2004). Nine body shapes were extracted and they were rectangle,
spoon, hourglass, top hourglass, bottom hourglass, triangle, inverted triangle, oval and
diamond (Figure 6). A software called Female Figure Identification Technique (FFIT©) for
Apparel was coded to determine the shape of individuals. The FFIT© was then verified by
Devarajan (2004) with the method of multivariate statistical methods of discriminant analysis
and Multivariate Analysis of Variance (MANOVA). This study found that there was a
significant difference between each body shape. Later, the FFIT© was used to define the
Figure 6. Body shapes divided by FFIT©. Source: Simmons, 2003. pp. 107, 113, 116, 121, & 124.
History of Sizing Systems
Godley (1997) believed that it was not the invention of the sewing machine, but the
development of standard sizes that prompted the development of ready-to-wear.
1800-1850: The Begin of Sizing
Before the nineteenth century, most garments were bespoke garments (custom-made
books for simple garments by the end of the eighteenth century (The Society of Adepts in the
Profession, 1796). The earliest sizes were proportionally scaled from the smallest ones to the
largest ones. The East India Company began the production of the first large-scale
ready-made goods in England in the late 17th century (Lemire, 1984). However, it was not until the
second half of the nineteenth century that simple ready-made garments started to be
manufactured by shop-keepers (Wray, 1957).
The Napoleonic Wars from 1803 to 1815 brought demand for ready-to-wear army
clothing. This increased the need for sizing systems and grading (Aldrich, 2007). The simple
grading method could not fulfill the growing needs. Therefore, lots of tailors' drafts were
published during the first half of the nineteenth century (Aldrich, 2000). Some drafts
contained sizing charts and grading methods. These charts and methods were very important
for the later more sophisticated pattern making and grading methods (Aldrich, 2007).
Aldrich categorized all cutting methods into three groups: the divisional system, the
direct system and the combination system (Aldrich, 2007). The divisional system is a system
that uses one or two major measurements to calculate the other measurements proportionally.
The direct system uses measurements with direct reference to the body and the garment
measurements. The combination system is a system that combines the two former systems.
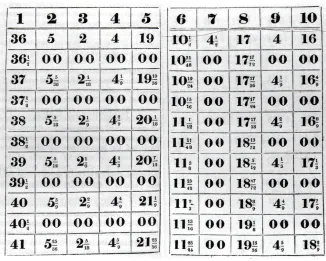
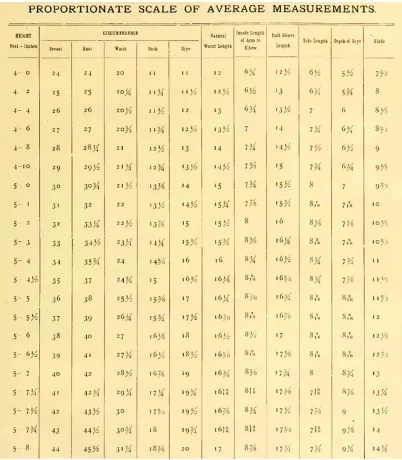
In 1815, Benjamin Read, who used the divisional system method, published The
Proportionate and Universal Table (Figure 7). It was one of the earliest size tables (Aldrich,
2007). The table had ten sizes with bust measurements ranging from 36" to 41". The other
measurements in the table that were calculated arithmetically were half-back, back neck, side
front edge to shoulder point and diameter for a cloak (Aldrich, 2007; Read, 1815). All
measurements were taken from clothing. Read's sizing table was based only on the
proportion of the bust measurement and was illogical to some other tailors (Hadfield, 1826).
Figure 7. One of the earliest size tables.
Source: Read, 1815 (as cited in Aldrich, 2007, pp. 8-9).
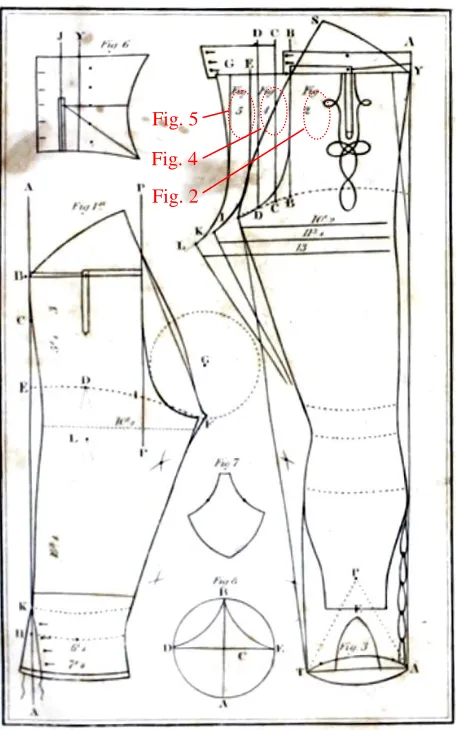
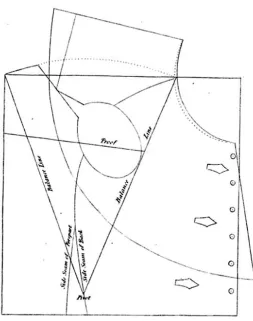
In 1826, Cook and Golding published a combination system in The Tailor's Assistant or Unerring Instructor where direct measurements were used to build one size (Cook, 1826). Other sizes were then graded proportionally. For a pair of breeches, four length and five
width measurements were needed. Figure 8 contains some pattern pieces for bottom wear
the same height measurement but a different waist measurement. The "Figs. 2" in figure 2.8
is for a 34" waist (36" bust) whereas the "Figs. 4" in Figure 8 is for a 44" waist (40" bust) and
the "Figs. 5" in Figure 8 is for a 50"waist (44" bust) (Cook, 1826).
Figure 8. Graded men's bottom wear Source: Cook, 1826, pp. 24-25.
By 1820, tailors who had access to these sizing systems were able to make
ready-to-wear clothing (Aldrich, 2007). For tailors and clothiers who were not skilled enough to draft,
Fig. 5
Fig. 4
full-size patterns and templates were available in the market. In 1822, Wyatt published a
sizing method that could extend patterns through certain lines and angles. In 1825, Byfield
published a grading system which was based on enlarging a 'square' that related to the
patterns (Figure 9).
Figure 9. A grading system based on a square. Source: Byfield, 1825, plate II.
Before 1820, nearly all measurements mentioned in sizing systems and drafting
methods were either measured out of clothing, or the measurements of clothing. The
(Lindsay, 1828). One of the earliest records of measurements measured using the body can
be found in Michel Bailly's patented system in 1826. This system illustrated the
measurements on the naked body and demonstrated the connection between body
measurements and drafted patterns (Aldrich, 2007).
Measuring under the coat became an established practice by mid-eighteenth century.
Anatomy was applied to pattern drafting which contributed to standard sizing (Aldrich,
2007)). Figure information started to be combined with the tailor's experience for
proportional calculation. Henry Wampen, a Germen professor of Mathematics, published a
series of books on the human figure and garment construction between 1837 and 1864
(Aldrich, 2007).
The adoption of principles in publications on size charts and drafting methods in the
middle of nineteenth century enabled tailors and clothiers to expand their business to the
ready-made garment trade and the mass-customization garment trade (Aldrich, 2007).
Ready-to-wear began to show in the market.
1851-1900: Sizing Grew with Ready-to-Wear
The Crimean War, from 1853 to 1856, and the American Civil War, from 1861 to 1865,
accelerated the mass production of uniforms. There was a demand for uniformity of design
and speed of production (Scranton, 1994). There were also growing demands for men's suits.
The second half of the nineteenth century saw the fast growth of ready-to-wear and the
application of sizing systems. Elias Moses, a clothing entrepreneur, mentioned in 1860 that
80% of the population purchased ready-made clothing. More and more tailors were following
America and Britain were trying different paths of expansion in the ready-to-wear
business. In 1856, the first clothing factory in Leeds was opened (Honeyman, 2000). The
adoption of sewing machine made wholesale bespoke tailoring become affordable and
popular and this inhibited mass production in Britain (Aldrich, 2007), while in America,
standard sizes were built based on body measurements of recruits. Manufacturers moved
quickly to install sewing machines and subdivided the labor process in order to fulfill the
contracts rapidly (Scranton, 1994).
Although the sizing for menswear began in the early nineteenth century, it was not until
the late nineteenth century that sizes started to show up in women's wear draft books. Aldrich
believes that it was the change of fashion from 1830 to 1910 that accelerated the
development of women's ready-to-wear (2007). The fashion before the mid-nineteenth
century defined the difference in the body shapes of women and men more sharply. Women's
wear was extremely close fitted, and most women's wear was custom made. In contract,
men's wear included some ease for movement (Aldrich, 2007). With the technological
advancements during the mid-nineteenth century, men's ready-to-wear clothing became more
industrialized and affordable and this led to brought up women's demand for women's
ready-to-wear.
In Britain, dressmakers began to write pattern-drafting books in 1860, and the number
of dress-drafting books reached to a peak from 1880 to 1900 (Aldrich, 2003). By the end of
nineteenth century, tables of proportionate measurements for women started to show up in
British. Figure 10 is a size table adapted from Stone. However in America, women's
$160 million (Scranton, 1994). Mass-produced women's clothing began to outstrip clothing
produced by dressmakers (Aldrich, 2007; Scranton, 1994).
1901-2000: Sizing Bloomed with Mass Production
Although the mass-production of ready-to-wear kept growing in America during the
first half of twentieth century, the clothing produced in Britain was still developing using the
methods of the wholesale trade (Aldrich, 2007). The fashion changes during 1908 through
1913 allowed the acceptance and development of women's ready-to-wear (Aldrich, 2003).
American size charts were adopted by many British manufactures, because most of the
British size charts were based on tailors' experiences. Some of these measurements were
neither accurate nor standardized (Aldrich, 2007).
During World War I (1914-1918), a large number of men's body measurements were
collected. Some standard sizes were created based on the analysis of this data (Yu, 2004).
However, because only some basic measurements were taken, the application of this
anthropometric data was limited. Another large-scale anthropometric survey was conducted
by O'Brien and Shelton in 1939 and 1940.
Sizes for the second half of the twentieth century started to be based on body
measurements, instead of the confusing clothing measurements. Standardized anthropometric
equipment began to be used in the measuring process. Statistical methods were used for
developing sizes (Aldrich, 2007). Standard sizes were published within different countries.
Further details about anthropometric surveys and sizing standards will be explained in the
Anthropometric Surveys and Sizing Standard in the U.S. part.
In summary, the manufacturing of clothing grew rapidly during the first half of the
twentieth century, beginning in America and spreading to Europe. This led to the
developed for fitting people from different countries during the second half on twentieth
century.
2001-2013: Sizing Combined with Mass Customization
Sizing studies in the 21st century have been conducted to fit the needs of mass
customization or to fit the needs of niche markets. Guan et al. (2012) did an anthropometric
study on cab design, Song & Ashdown (2012) developed a sizing study on customized pants
creation, and Mpampa et al. (2010) developed a sizing system in which the degree of mass
customization can be controlled. Sizing systems are not only serving RTW production, but
are also forming part of mass customization.
Anthropometric Surveys and Sizing Standard in the U.S.
Standard Sizing is a classification method for body shapes, and it can provide guidance
for garment production (LaBat, 2007). An anthropometric survey helps prepare data for
sizing analysis and generation. A good understanding of the sizing standard and the
anthropometric study history is necessary for developing a good sizing system. A list of
American sizing standards and anthropometric surveys followed by a timeline can be found
in Figure 12.
Anthropometric Surveys
The first large-scale anthropometric survey for children was taken from 1937 to 1941.
It was designed by O'Brien and Shelton and was sponsored by the US Department of
Agriculture. A total of 147,000 boys and girls was measured (O’Brien, Girshick, & Hunt,
1941). From 1939 to 1940, a further study of 150,000 American women was conducted by
instruments by trained employees. Figure 11 shows the location of 34 measurements and the
average value of the measurements based on the survey results. The purpose of the
anthropometric survey was to improve the fit of women's garments by increasing the
accuracy of standard sizes. No such size scientific study of this size using body
measurements had been done before for the purpose of designing women's clothing sizes
(O’Brien, 1930; O’brien & Shelton, 1941). With the application of statistical analysis,
O'Brien and Shelton found that stature was the best predictor for length measurements and
weight was the best predictors for girth measurements (O’brien & Shelton, 1941; Petrova,
2007). However, the data did not represent the whole population, because the women
measured in this survey were volunteers with an age range of 18 to 30 (O’brien & Shelton,
1941; Petrova, 2007). Sizing selection suggestions were included but no sizing standard was
published based on this data set until the CS 215-58. This sizing standard was published in
1958 by the National Bureau of Standards.
The Anthropometric Survey of the U.S. Army (ANSUR) was conducted from 1987
through 1988 at 11 army bases. The 25,811 subjects were measured for height and weight,
and they also filled out biographical questionnaires. The subjects included 2,208 females and
1,774 males. They were measured in detail using 132 traditional measurements, in addition to
head detail measurements, and they were also given the biographical questionnaire (Gordon,
Churchill, Clauser, Bradtmiller, & McConville, 1989; Yu, 2004).
The Civilian American and European Surface Anthropometric Research (CAESAR)
project was a large scale anthropometric survey conducted in three countries using the 3D
Figure 11. The average women in O'Brien and Shelton's anthropometric survey. Source: O’brien & Shelton, 1941, p. 29.
Blackwell, Daanen, Boehmer, & Fleming, 2002). The estimated cost for CAESAR was $6
million ([TC]2, 2004). A total of 4,500 subjects were measured and 99 measurements were
collected. Some of the companies that sponsored the CAESAR study were Gap Inc., Jantzen
Company, and Vanity Fair. No sizing system was developed by the Civilian American and
European Surface Anthropometry Resource group companies, although they had access to
the data and were responsible for determining how to apply the data (Labat, 2007). The
survey in the U.S. was taken from 1998 to 2002.
SizeUSA, conducted by [TC]2, the U.S. Department of Commerce and many industry participants between 2002 and 2003, is the most recent large-scale anthropometric survey in
the United State. It was apparent that the apparel industry was losing business opportunities
because of the lack of size and size distribution data. Therefore, the purpose of SizeUSA was
to measure the body dimensions of a representative sample of the U.S. population. With the
adoption and use of the 3D body scanner from Textile/Clothing Technology Corp ([TC]2) ,
the survey became more financially feasible. About 11,000 people from 13 cities were body
scanned and measured in just over four months. No sizing system was developed, but a lot of
research was done with the SizeUSA data. Newcomb (2006) applied a software called
Female Figure Identification Technique (FFIT©) For Apparel on the SizeUSA data and
generated a sizing table for the rectangle shape. Lee et al. (2007) compared the shapes
between Americans and Koreans with SizeUSA and SizeKorea data. Kim et al. (2010)
selected seat design subjects based on the statistical results of SizeUSA. Song & Ashdown
(2011) used part of the SizeUSA data to categorize lower body shapes for females between
18-35 years old.
One big anthropometric surveys around the world was SizeUK. It was conducted on a
total of 10,000 females and males from 1999 through 2002 by the UK Government using a
conducted on 19,000 males and 15,000 males aged 7 to 90 by the Research Institute of
Human Engineering for Quality Life (HQL) between 1992 and 1994. It used the Voxelan
laser 3D body scanner. Another large survey was the Chinese national size survey which was
carried out on 14,000 women, men and children during 1987 in 10 provinces (Yu, 2004).
Figure 12. Anthropometric surveys and sizing standards in the U.S.
Sizing Standards
Before standard sizing systems were published, manufacturers developed their own
sizing charts by trial and error. The result was a lot of variations and sometimes consumers
were confused and dissatisfied (LaBat, 2007). Sizing standards were first published in the
United State, followed by Britain, Germany, France, China and then other countries. The
publication of sizing standards reached a peak during the second half of the twentieth century.
Aiming at better international guidance and rules in size standards, the International
systems and designations for clothes". Seventeen countries had representatives who
presented at the first meeting in 1970 (Winks, 1997; Yu, 2004). By studying sizing standards
published in America, a better understanding on how sizes are formed can be gained, and it is
beneficial to carry out this research.
In CS 215-58, titled "body measurements for the sizing of women's patterns and apparel", a voluntary standard was encouraged by the Mail Order Association of America
(MOAA) and was published in 1958 by the National Bureau of Standard (NBS) (LaBat, 2007;
U.S. Department of Commerce, 1958). This standard was based on the analysis of the
O'Brien and Shelton's anthropometric survey data and was expected to be able to improve the
fit of RTW. The females' body sizes were divided into Misses, Women, Junior and Halfsize
based on age, divided into Average Hip, Slender hip and Full hip based on the drop value
between hip and waist, and divided into Tall, Short and Regular based on height
measurement (Simmons, 2003). Bust was the control measurement between sizes. However,
because the anthropometric data was old and was not representative of the population at the
time the standard was published, MOAA requested a revision of the standard ((LaBat, 2007).
The revision of CS 215-58 was PS 42-70, titled "Body Measurements for the Sizing of Women's Patterns and Apparel". Similar sizing standards included PS 36-70 for boys, PS
45-71 for young men and PS 54-72 for girls. Because no large-scale anthropometric survey was
conducted between CS 215-58 and PS 42-70, the edition was based on the data from the
Health Survey conducted between 1960 and 1962. Bust was still the control dimension
between sizes but it was increased by one grade interval per size code for all figure types
slightly taller and heavier than women in the 1940s (LaBat, 2007; Stoudt, Damon, McFarland,
& Roberts, 1965).The revised version contained size tables of Junior Petite, Junior, Misses
Petite, Misses, Misses Talls, Women's and Half-Sizes (U.S. Department of Commerce, 1970).
Table 1 lists the bust measurement, waist measurement, hips measurement and height
measurements from PS 42-70.
Table 1. Comparison of PS 42-70 Misses-petite, PS 42-70 Misses and PS 42-70 Misses-tall sizing standards.
PS 42-70: Misses-petite
Measurements 8P 10P 12P 14P 16P 18P
Bust 32.5 33.5 35 36.5 38 40
Waist 23.5 24.5 26 27.5 29 31
Hips 34.5 35.5 37 38.5 40 42
Stature 59.5 60 60.5 61 61.5 62
PS 42-70: Misses
Measurements 6 8 10 12 14 16 18 20 22
Bust 31.5 32.5 33.5 35 36.5 38 40 42 44
Waist 22.5 23.5 24.5 26 27.5 29 31 33 35 Hips 33.5 34.5 35.5 37 38.5 40 42 44 46 Stature 62.5 63 63.5 64 64.5 65 65.5 66 66.5
PS 42-70: Misses-tall
Measurements 10T 12T 14T 16T 18T 20T 22T
Bust 33.5 35 36.5 38 40 42 44
Waist 24.5 26 27.5 29 31 33 35
Hips 35.5 37 38.5 40 42 44 46
Stature 67.5 68 68.5 69 69.5 70 70.5
Note: All measurements are in inches. Source: U.S. Department of Commerce, 1970, pp. 9-11.
The program of Voluntary Product Standards (VPS) which developed CS 215-58 and
PS 42-70 standards was withdrawn in 1953 by the U.S. Department of Commerce (DoC).
The American Society for Testing and Materials (ASTM) has been developing sizing
over the work of defining body measurements and apparel sizes. A series of standards for
infants, children, teenagers, and adults have been published.
The sizing system, ASTM D5585, titled Standard Tables of Body Measurements for
Adult Female Misses Figure Type, Size Range 00–20, was first published in 1995, updated in
2011 and re-edited. The newest version is ASTM D5585-11e1 (D13 Committee, 2011a).
ASTM D5585-11e1 was developed based on PS 54-72 by the U.S. Department of Commerce,
the CAESAR study, the SizeUSA study, industry studies and documentation from Alvanon
Inc. Table 2 lists the bust, waist, hips and height measurements of these three sizing
standards. The ASTM D5585-11e1 standard is divided in the table into curvy and straight,
two body types with different waist, hip and other girth measurements. In ASTM D5585-95,
the intervals for bust, waist and hips were the same between sizes, while they were different
in ASTM D5585-11e1. Stature in ASTM D5585-95 increased from a smaller size to a bigger
size. In ASTM D5585-11e1 stature was a fixed number. However, no description about how
these sizes were developed were included in the explanation of the standard.
The sizing standard, ASTM D5586, titled Standard Tables of Body Measurements for
Women 55 and Older (All Figure Types), was first published in 1995 based on the Reich and
Goldsberry's anthropometric study conducted in 1993 (D13 Committee, 1995b). A total of
6786 subjects American women who were over 55 years old participated in the study and 58
body measurements were recorded (Reich & Goldsberry, 1993). ASTM D5586 was updated
in 2001 and 2010. Sizes were divided into seven categories similar to PS 42-70. Because the
standards were formed with raw results, it was hard to interpret and apply the measurements'