2261
Correlation Study on Physicochemical Parameters of
River Ganga during Different Seasons in Haridwar
Vani Sharma* and Padma Singh
Department of Microbiology, KanyaGurukul Campus, GurukulKangriVishwavidhyalaya, Haridwar- 249407 Email: [email protected], [email protected]
Abstract: River Ganga was considered to be the holy river in India and Haridwarconsidered to be a holy city due to the presence of holy river Ganga. A study was conducted to check the water quality of river water by taken under consideration 8 physicochemical parameters i.e. pH, Temperature, Total Dissolved Solid (TDS), Conductivity, Turbidity, Biological Oxygen Demand (BOD), Dissolved Oxygen (DO) and 7 Heavy metals i.e. Arsenic, Mercury, Cadmium, Chromium, Copper, Nickel and Iron during different season (Summer, Monsoon and Winters) at 4 different sites (Bhimgodha, Prem- Nagar, Kankhal and Jwalapur) of city. The different parameters was compairedwith the standards provided by WHO, BIS, etc. It was observed that thephysico- chemical parameters were mostly within the standard limits during the different seasons, but the load of heavy metals varies seasonally, the monsoon season faces more load, followed by summer and least in winter season. The deterioration of water quality during monsoon season is due to poor sanitation condition, soil erosion, turbulent flow and high anthropogenic activities.
Keywords: Ganga, Physicochemical parameters, Heavy metals, ICP-MS, APHA
1. INTRODUCTION: Srivastava, 2011). Increased in population and industrialization, demand of freshwater increases which was fulfilled by the rivers which provide water
for various human activities (Guptaet
al.,2017).Increased urbanization and industrialization
the problem of river pollution is also mushrooming day by day and reaches to crisis and further deteriorate the water quality. The factors which basically deteriorate the water quality of river Ganga is disposal of dead bodies, Discharge of sewage and industrial waste, agriculture run off, disposal of various veneration items directly in river Ganga. For effective maintenance of water quality through
appropriate control measures, continous monitoring of physico-chemical parameters are necessary (Bhandari and Nayal, 2008). DO and BOD are used to check the pollution level of aqueous system directly. Contaminated water may also contain the various heavy metals, it is a metals having a density
of 5g/cm3, these metals are highly toxic to the
environment and in turn to humans, they are associated with deadly disease of humans such as cancer, The organic forms of heavy metals have been reported to be very toxic and adversely affects water quality. It is not necessary that low pH values of water shows the presence of heavy metals such as Zn, Cd, As, etc, shows their presence at neutral pH (Sharma and Singh, 2015). Thus a regular analysis of water quality start fading off the appropriate measure can be taken to prevent these valuable rivers for our future generations.
2. MATERIAL AND METHODS:
2.1.Site Description: Total 4 sites had been selected on the bank of river Ganga at
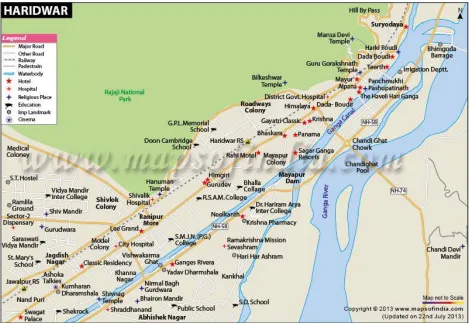
2262 Fig 1: Map showing the sampling sites of Ganga river used in the study
Bhimgodha-(N 29o60‟ 25.9‟‟/ E 078o 14‟28.1‟‟).It is at 500m from HarkiPauri, it is a barrage on the Ganges river, it is a site of high tourist interest as this sites have many mythological sites, here the Ganga meets the waste of most of the hotels, dharamshala and residential sewage.
Prem- Nagar-(N 29o55‟48.8‟‟/E 078o 08‟10.3‟‟).It is the site where one of the oldest ashram is situated along with this include the basic residential area of Haridwar and hence contribute to anthropogenic and mythological wastes.
Kankhal-(N 29o63‟92.6‟‟/E 078o14‟6.3‟‟).Kankhal is a small colony in Haridwar, Kankhal is one of Panchtirth within Haridwar. It is a site where according to hindu religion ash of dead bodies made to dump in Ganga and various sewage opening dump direct sewage in river.
Jwalapur-(N 29o71‟92.7‟‟/E 078o10‟8.0‟‟). It is the site of Haridwar where a large number of sewage opening dump the human sewage directly in the river at Jatwara Bridge various human activities such as bathing, washing of clothes and disposal of industrial waste pollute Ganga River.
2.2 Sampling- Water sample were collected from the above mentioned sites in a clean sampling bottles around 10 am and carried to the laboratory in cold condition and were analyzed within 7 hours of collection.
2263
metals by the ICP-MS technique (Malassaet al.,
2013).
2.4. Statistical analysis- Observed data was statistically analyzed by determining the correlation between the different parameters. Correlation is a bivariate analysis that measure the strength of association between two variables and the direction of the relationship, the value of the correlation varies between +1 and -1and a value of ± 1 indicates a perfect association between the two variables. Pearson (r) correlation is the most widely used
correlation it is the correlation to determine the strength of relationship, correlation coefficient between 0.10 and 0.29 represent a small association, 0.30 and 0.49 represent a medium association, and the coefficient of 0.5 represent a large association between two variables (Bhandari and Nayal, 2008).Further data was statistically analyzed by using Analysis of Variance (ANOVA) to determine the
seasonal and spatial variations of mean
concentrations of different heavy metals in the Ganga water (Elbag, 2006).
3. RESULTS AND DISCUSSION:
The various physicochemical parameters which were considered during summers, winters and Monsoon are pH, Total Dissolved Solids, Turbidity, Conductivity, Free CO2, Biological Oxygen Demand, Dissolved Oxygen and the
heavy metals such as Arsenic(As), Mercury(Hg), Cadmium (Cd), Chromium (Cr), Copper (Cu), Nickel (Ni) and Iron (Fe).Each analysis was done in triplicates and the mean value was taken.
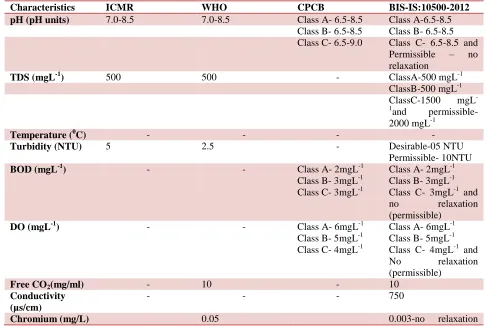
Table 1: Standards for drinking water
Characteristics ICMR WHO CPCB BIS-IS:10500-2012 pH (pH units) 7.0-8.5 7.0-8.5 Class A- 6.5-8.5 Class A-6.5-8.5
1and permissible-
2000 mgL-1
2264 (permissible)
Copper (mg/L) 0.05 0.05-1.50
Iron (mg/L) 0.3 0.3- no relaxation (permissible)
Mercury (mg/L) 0.001
Cadmium (mg/L) 0.02 0.03-no relaxation (permissible)
Nickel (mg/L) 0.02
Arsenic (mg/L) 0.01
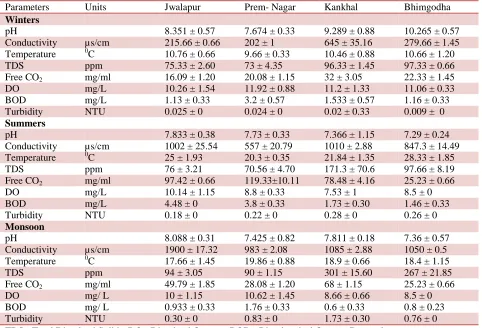
Table 2: Water Quality Data of river Ganga during different season at different sites (Average of triplicates ± SEM)
Parameters Units Jwalapur Prem- Nagar Kankhal Bhimgodha
Winters
pH 8.351 ± 0.57 7.674 ± 0.33 9.289 ± 0.88 10.265 ± 0.57
Conductivity µs/cm 215.66 ± 0.66 202 ± 1 645 ± 35.16 279.66 ± 1.45
Temperature 0C 10.76 ± 0.66 9.66 ± 0.33 10.46 ± 0.88 10.66 ± 1.20
TDS ppm 75.33 ± 2.60 73 ± 4.35 96.33 ± 1.45 97.33 ± 0.66
Free CO2 mg/ml 16.09 ± 1.20 20.08 ± 1.15 32 ± 3.05 22.33 ± 1.45
DO mg/L 10.26 ± 1.54 11.92 ± 0.88 11.2 ± 1.33 11.06 ± 0.33
BOD mg/L 1.13 ± 0.33 3.2 ± 0.57 1.533 ± 0.57 1.16 ± 0.33
Turbidity NTU 0.025 ± 0 0.024 ± 0 0.02 ± 0.33 0.009 ± 0
Summers
pH 7.833 ± 0.38 7.73 ± 0.33 7.366 ± 1.15 7.29 ± 0.24
Conductivity µs/cm 1002 ± 25.54 557 ± 20.79 1010 ± 2.88 847.3 ± 14.49
Temperature 0C 25 ± 1.93 20.3 ± 0.35 21.84 ± 1.35 28.33 ± 1.85
TDS ppm 76 ± 3.21 70.56 ± 4.70 171.3 ± 70.6 97.66 ± 8.19
Free CO2 mg/ml 97.42 ± 0.66 119.33±10.11 78.48 ± 4.16 25.23 ± 0.66
DO mg/L 10.14 ± 1.15 8.8 ± 0.33 7.53 ± 1 8.5 ± 0
BOD mg/L 4.48 ± 0 3.8 ± 0.33 1.73 ± 0.30 1.46 ± 0.33
Turbidity NTU 0.18 ± 0 0.22 ± 0 0.28 ± 0 0.26 ± 0
Monsoon
pH 8.088 ± 0.31 7.425 ± 0.82 7.811 ± 0.18 7.36 ± 0.57
Conductivity µs/cm 1900 ± 17.32 983 ± 2.08 1085 ± 2.88 1050 ± 0.5
Temperature 0C 17.66 ± 1.45 19.86 ± 0.88 18.9 ± 0.66 18.4 ± 1.15
TDS ppm 94 ± 3.05 90 ± 1.15 301 ± 15.60 267 ± 21.85
Free CO2 mg/ml 49.79 ± 1.85 28.08 ± 1.20 68 ± 1.15 25.23 ± 0.66
DO mg/ L 10 ± 1.15 10.62 ± 1.45 8.66 ± 0.66 8.5 ± 0
BOD mg/ L 0.933 ± 0.33 1.76 ± 0.33 0.6 ± 0.33 0.8 ± 0.23
Turbidity NTU 0.30 ± 0 0.83 ± 0 1.73 ± 0.30 0.76 ± 0
TDS= Total Dissolved Solids, DO= Dissolved Oxygen, BOD= Bio-chemical Oxygen Demand,
Table 3: Assessment of Heavy metals during different season and at different sites of Ganga River by ICP-MS
Heavy Metals Units Jwalapur Prem-Nagar Kankhal Bhimgodha Winters
Arsenic mg/ml 0.0249± 0.007 0.00349± 0.005 0.03296± 0.001 0.05172±0.005
Mercury mg/ml 0.0177 ± 0.01 0.00045± 0.002 0.00128± 1 0.0096± 0.8
2265
Arsenic mg/ml 0.00428± 0.65 0.000362±0.11 0.00823± 1.4 0.0022± 0.01
Mercury mg/ml 0.0347 ± 0.02 0.00036 ± 0.1 0.0062± 0.5 0.0772± 0.003
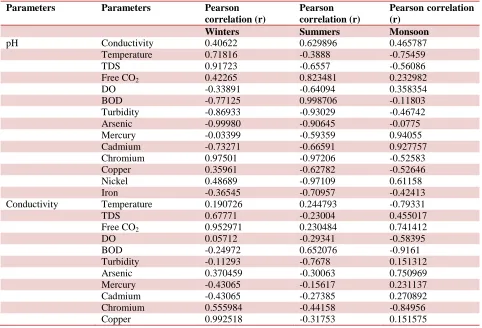
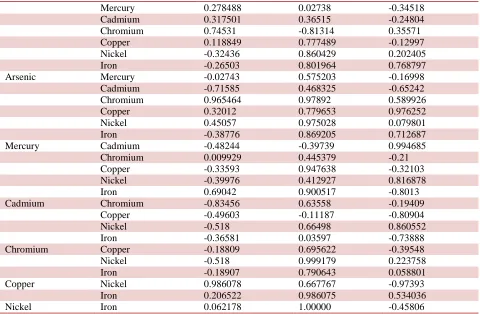
Table 4: Pearson correlation coefficient between physico-chemical properties of 4 sites during different seasons of river Ganga Haridwar, India.
Parameters Parameters Pearson correlation (r)
Pearson correlation (r)
Pearson correlation (r)
Winters Summers Monsoon
pH Conductivity 0.40622 0.629896 0.465787
Temperature 0.71816 -0.3888 -0.75459
TDS 0.91723 -0.6557 -0.56086
Free CO2 0.42265 0.823481 0.232982
DO -0.33891 -0.64094 0.358354
BOD -0.77125 0.998706 -0.11803
Turbidity -0.86933 -0.93029 -0.46742
Arsenic -0.99980 -0.90645 -0.0775
Mercury -0.03399 -0.59359 0.94055
Cadmium -0.73271 -0.66591 0.927757
Chromium 0.97501 -0.97206 -0.52583
Copper 0.35961 -0.62782 -0.52646
Nickel 0.48689 -0.97109 0.61158
Iron -0.36545 -0.70957 -0.42413
Conductivity Temperature 0.190726 0.244793 -0.79331
TDS 0.67771 -0.23004 0.455017
Free CO2 0.952971 0.230484 0.741412
DO 0.05712 -0.29341 -0.58395
BOD -0.24972 0.652076 -0.9161
Turbidity -0.11293 -0.7678 0.151312
Arsenic 0.370459 -0.30063 0.750969
Mercury -0.43065 -0.15617 0.231137
Cadmium -0.43065 -0.27385 0.270892
Chromium 0.555984 -0.44158 -0.84956
2266
Nickel 0.995957 -0.428 0.073427
Iron 0.085604 -0.2864 0.214899
Temperature TDS 0.47384 -0.19713 -0.055
Free CO2 0.00163 -0.84244 -0.25236
DO -0.89595 0.84551 0.31903
BOD -0.99628 -0.34185 -0.86587
Turbidity 0.36918 0.024382 -0.28095
Arsenic 0.71313 0.412204 0.411875
Mercury 0.63703 0.914189 0.186872
Cadmium -0.95921 0.863829 0.178737
Chromium 0.77561 0.461216 0.775619
Copper -0.21121 0.231078
Nickel 0,26374 0.49056 -0.4158
Iron 0.32256 -0.04633 0.004231
TDS Free CO2 0.73727 -0.24856 0.333611
DO -0.04095 -0.13411 -0.95554
BOD -0.54795 -0.66834 -0.75587
Turbidity -0.80008 0.802594 0.46411
Arsenic 0.90666 0.080258 0.685048
Mercury -0.37524 -0.15358 -0.68157
Cadmium -0.58684 -0.0796 -0.70317
Chromium 0.92314 0.71733 -0.34627
Copper 0.61363 0.99923 0.78389
Nickel 0.73313 0.68995 -0.66763
Iron -0.44386 0.98795 0.898216
Free CO2 DO 0.31526 0.320894 -0.26686
BOD -0.07539 0.793683 -0.59325
Turbidity -0.26655 -0.55801 0.702993
Arsenic 0.391912 -0.77335 0.914885
Mercury -0.67196 -0.91662 0.214142
Cadmium -0.25849 -0.93563 0.305911
Chromium 0.519243 -0.84671 -0.2774
Copper 0.91043 -0.22367 -0.27791
Nickel 0.94718 -0.86753 0.46858
Iron -0.20389 -0.37194 0.411812
DO BOD 0.855349 0.860401 0.860401
Turbidity -0.03076 -0.2179 -0.2179
Arsenic -0.33393 -0.98377 -0.60714
Mercury -0.90094 -0.60691 0.631397
Cadmium 0.81473 -0.65081 0.614829
Chromium -0.41854 -0.98341 0.588577
Copper -0.02595 -0.67988 -0.85037
Nickel 0.006065 -0.98616 0.672031
Iron -0.64154 -0.77539 -0.72916
BOD Turbidity 0.427171 -0.9477 -0.19658
Arsenic -0.76528 -0.90443 -0.76737
Mercury -0.56825 -0.55356 0.165273
Cadmium 0.969337 -0.6281 0.067774
Chromium -0.82704 -0.96771 0.827125
Copper -0.28199 -0.65612 -0.51701
Nickel -0.32436 -0.96428 0.309431
Iron -0.26503 -0.7304 -0.49109
2267
Mercury 0.278488 0.02738 -0.34518
Cadmium 0.317501 0.36515 -0.24804
Chromium 0.74531 -0.81314 0.35571
Copper 0.118849 0.777489 -0.12997
Nickel -0.32436 0.860429 0.202405
Iron -0.26503 0.801964 0.768797
Arsenic Mercury -0.02743 0.575203 -0.16998
Cadmium -0.71585 0.468325 -0.65242
Chromium 0.965464 0.97892 0.589926
Copper 0.32012 0.779653 0.976252
Nickel 0.45057 0.975028 0.079801
Iron -0.38776 0.869205 0.712687
Mercury Cadmium -0.48244 -0.39739 0.994685
Chromium 0.009929 0.445379 -0.21
Copper -0.33593 0.947638 -0.32103
Nickel -0.39976 0.412927 0.816878
Iron 0.69042 0.900517 -0.8013
Cadmium Chromium -0.83456 0.63558 -0.19409
Copper -0.49603 -0.11187 -0.80904
Nickel -0.518 0.66498 0.860552
Iron -0.36581 0.03597 -0.73888
Chromium Copper -0.18809 0.695622 -0.39548
Nickel -0.518 0.999179 0.223758
Iron -0.18907 0.790643 0.058801
Copper Nickel 0.986078 0.667767 -0.97393
Iron 0.206522 0.986075 0.534036
Nickel Iron 0.062178 1.00000 -0.45806
Table 5: Analysis of Variance (ANOVA) for seasonal and spatial variations in different heavy metals in Ganga river at Haridwar.
Parameters ANOVA Seasonal Variation P-value ANOVA Spatial Variation
P-value
Arsenic 0.017 0.441
Mercury 0.326 0.308
Cadmium 0.295 0.495
Chromium 0.015 0.784
Copper 0.063 0.366
Nickel 0.396 0.449
Iron 0.667 0.380
Values are statistically significant at P≤ 0.05.
The present study shows the considerable variation between different physico-chemical parameters during different seasons as compared with the
standards provided by WHO, ICMR, CPCB and BIS in table1, From table 2, it was clear that the range of pH lies between 7.29 in summers to 10.265 in winters
(Singh et al., 2012). This variation in pH value was
observed due to annual variation in free CO2 (Kumari
et al., 2013) and (Sharma et al., 2008). The pH was toward acidic in summer was due to high Free
CO2(Santosh et al., 2008). pH shows positive
relationship between Electrical Conductivity (0.406),
Free CO2 (0.422), TDS (0.917), Temperature (0.718)
2268
Fig2: pH variation for different season
Fig3: Free CO2 variation for different season Total dissolved solid was in the range of 301-73
mgL-1 which lies within the prescribed limit of 500
mgL-1 by WHO, ICMR and BIS, similar results was
obtained by (Yadav and Srivastava, 2011) and
(Tripathi et al., 2014). during study of river Ganga at
Ghazipur. TDS shows positive correlation with Free
CO2 (0.737), pH (0.917), Conductivity (0.677),
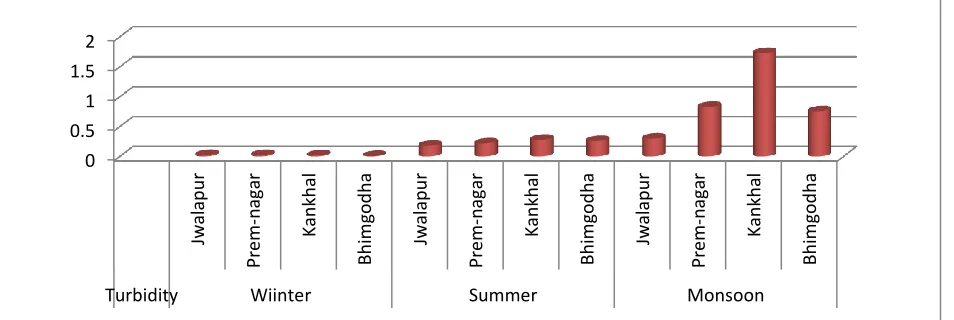
Temperature (0.473). Turbidity values of different seasons falls in the range of 1.73 NTU- 0.009 NTU highest value was found to be at site kankhal. The high value of turbidity is in monsoon is due to turbulent flow which stirred silt and sand which was present at the bottom
2269
Fig 4: TDS parameters during different season
stirred silt and sand which was present at the bottom of river, similar pattern was observed in other rivers during monsoon season (Narayan and Chauhan,
2000) and (Almeida et al., 2012). It shows positive
correlation with BOD(0.427) and Temperature (0.369).
Fig 5: variation in turbidity values during different season
Dissolved Oxygen of Ganga water is highest during
winter 11.92 mgL-1 this was probably due to low
temperature, low turbidity, which increase
2270
Fig 6: DO Parameters during different season
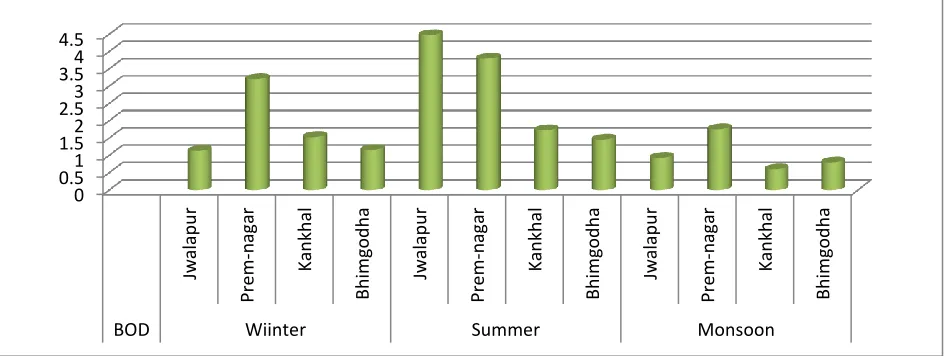
BOD value ranges from maximum 4.48 mgL-1 in
summer to 0.6 mgL-1 in monsoon; this was due to
higher rate of decomposition of organic matter
(Kumari et al., 2013). Water temperature plays an
important role which influence both chemical and biological factors of water resources, temperature
was found to be minimum 9.66 oC in winter and
maximum 28.33 oC in summer.
Fig 7: BOD Parameters during different seasons
Electrical Conductivity of water depends upon the ions in water and also affected by the suspended impurities and thus Electrical Conductivity was
maximum in monsoon and minimum in winter. It was positively correlated with Temperature (0.190), TDS
2269
Fig 8: EC Parameters at during different seasons
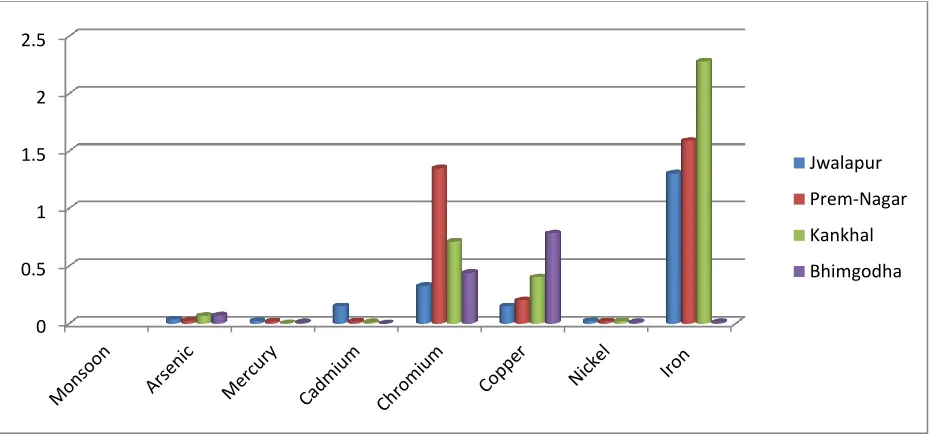
The values of seven heavy metals in Ganga canal water at 4 different sites namely Bhimgodha, Premnagar, Kankhal and Jwalapur were presented in Table 3. Out of 3 seasons the maximum amount of heavy metals in monsoon season are above prescribed limit, this is due to high soil sediments comes in water in which metals are present along with festival season such as shivratri and many more
which further increase load on city and further contribute to pollution, during monsoon season the range of different heavy metals varies as As (0.069-
0.0245 mgL-1), Hg(0.01-0.008 mgL-1), Cd
(0.0004-0.1485 mgL-1), Cr (0.32- 1.34 mgL-1), Cu (0.2006-
0.7816 mgL-1), Ni (0.008- 0.0019 mgL-1), Fe
(0.008-2.278 mgL-1).
Fig 9: Concentration of different heavy metals during monsoon at different sites
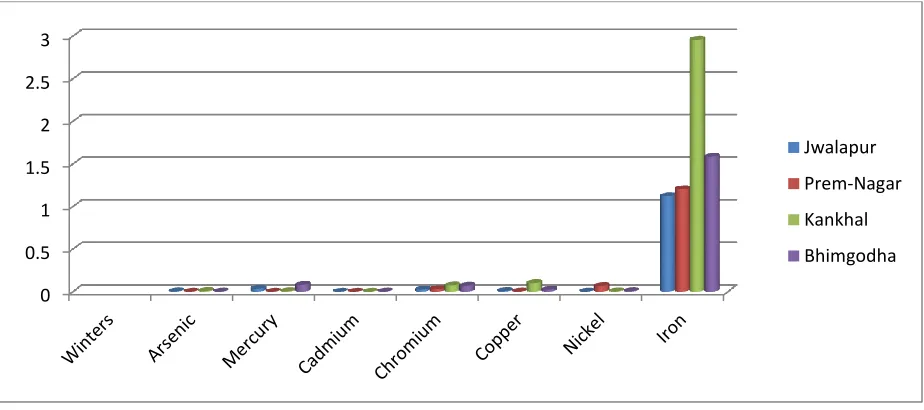
Monsoon season was followed by summers in which the different metals concentration was asfollows, As
2270
Cu (0.002- 0.1005 mgL-1), Ni (0.001- 0.066 mgL-1),
Fe (1.121-2.958 mgL-1) and least in winters As (0.05-
0.003 mgL-1), Hg (0.0004- 0.017 mgL-1), Cd
(0.00008- 0.0045 mgL-1), Cr (0.003- 0.189 mgL-1),
Cu (0.0032- 0.33 mgL-1), Ni (0.0012- 0.0028 mgL-1),
Fe (0.85- 1.65 mgL-1).
Fig 10: Concentration of different heavy metals during summer at different sites
The pattern which is obtained in the study of Heavy Metals in Ganga River was same as it was obtained
in the study of (Singh et al., 2012) and (Kar et al.,
2008). In terms of correlation Arsenic shows a
significant correlation with Chromium (0.96), Mercury with Iron (0.69) and Copper with Nickel (0.98).
Fig 11: Concentration of different heavy metals during winters at different sites
Seasonal variation was determined by analyzing seven metals, according to seasonal variation, computed P- values by ANOVA which were depicted
in Table 5. Arsenic and Chromium was found to be significant as P-value were found to be statistically
significant (Seth et al., 2016). On the other hand
0 0.5 1 1.5 2 2.5 3
Jwalapur
Prem-Nagar
Kankhal
Bhimgodha
0 0.5 1 1.5 2 2.5 3
Jwalapur
Prem-Nagar
Kankhal
2271 according to the spatial variation among four
sampling sites none of the parameters was found to
be statistically significant (Kansalet al., 2013).
CONCLUSION: The present study show detailed physicochemical characteristic of river Ganga in Haridwar at different sites during different seasons. The winters, summer and monsoon shows a considerable variation in physicochemical values and heavy metals like Arsenic, Mercury, Cadmium, Iron, etc. was found to be slightly above the permissible limit and hence degrade the quality of river water which is used for various purpose such as drinking and bathing, the values of different parameters shows that there is a considerable need to increase the awareness about the importance of river for our society and to maintain the quality of river along with this number of programs should be activated to check the quality of river water time to time. So that our resources get preserved.
ACKNOWLEDGEMENT: We owe our sincere gratitude to Gurukul library for finding literature on our work; we also wish to acknowledge DST for providing the financial support by providing
INSPIRES fellowship and IIT Roorkee for
assessment of heavy metals by ICP-MS.
REFERENCES
[1] Almedia, C., Gonzalez, S.O., Mallea, M., and
Gonzalez, P. „‟A Recreational Water Quality
Index using Chemical, Physical and
Microbiological Parameters‟‟. Environment
Science Pollution Research. 19(8): 3400-3411,2012.
[2] APHA,American Public Health Association,
American Water Works Association (AWWA) and Water Environment Federation (WEF). “Standards for Examination of Water and Waste
water‟‟. 22nd Ed., American Public Health
Association, Washington, DC, USA, 2012.
[3] Bhandari, N.S., andNayal, K. „‟Correlation
Study on Physico-chemical Parameter and Quality Assessment of Kosi River Water, Uttarakhand‟‟. E- journal of Chemistry. 5(2): 342-346, 2008.
[4] BIS, Bureau of Indian Standards.” Specification
for Drinking Water”. IS: 10500, Bureau of Indian Standards New Delhi, 2012
[5] CPCB (Central Pollution Control Board).‟‟
Water Quality Status of Yammuna River. Assessment and Development of River Basin‟‟. CPCB Report, 2000.
[6] Elbag, M.A. „‟Impact of Surrounding Land Uses
on Surface Water Quality‟‟. Worcester
Polytechique Institute, Massachusetts, Amherst, 2006.
[7] Gupta, N., Pandey, P., andHussain, J.‟‟ Effect of
Physico-chemical and Biological Parameters on the Quality of River Water of Narmada, Madhya Pradesh, India‟‟. National Water Research Center. 31: 11-23, 2017.
[8] ICMR (Council of Medical Research)” Manual
of Standards of quality for Drinking Water Supplies, Indian‟‟. Special Report No. 44., pp.27, 1975.
[9] Joshi, D.M., Kumar, A., and Agrawal,
N.‟‟Studies on Physicochemical Parameters to Assess the Water Quality of River Ganga for Drinking Purpose in Haridwar District‟‟. Rasayan Journal Of Chemistry. 2(1): 195-203, 2009.
[10] Kansal, A., Siddique N.A., and Gautam, A.‟‟
Assessment of Heavy Metals and their Interrelationships with some Physiochemical Parameters in Eco-efficient Rivers of Himalayan
Region‟‟. Enivronmental Monitoring and
Assessment. 185(3): 2553- 2563, 2013.
[11] Kar, D., Sur, P., Mandal, S.K., Saha, T., and
Kole, R.K..” Assessment of Heavy Metal Pollution in Surface Water. International Journal of Environment Science and Technology‟‟, 5(1): 119-124, 2008.
[12] Kumari, M., Mudgal,L.K., and Singh, A.K..”
Comparative Studies of Physico-chemical
Parameters of Two Reservoirs of Narmada River, MP, India‟‟. Current World Environment. 8(3): 473-478, 2013.
[13] Malassa, H., Qutob, M.A., Khatib, M.A., and
Rimawi, F.A.„‟Determination of Different Trace Heavy Metals in Ground Water of South West
Bank/Palestine by ICP/MS‟‟. Journal of
Environment Protection. 4: 818-827,2013.
[14] Narayan, S., and Chauhan, R. „‟Water Quality
Status of River Complex Yammuna at
Panchnada(Distt. Etawah, U.P., India). I: An Integrated Management Approach‟‟. Pollution Research. 19(3): 357-364, 2000.
[15] Santosh, M., Avvannavar, and Shrihari,
S.„‟Evaluation of Water Quality Index for
2272
Mangalore, South India‟‟. Environment
Monitoring Asesssment. 143: 279-290, 2008.
[16] Seth, R., Mohan, M., Singh, P., Singh, R.,
Dobhal, R., Singh, K.P., and Gupta, S.‟‟Water Quality Evaluation of Himalayan Rivers of Kumaun Region, Uttarakhand, India‟‟. Applied Water Science. 6(2): 132-147, 2016.
[17] Sharma, S., Dixit,S., and Jain, P. „‟Statistical
Evaluation of Hydrobiological Parameters of Narmada River Water at Hoshangabad City, India‟‟. Environment Monitoring Assessment. 143: 195- 202, 2008.
[18] Sharma,V., and Singh, P.„‟Heavy Metals
Pollution and its Effect on Environment and Human Health‟‟. International Journal of Recent Scientific Research.6(12): 7752-7755, 2015.
[19] Singh, L., Choudhary S.K., and Singh
P.K.„‟Status of Heavy Metal Concentration in Water and Sediment of River Ganga at Selected Sites in the Middle Ganga plain‟‟. International
Journal of Research in Chemistry and
Environment. 2(4): 236-243, 2012.
[20] Tripathi, B., Pandey, R., Raghuvanshi, D., Singh,
H., Panday, V., and Shukla, D.N.„‟Studies on the Physico-chemical Parameters and Correlation Coefficient of the River Ganga at Holy Place Shringverpur, Allahabad‟‟. IOSR Journal of Environmental Science, Toxicology and Food Technology. 8(10): 29-36, 2014.
[21] Yadav, R.C., and Srivastava,