Abstract — Alpha emitters are usually identified and quantified by alpha spectrometry measurements in a vacuum chamber performed in laboratory environments. This study shows that transuranic elements can be distinguished under ambient conditions using a grid collimator. The aim of this work was to use numerical simulations with the MCNP6 code to design a grid with a resolution high enough to differentiate the same radionuclide combinations as alpha spectrometry in a vacuum chamber, namely 239Pu + 240Pu, 241Am + 238Pu and 244Cm. Results show that a compromise is required to obtain the best performances in terms of energy resolution and detection efficiency, leading to the choice of two hexagonal grid collimators. The first has a collimation height of 0.5 cm and an apothem of 1 mm. Laboratory tests on electrodeposited sources show that the target radionuclides can be identified without prior deconvolution, with an energy resolution of about 70 keV and a detection efficiency of 0.74% at incident energies of 5–6 MeV. The second grid has the same collimation height but a coarser mesh with an apothem of 2 mm. In this case, the alpha peaks are still distinguishable, but with a lower resolution of 125 keV. The detection efficiency is three times higher however.
Index Terms — Ambient conditions, In situ alpha spectrometry, Monte-Carlo simulations, Nuclear waste, Radiological characterization.
I. INTRODUCTION
HE reconversion of the French Alternative Energies and Atomic Energy Commission (CEA) site in Fontenay-aux-Roses began in 1995. Two nuclear installations are still awaiting decommissioning. The first has been used for research and development on nuclear fuel reprocessing and the production of transuranic elements. The second is dedicated to nuclear waste management, notably legacy waste from the first installation and recent operational and decontamination and dismantling waste.
The challenges are to restore and process this legacy waste before evacuation to appropriate storage sites, which requires the establishment of a precise radiological inventory.
Nuclear waste containing beta and gamma emitters are readily characterized by gamma spectrometry. The waste from Fontenay-aux-Roses, in contrast, has a high proportion of alpha emitters (238,239,240Pu, 237Np, 241,243Am, 244Cm). These transuranic elements need to be precisely quantified because of criticality safety concerns. In general, fissile material is
Submitted July 12, 2019.
D. Degrelle, J. Venara, M. Cuozzo and C. Mahé are with the CEA, DEN, DE2D, SEAD, Dismantling Technics and Simulation Laboratory F-30207 Bagnols-sur-Cèze, France (e-mail: [email protected]).
quantified using the PNA (passive neutron assay) technique. However, the high concentration of 244Cm, a strong emitter of neutrons by spontaneous fission, skews PNA results and makes them difficult to use.
The technique considered here to overcome these difficulties is in situ alpha spectrometry at ambient pressure. This is a non-destructive method with measurements performed on smear samples of nuclear waste obtained beforehand. The main benefit of this approach compared with alpha spectrometry performed in laboratory (under vacuum) is that it does not require lengthy and complex sample preparation, which increases the throughput for the analysis and thus the processing of nuclear waste.
The spectrometric selectivity of this technique should be sufficient to identify the following three groups of radionuclides:
239Pu + 240Pu 241Am + 238Pu 244Cm
For 244Cm, there is no interference from other radionuclides. The ability to discriminate is valuable notably to complete PNA measurements.
Since the measurements are performed on smear samples, alpha spectrometry under ambient conditions is only sensitive to the labile part of the contamination. The purpose of this approach is not to quantify the alpha emitters present in nuclear waste but to determine the relative proportions of alpha emitting radionuclides or groups of radionuclides.
II. PRINCIPLE
The nature of alpha particles makes them difficult to detect by spectrometry. The successive ionizations they induce as they interact with their environment lead to such large energy losses that 5 MeV incident particles travel no further than 4 cm in air. The difficulty of measuring alpha particles in air lies in their isotropic emission by the source or sample. Depending on their incidence angles indeed, the emitted alpha particle will each travel a different distance and thus loose more or less energy, degrading the resolution of the spectrum. This is why alpha spectrometry is usually carried out in a vacuum to avoid interactions with the surrounding air.
Pöllänen et al. [1][2] have shown that certain alpha emitters can be distinguished at ambient pressure by placing a wire grid
M. Ben Mosbah is with the CEA, DEN, DTN, SMTA, Nuclear Measurements Laboratory, F-13108 Saint-Paul-lez-Durance, France
R. Serrano is with the CEA, DEN, UADF, F-91191 Gif-sur-Yvette, France.
Design by numerical simulation of an in situ alpha
spectrometer operating at ambient air pressure
D.Degrelle, J. Venara, M. Ben Mosbah, M. Cuozzo, C. Mahé, R. Serrano
&($'(16($'/67'
GHERUDKGHJUHOOH#VDIHWHFKQRORJLHVIU
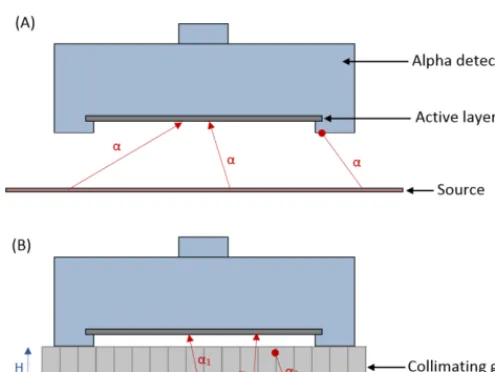
collimator between the sample or source and the window of the detector to select alpha particles with a small angle of incidence. Once the particle beam is collimated, the alpha particles with too large an angle of incidence, i.e. those with the longest path lengths in air, cannot reach the detector (Fig. 1). The particles that are detected will all have traveled a similar distance, improving the energy resolution of the spectra.
Fig. 1. Schematic representation of alpha particle selection using a collimator grid [2]. In the absence of the grid (A), all particles are detected, regardless of their angle of incidence. With the grid, only particles with a small angle of incidence are detected (α1 et α2). H is the collimation height and 2a is the cell width.
It has been shown [1] that 239Pu, 241Am and 244Cm can be distinguished. This alpha ray detection technique was developed in the 1980s in the context of assessing atmospheric contamination [3]. It is still used to identify the proportion of alpha radiation from radon in certain air-monitoring beacons with radial fin grids [4]. The resolution can reach 120–130 keV for the alpha peak of 241Po at 7.686 MeV [2].
The aim of the present study was to optimize the collimator grid design using numerical simulations with the Monte-Carlo MCP6 (Monte-Carlo N-Particle) code [5] so that the resolution is high enough to discriminate between certain alpha emitters. Laboratory tests were performed to validate the design of the chosen grids.
III. MATERIALS AND SIMULATION
A. Materials
Laboratory alpha spectrometers in vacuum chambers commonly employ PIPS (Passivated Implanted Silicon) detectors [6]. These silicon semiconductor detectors are generally chosen for their low cost and the energy resolution they offer, on the order of 30–80 keV for routine measurements [7]. The thinner the active layer is, the better the resolution is. This high performance is due to a thin dead layer (50 nm of Si). The detectors used in this study were CAM (Continuous Air Monitoring) PIPS detectors [8]. They are specifically designed for continuous use in air, notably in air-monitoring beacons. Because of the conditions in which they are used and because of the light-sensitivity of silicon, CAM PIPS detectors have
more protective layers than standard ones [8]. These extra layers increase the thickness of the dead layer on the detection window by 1.5–2 µm Si-equivalent [6][8].
CAM PIPS detectors are available in a wide range of sizes. Those used in air-monitoring beacons are usually small. The detector used in this work was the CAM2000 produced by MIRION Technologies. It has an active surface of 2000 mm2 and a thickness of 300 µm Si. It active area is one of the largest available. It was chosen to optimize the studied surface. The recommended operating voltages for this type of detector are +24 V or +70 V, giving theoretical resolutions of 34.4 keV and 28 keV, respectively (performance tests performed under vacuum [8]). At +70 V, the layer is fully depleted.
The detection chain was provided by MIRION Technologies. The detector is associated with a 2018EB preamplifier and a LYNX multichannel analyzer. This combination offers a maximum theoretical count rate of 2 x 10⁶ MeV/s according to the manufacturer. The alpha spectra are analyzed using the software Genie 2000 with the alpha analysis module [9].
Electrodeposited reference sources were used for the laboratory measurements. They consisted of an active layer 15 mm in diameter electrodeposited on a 0.5 mm thick stainless-steel disk. The energy broadening due to deposition process is less than 20 keV for these sources [10]. Self-absorption in the sources is assumed negligible. This assumption was verified by simulating 241Am alpha rays broadened by 20 keV. The resulting peak’s resolution differed by 1.4% with respect to a simulation performed with discrete lines. The radionuclides available for this study were 239Pu, 241Am and 244Cm, with respective activities of 2979 Bq, 3295 Bq and 2717 Bq on 4 March 2019. The relative uncertainty on the source activities is 1%. Table I lists the energies of the main alpha particles emitted by these radionuclides [11].
TABLEI
MAIN ALPHA PARTICLE ENERGIES OF ELECTRODEPOSITED REFERENCE SOURCES
239Pu 241Am 244Cm
Energy
(keV) Intensity (%) Energy (keV) Intensity (%) Energy (keV) Intensity (%) 5 156.59
5 143.82 5 105.81
70.75 17.14 11.87
5 486.46 5 442.86 5 388.25
84.45 13.23 1.66
5 804.77
5 762.65 76.7 23.3
B. Simulation
The detector/grid/source setup was modeled using the MCNP6 calculation code [5]. The detector dimensions were set to the values specified by the manufacturer (section III.A).
The grid was modeled using a lattice structure (repeated hexagonal elements with LAT=1 in a mesh universe created with the U card). This approach reduces modeling and calculation times.
The most appropriate tally to model the response of the CAM2000 detector is the F8 tally, which gives the distribution of energies deposited in the detector characteristic of an alpha spectrum. Each calculation was launched with 5 x 10⁷ histories and the statistical error was no more than 5%.
Simulations were also performed to energy calibrate the
experimental spectra. Care was taken to ensure they were representative. Comparisons between simulations and experimental measurements were used in this study to determine the systematic error associated with the simulated spectra, as discussed in the following.
IV. DESIGN BY MONTE-CARLO SIMULATION
Table II lists the different parameters used in this section to describe the geometry of the collimator grid. A “cell” is defined as one complete element in the lattice.
TABLEII
LIST OF PARAMETERS CHARACTERIZING A MESH CELL
Symbol Definition
e Wall thickness of a cell
H Collimation height or height of a cell
r Radius of a circular cell
c Side length of a square cell
d Diagonal length of a square cell
a Apothem of a hexagonal cell; radius of the inscribed circle
rc Radius of the circumcircle of a hexagonal cell; side length of a regular hexagon
P Perimeter of a cell
A Area of a cell
The geometric shapes correspond to the face of the cell perpendicular to the alpha particle beam and parallel to the detector. The hexagonal mesh is composed of regular hexagons.
A. Choice of mesh geometry
The first stage involved choosing the mesh geometry best adapted for alpha particle detection. It should not restrict the energy resolution of the detector or its energy efficiency.
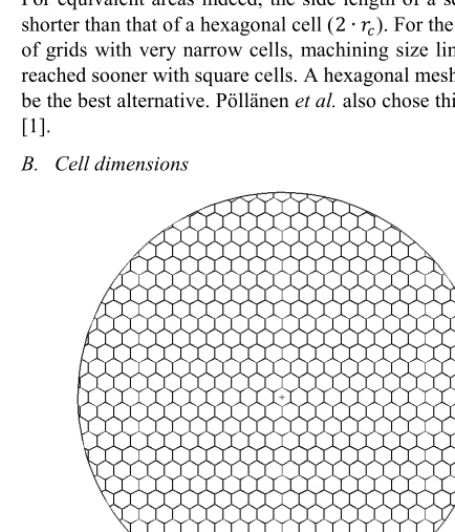
Hexagonal, square and circular meshes with identical surface areas were compared. Contrary to the hexagonal and square meshes, a circular mesh does not give complete surface coverage (Fig. 2). This is because the walls of round cells require extra material to fill the intercellular space. With a circular mesh, the alpha particles are thus more likely to encounter the cell walls, reducing the detection efficiency. The circular mesh was therefore not chosen for the rest of the study.
Fig. 2. Diagrams of a circular and a hexagonal mesh. The cell walls are shown in grey. The walls of the circular mesh are thicker because the intercellular space is larger.
The choice between a hexagonal and a square mesh can be decided mathematically. The perimeter and area of these two
shapes are respectively:
𝑃𝑃(hexagon) = 6 ∙ 𝑟𝑟� (1)
𝑃𝑃(square) = 4 ∙ 𝑐𝑐 (2)
𝐴𝐴(hexagon) =3√32 ∙ 𝑟𝑟�� (3)
𝐴𝐴(square) = 𝑐𝑐� (4)
Setting the areas of the two shapes equal so that each one accommodates the same number of particles gives, using (3) and (4) :
𝑐𝑐�=3√3
2 ∙ 𝑟𝑟�� (5)
Inserting this value into (2) gives:
𝑃𝑃(square) = 4 ∙ ��√�� ∙ 𝑟𝑟� (6)
Which in comparison with (1) yields,
𝑃𝑃(hexagon) < 𝑃𝑃(square) (7)
A hexagon has a shorter perimeter than a square with the same area. This area/perimeter ratio is preferable to optimize the detection efficiency. A hexagonal mesh was therefore chosen for the collimator grid.
This choice is also justified by manufacturing constraints. For equivalent areas indeed, the side length of a square (c) is shorter than that of a hexagonal cell (2 ∙ 𝑟𝑟�). For the fabrication of grids with very narrow cells, machining size limits will be reached sooner with square cells. A hexagonal mesh appears to be the best alternative. Pöllänen et al. also chose this geometry [1].
B. Cell dimensions
Fig. 3. Cross-sectional representation of the grid modeled with MCNP6, as visualized in VisEd. The diameter of the grid is 5 cm. The walls are 64 µm thick.
The following characteristics of the hexagonal cells were optimized:
- The collimation height, H,
- The apothem of the hexagonal cells, a,
The simulated setup is shown in Fig. 1 (B). A number of parameters were kept fixed:
collimator between the sample or source and the window of the detector to select alpha particles with a small angle of incidence. Once the particle beam is collimated, the alpha particles with too large an angle of incidence, i.e. those with the longest path lengths in air, cannot reach the detector (Fig. 1). The particles that are detected will all have traveled a similar distance, improving the energy resolution of the spectra.
Fig. 1. Schematic representation of alpha particle selection using a collimator grid [2]. In the absence of the grid (A), all particles are detected, regardless of their angle of incidence. With the grid, only particles with a small angle of incidence are detected (α1 et α2). H is the collimation height and 2a is the cell width.
It has been shown [1] that 239Pu, 241Am and 244Cm can be distinguished. This alpha ray detection technique was developed in the 1980s in the context of assessing atmospheric contamination [3]. It is still used to identify the proportion of alpha radiation from radon in certain air-monitoring beacons with radial fin grids [4]. The resolution can reach 120–130 keV for the alpha peak of 241Po at 7.686 MeV [2].
The aim of the present study was to optimize the collimator grid design using numerical simulations with the Monte-Carlo MCP6 (Monte-Carlo N-Particle) code [5] so that the resolution is high enough to discriminate between certain alpha emitters. Laboratory tests were performed to validate the design of the chosen grids.
III. MATERIALS AND SIMULATION
A. Materials
Laboratory alpha spectrometers in vacuum chambers commonly employ PIPS (Passivated Implanted Silicon) detectors [6]. These silicon semiconductor detectors are generally chosen for their low cost and the energy resolution they offer, on the order of 30–80 keV for routine measurements [7]. The thinner the active layer is, the better the resolution is. This high performance is due to a thin dead layer (50 nm of Si). The detectors used in this study were CAM (Continuous Air Monitoring) PIPS detectors [8]. They are specifically designed for continuous use in air, notably in air-monitoring beacons. Because of the conditions in which they are used and because of the light-sensitivity of silicon, CAM PIPS detectors have
more protective layers than standard ones [8]. These extra layers increase the thickness of the dead layer on the detection window by 1.5–2 µm Si-equivalent [6][8].
CAM PIPS detectors are available in a wide range of sizes. Those used in air-monitoring beacons are usually small. The detector used in this work was the CAM2000 produced by MIRION Technologies. It has an active surface of 2000 mm2 and a thickness of 300 µm Si. It active area is one of the largest available. It was chosen to optimize the studied surface. The recommended operating voltages for this type of detector are +24 V or +70 V, giving theoretical resolutions of 34.4 keV and 28 keV, respectively (performance tests performed under vacuum [8]). At +70 V, the layer is fully depleted.
The detection chain was provided by MIRION Technologies. The detector is associated with a 2018EB preamplifier and a LYNX multichannel analyzer. This combination offers a maximum theoretical count rate of 2 x 10⁶ MeV/s according to the manufacturer. The alpha spectra are analyzed using the software Genie 2000 with the alpha analysis module [9].
Electrodeposited reference sources were used for the laboratory measurements. They consisted of an active layer 15 mm in diameter electrodeposited on a 0.5 mm thick stainless-steel disk. The energy broadening due to deposition process is less than 20 keV for these sources [10]. Self-absorption in the sources is assumed negligible. This assumption was verified by simulating 241Am alpha rays broadened by 20 keV. The resulting peak’s resolution differed by 1.4% with respect to a simulation performed with discrete lines. The radionuclides available for this study were 239Pu, 241Am and 244Cm, with respective activities of 2979 Bq, 3295 Bq and 2717 Bq on 4 March 2019. The relative uncertainty on the source activities is 1%. Table I lists the energies of the main alpha particles emitted by these radionuclides [11].
TABLEI
MAIN ALPHA PARTICLE ENERGIES OF ELECTRODEPOSITED REFERENCE SOURCES
239Pu 241Am 244Cm
Energy
(keV) Intensity (%) Energy (keV) Intensity (%) Energy (keV) Intensity (%) 5 156.59
5 143.82 5 105.81
70.75 17.14 11.87
5 486.46 5 442.86 5 388.25
84.45 13.23 1.66
5 804.77
5 762.65 76.7 23.3
B. Simulation
The detector/grid/source setup was modeled using the MCNP6 calculation code [5]. The detector dimensions were set to the values specified by the manufacturer (section III.A).
The grid was modeled using a lattice structure (repeated hexagonal elements with LAT=1 in a mesh universe created with the U card). This approach reduces modeling and calculation times.
The most appropriate tally to model the response of the CAM2000 detector is the F8 tally, which gives the distribution of energies deposited in the detector characteristic of an alpha spectrum. Each calculation was launched with 5 x 10⁷ histories and the statistical error was no more than 5%.
Simulations were also performed to energy calibrate the
experimental spectra. Care was taken to ensure they were representative. Comparisons between simulations and experimental measurements were used in this study to determine the systematic error associated with the simulated spectra, as discussed in the following.
IV. DESIGN BY MONTE-CARLO SIMULATION
Table II lists the different parameters used in this section to describe the geometry of the collimator grid. A “cell” is defined as one complete element in the lattice.
TABLEII
LIST OF PARAMETERS CHARACTERIZING A MESH CELL
Symbol Definition
e Wall thickness of a cell
H Collimation height or height of a cell
r Radius of a circular cell
c Side length of a square cell
d Diagonal length of a square cell
a Apothem of a hexagonal cell; radius of the inscribed circle
rc Radius of the circumcircle of a hexagonal cell; side length of a regular hexagon
P Perimeter of a cell
A Area of a cell
The geometric shapes correspond to the face of the cell perpendicular to the alpha particle beam and parallel to the detector. The hexagonal mesh is composed of regular hexagons.
A. Choice of mesh geometry
The first stage involved choosing the mesh geometry best adapted for alpha particle detection. It should not restrict the energy resolution of the detector or its energy efficiency.
Hexagonal, square and circular meshes with identical surface areas were compared. Contrary to the hexagonal and square meshes, a circular mesh does not give complete surface coverage (Fig. 2). This is because the walls of round cells require extra material to fill the intercellular space. With a circular mesh, the alpha particles are thus more likely to encounter the cell walls, reducing the detection efficiency. The circular mesh was therefore not chosen for the rest of the study.
Fig. 2. Diagrams of a circular and a hexagonal mesh. The cell walls are shown in grey. The walls of the circular mesh are thicker because the intercellular space is larger.
The choice between a hexagonal and a square mesh can be decided mathematically. The perimeter and area of these two
shapes are respectively:
𝑃𝑃(hexagon) = 6 ∙ 𝑟𝑟� (1)
𝑃𝑃(square) = 4 ∙ 𝑐𝑐 (2)
𝐴𝐴(hexagon) =3√32 ∙ 𝑟𝑟�� (3)
𝐴𝐴(square) = 𝑐𝑐� (4)
Setting the areas of the two shapes equal so that each one accommodates the same number of particles gives, using (3) and (4) :
𝑐𝑐�=3√3
2 ∙ 𝑟𝑟�� (5)
Inserting this value into (2) gives:
𝑃𝑃(square) = 4 ∙ ��√�� ∙ 𝑟𝑟� (6)
Which in comparison with (1) yields,
𝑃𝑃(hexagon) < 𝑃𝑃(square) (7)
A hexagon has a shorter perimeter than a square with the same area. This area/perimeter ratio is preferable to optimize the detection efficiency. A hexagonal mesh was therefore chosen for the collimator grid.
This choice is also justified by manufacturing constraints. For equivalent areas indeed, the side length of a square (c) is shorter than that of a hexagonal cell (2 ∙ 𝑟𝑟�). For the fabrication of grids with very narrow cells, machining size limits will be reached sooner with square cells. A hexagonal mesh appears to be the best alternative. Pöllänen et al. also chose this geometry [1].
B. Cell dimensions
Fig. 3. Cross-sectional representation of the grid modeled with MCNP6, as visualized in VisEd. The diameter of the grid is 5 cm. The walls are 64 µm thick.
The following characteristics of the hexagonal cells were optimized:
- The collimation height, H,
- The apothem of the hexagonal cells, a,
The simulated setup is shown in Fig. 1 (B). A number of parameters were kept fixed:
- The thickness of the cell walls, 64 µm. This is the value used by Pöllänen et al. in their study [1]. This thickness ensures that alpha particles of up to 9 MeV are completely blocked (about 20 µm are required to stop 9 MeV alpha particles).
- A surface source was modeled. Its active diameter was 4.7 cm to ensure that a large proportion of the detector’s active surface was illuminated. This is also the standard diameter of the filters used for swabbing.
- The grid diameter was 5 cm.
- There was a 1 mm gap between the window of the detector and the collimator grid, as required by the CAMP PIPS setup.
- The source/grid distance was set to 4 mm.
- The thickness of the dead layer was set to the most unfavorable value (2 µm).
Fig. 3 shows a cross-sectional top view of the collimator prepared using VisEd (Visual Editor for MCNP) [12].
The influence of H and of a on energy loss and the energy resolution and detection efficiency of the device was studied by simulation. The energy of the incident alpha particles was varied from 3 to 9 MeV (the emission energy range of alpha particles) in 2 MeV steps. This article only reports the data obtained with 7 MeV incident particles.
Fig. 4 shows how the relative resolution varies as a function of the apothem of hexagonal cells for different collimation heights. The relative resolution is defined as
FWHM(%) = ∆𝑐𝑐𝑐𝑐 ∙ 100 (8)
Where ∆𝑐𝑐 is the full-width at half maximum of the alpha peak in number of channels and 𝑐𝑐 is the channel of the center of the peak.
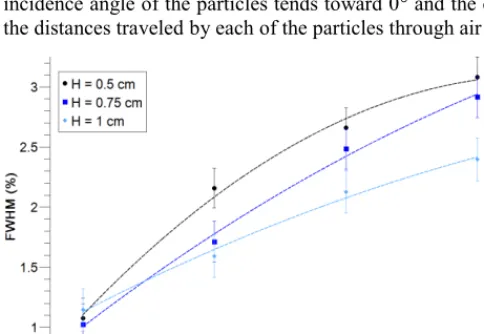
The highest resolutions, less than 1.2%, are achieved with configurations in which the apothem is small (a = 1 mm). The energy resolution can also be improved by increasing the collimation height. The larger H is indeed, the more the incidence angle of the particles tends toward 0° and the closer the distances traveled by each of the particles through air are.
Fig. 4. Evolution of the relative resolution as a function of the apothem of the cells and the collimation height, H, for incident particles with an energy of 7 MeV. The curves are 2nd degree polynomial fits.
Fig. 5 shows the evolution of the absolute detection efficiency as a function of the apothem of the cells for different
collimation heights. The energy of the incident particles was once again 7 MeV. The absolute efficiency is given by:
𝜀𝜀���=𝐴𝐴 ∙ 𝐼𝐼 ∙ 𝑡𝑡𝑁𝑁��� (9)
With 𝑁𝑁���, the number of counts in the interval of interest around the alpha peak, A, the activity of the source in Bq, I the emission intensity of the alpha particles (here, 100%), and t the acquisition time in s.
The larger the cells are (a = 4 mm), the higher the detection efficiency is. Small collimation heights also improve the efficiency.
Fig. 5. Evolution of the detection efficiency as a function of the apothem of the cells and the collimation height, H, for incident particles with an energy of 7 MeV. The curves are 2nd degree polynomial fits.
These results show that a compromise is required. Given the activity of the nuclear waste in Fontenay-aux-Roses (several thousand Bq per radionuclide), detection efficiency does not seem to be the most important criterion. A small collimation height (H = 0.5 cm) can nevertheless be chosen to limit the loss of efficiency and limit the energy loss of the alpha particles, particularly for those with low energies (Table III).
TABLEIII
ENERGY LOSS OF INCIDENT ALPHA PARTICLES AS A FUNCTION OF THE GRID’S COLLIMATION HEIGHT
Incident
energry 3 MeV 5 MeV 7 MeV 9 MeV
H = 0.5 cm 1.806 1.242 0.963 0.795
H = 1 cm 2.650 1.757 1.333 1.094
Energy losses are given in MeV. The uncertainty on the energy loss values is ± 0.005 MeV. The amount of energy lost does not depend on the size of the cells.
With a collimation height of 0.5 cm, the energy resolution of the detector is optimal with an apothem of 1 mm (Fig. 4 and Fig. 6). Fig. 6 shows simulated alpha spectra for incident particles of 7 MeV. They highlight the effect of the detection geometry on the shape of the alpha peak. With a large apothem (a = 4 mm), the characteristic alpha peak shape is observed, namely a double exponential convoluted with a Gaussian [13]. Decreasing the apothem reduces the left tail of the peak, until an almost pure Gaussian is obtained (the gray spectrum for a = 1 mm). Obtaining this type of spectrum is promising for the discrimination of transuranic elements that emit alpha particles at similar energies. Furthermore, the removal of the left tail should allow the deconvolution of the alpha spectra to be
optimized. This was confirmed by simulating the alpha spectrum of a legacy waste package from Fontenay-aux-Roses (Fig. 7), assuming a surface source.
Fig. 6. Ambient pressure alpha spectra simulated using MCNP6 for different apothems and a collimation height of 0.5 cm. The energy of the incident alpha particles was 7 MeV.
Fig. 7. Simulated ambient pressure alpha spectra of a waste package from Fontenay-aux-Roses. The grid had a collimation height of 0.5 cm. Simulations were performed with different apothem values.
The major alpha emitters in this characteristic spectrum are 238,239,240Pu, 241Am and 244Cm. Their daughter nuclei make negligible contributions (less than 10-9%) and were not included in the simulation. Fig. 7 shows that certain grid geometries allow the following groups of radionuclides to be distinguished from each other:
- 239Pu + 240Pu - 241Am + 238Pu - 244Cm
When the apothem is very small (a = 1 mm), the three alpha peaks can be analyzed without deconvolution. To allow for potential operational imperfections (self-absorption in the source, additional material between the sample and the detector, etc.), it is preferable to choose the setup with the highest energy resolution.
Two grids were therefore chosen: one to facilitate the discrimination between alpha peaks, with H = 0.5 cm and a = 1 mm, and the other, with a higher detection efficiency, with H = 0.5 cm and a = 2 mm. The detection efficiency is three times higher with the second grid and the resolution remains good enough to distinguish the three peaks, with deconvolution in
some cases. The theoretical energy resolutions of the two grids are presented in Table IV. Note that since the source/grid distance is 4 mm, the source is 10 mm away from the detector. The thickness of the dead layer was set to 2 µm (the most unfavorable value).
TABLEIV
THEORETICAL ENERGY RESOLUTIONS WITH THE TWO GRIDS
Grids Radionuclide groups FWHM (%) FWHM (keV)
H = 0.5 cm
a = 1 mm
239Pu + 240Pu 2.41 ± 0.25 95.0 ± 9.9
238Pu + 241Am 2.19 ± 0.23 94.8 ± 10.0
244Cm 1.92 ± 0.21 90.1 ± 9.9
H = 0.5 cm
a = 2 mm
239Pu + 240Pu 3.56 ± 0.25 140.0 ± 9.8
238Pu + 241Am 3.49 ± 0.23 150.0 ± 9.9
244Cm 2.78 ± 0.21 129.6 ± 9.8
The resolution values in keV are calculated from the detected energies (after attenuation).
V. EXPERIMENTAL DEVICE
A. Making of the collimator grids
Fig. 8. Stainless steel collimator grids prepared by electrical discharge machining. In the grid on the left, the cells have an apothem of 2 mm and in the grid on the right, the apothem is 1 mm.
The radioactive operating environment of the collimator grid prevented the use of certain materials, notably aluminum, which releases gaseous H2 when corroded [14]. The properties required for the grid material are that it should be simple to machine, sufficiently hard to resist possible impacts, easily decontaminated and compatible with the waste.
The collimator grids were therefore produced in stainless steel using electrical discharge machining. The uncertainty on the cell walls with this technique was ± 0.01 mm. The dimensions chosen for the grid meant that the thickness of the cell walls had to be increased to 200 µm to ensure the grid remained rigid and avoid mesh breakage. This increased thickness does not have a significant effect on the detection efficiency compared with the 64 µm considered initially. The two electrical-discharge machined grids are shown in Fig. 8 B. Acquisition parameters
A 2000 mm2 CAM PIPS detector was used. The data were acquired with a bias voltage of 70 V to maximize the energy resolution of the device [6][8]. The parameters chosen for the acquisition of the spectrum were:
- The thickness of the cell walls, 64 µm. This is the value used by Pöllänen et al. in their study [1]. This thickness ensures that alpha particles of up to 9 MeV are completely blocked (about 20 µm are required to stop 9 MeV alpha particles).
- A surface source was modeled. Its active diameter was 4.7 cm to ensure that a large proportion of the detector’s active surface was illuminated. This is also the standard diameter of the filters used for swabbing.
- The grid diameter was 5 cm.
- There was a 1 mm gap between the window of the detector and the collimator grid, as required by the CAMP PIPS setup.
- The source/grid distance was set to 4 mm.
- The thickness of the dead layer was set to the most unfavorable value (2 µm).
Fig. 3 shows a cross-sectional top view of the collimator prepared using VisEd (Visual Editor for MCNP) [12].
The influence of H and of a on energy loss and the energy resolution and detection efficiency of the device was studied by simulation. The energy of the incident alpha particles was varied from 3 to 9 MeV (the emission energy range of alpha particles) in 2 MeV steps. This article only reports the data obtained with 7 MeV incident particles.
Fig. 4 shows how the relative resolution varies as a function of the apothem of hexagonal cells for different collimation heights. The relative resolution is defined as
FWHM(%) = ∆𝑐𝑐𝑐𝑐 ∙ 100 (8)
Where ∆𝑐𝑐 is the full-width at half maximum of the alpha peak in number of channels and 𝑐𝑐 is the channel of the center of the peak.
The highest resolutions, less than 1.2%, are achieved with configurations in which the apothem is small (a = 1 mm). The energy resolution can also be improved by increasing the collimation height. The larger H is indeed, the more the incidence angle of the particles tends toward 0° and the closer the distances traveled by each of the particles through air are.
Fig. 4. Evolution of the relative resolution as a function of the apothem of the cells and the collimation height, H, for incident particles with an energy of 7 MeV. The curves are 2nd degree polynomial fits.
Fig. 5 shows the evolution of the absolute detection efficiency as a function of the apothem of the cells for different
collimation heights. The energy of the incident particles was once again 7 MeV. The absolute efficiency is given by:
𝜀𝜀���=𝐴𝐴 ∙ 𝐼𝐼 ∙ 𝑡𝑡𝑁𝑁��� (9)
With 𝑁𝑁���, the number of counts in the interval of interest around the alpha peak, A, the activity of the source in Bq, I the emission intensity of the alpha particles (here, 100%), and t the acquisition time in s.
The larger the cells are (a = 4 mm), the higher the detection efficiency is. Small collimation heights also improve the efficiency.
Fig. 5. Evolution of the detection efficiency as a function of the apothem of the cells and the collimation height, H, for incident particles with an energy of 7 MeV. The curves are 2nd degree polynomial fits.
These results show that a compromise is required. Given the activity of the nuclear waste in Fontenay-aux-Roses (several thousand Bq per radionuclide), detection efficiency does not seem to be the most important criterion. A small collimation height (H = 0.5 cm) can nevertheless be chosen to limit the loss of efficiency and limit the energy loss of the alpha particles, particularly for those with low energies (Table III).
TABLEIII
ENERGY LOSS OF INCIDENT ALPHA PARTICLES AS A FUNCTION OF THE GRID’S COLLIMATION HEIGHT
Incident
energry 3 MeV 5 MeV 7 MeV 9 MeV
H = 0.5 cm 1.806 1.242 0.963 0.795
H = 1 cm 2.650 1.757 1.333 1.094
Energy losses are given in MeV. The uncertainty on the energy loss values is ± 0.005 MeV. The amount of energy lost does not depend on the size of the cells.
With a collimation height of 0.5 cm, the energy resolution of the detector is optimal with an apothem of 1 mm (Fig. 4 and Fig. 6). Fig. 6 shows simulated alpha spectra for incident particles of 7 MeV. They highlight the effect of the detection geometry on the shape of the alpha peak. With a large apothem (a = 4 mm), the characteristic alpha peak shape is observed, namely a double exponential convoluted with a Gaussian [13]. Decreasing the apothem reduces the left tail of the peak, until an almost pure Gaussian is obtained (the gray spectrum for a = 1 mm). Obtaining this type of spectrum is promising for the discrimination of transuranic elements that emit alpha particles at similar energies. Furthermore, the removal of the left tail should allow the deconvolution of the alpha spectra to be
optimized. This was confirmed by simulating the alpha spectrum of a legacy waste package from Fontenay-aux-Roses (Fig. 7), assuming a surface source.
Fig. 6. Ambient pressure alpha spectra simulated using MCNP6 for different apothems and a collimation height of 0.5 cm. The energy of the incident alpha particles was 7 MeV.
Fig. 7. Simulated ambient pressure alpha spectra of a waste package from Fontenay-aux-Roses. The grid had a collimation height of 0.5 cm. Simulations were performed with different apothem values.
The major alpha emitters in this characteristic spectrum are 238,239,240Pu, 241Am and 244Cm. Their daughter nuclei make negligible contributions (less than 10-9%) and were not included in the simulation. Fig. 7 shows that certain grid geometries allow the following groups of radionuclides to be distinguished from each other:
- 239Pu + 240Pu - 241Am + 238Pu - 244Cm
When the apothem is very small (a = 1 mm), the three alpha peaks can be analyzed without deconvolution. To allow for potential operational imperfections (self-absorption in the source, additional material between the sample and the detector, etc.), it is preferable to choose the setup with the highest energy resolution.
Two grids were therefore chosen: one to facilitate the discrimination between alpha peaks, with H = 0.5 cm and a = 1 mm, and the other, with a higher detection efficiency, with H = 0.5 cm and a = 2 mm. The detection efficiency is three times higher with the second grid and the resolution remains good enough to distinguish the three peaks, with deconvolution in
some cases. The theoretical energy resolutions of the two grids are presented in Table IV. Note that since the source/grid distance is 4 mm, the source is 10 mm away from the detector. The thickness of the dead layer was set to 2 µm (the most unfavorable value).
TABLEIV
THEORETICAL ENERGY RESOLUTIONS WITH THE TWO GRIDS
Grids Radionuclide groups FWHM (%) FWHM (keV)
H = 0.5 cm
a = 1 mm
239Pu + 240Pu 2.41 ± 0.25 95.0 ± 9.9
238Pu + 241Am 2.19 ± 0.23 94.8 ± 10.0
244Cm 1.92 ± 0.21 90.1 ± 9.9
H = 0.5 cm
a = 2 mm
239Pu + 240Pu 3.56 ± 0.25 140.0 ± 9.8
238Pu + 241Am 3.49 ± 0.23 150.0 ± 9.9
244Cm 2.78 ± 0.21 129.6 ± 9.8
The resolution values in keV are calculated from the detected energies (after attenuation).
V. EXPERIMENTAL DEVICE
A. Making of the collimator grids
Fig. 8. Stainless steel collimator grids prepared by electrical discharge machining. In the grid on the left, the cells have an apothem of 2 mm and in the grid on the right, the apothem is 1 mm.
The radioactive operating environment of the collimator grid prevented the use of certain materials, notably aluminum, which releases gaseous H2 when corroded [14]. The properties required for the grid material are that it should be simple to machine, sufficiently hard to resist possible impacts, easily decontaminated and compatible with the waste.
The collimator grids were therefore produced in stainless steel using electrical discharge machining. The uncertainty on the cell walls with this technique was ± 0.01 mm. The dimensions chosen for the grid meant that the thickness of the cell walls had to be increased to 200 µm to ensure the grid remained rigid and avoid mesh breakage. This increased thickness does not have a significant effect on the detection efficiency compared with the 64 µm considered initially. The two electrical-discharge machined grids are shown in Fig. 8 B. Acquisition parameters
A 2000 mm2 CAM PIPS detector was used. The data were acquired with a bias voltage of 70 V to maximize the energy resolution of the device [6][8]. The parameters chosen for the acquisition of the spectrum were:
was less than 400. Adjusting the P/Z is critical to avoid pile-up and alpha peak distortion.
The Rise Time was set to 4 µs, the value that optimizes the energy resolution in our setup, irrespective of the applied voltage (70 or 24 V). The corresponding dead time is 0.04 %.
The Flat Top was set to 0.2 µs.
The alpha spectra were acquired over 1024 channels to improve the counting statistics.
The source/grid distance was set to 2 mm (not 4 mm as previously) to improve the resolution, giving a source/detector distance of 8 mm.
Data were acquired with electrodeposited 239Pu, 241Am and 244Cm sources, separately for each radionuclide. The final spectrum was assembled by summing the three spectra obtained. The presence of impurities in the source is apparent, notably 239Pu impurities in the 244Cm source. This leads to a systematic error of -1.965 % in the combined spectrum for number of counts in the 239Pu alpha peak.
The acquisition time was 15 min per radionuclide. Under these conditions the detection efficiency variation was 0.662 % and the variation of the full-width at half maximum, 5.194 %. The latter can be reduced by acquiring the alpha spectra over 2048 channels.
C. Energy calibration
Energy calibration cannot be performed directly on experimental spectra because of the energy lost by the alpha particles between the source and the window of the detector.
The energies actually detected can be determined either by Monte-Carlo simulation, with the MCNP6 calculation code for instance, or by using the SRIM (Stopping and Range of Ions in Matter) [15] or the NIST ASTAR (Stopping power and range tables for helium ions) [16] database.
In both cases, with MCNP6 and with SRIM/ASTAR, precise knowledge of the CAMP PIPS detector geometry is required, in particular the thickness of the dead layer. It is listed as being between 1.5 and 2 µm Si-equivalent. In the setup considered here, the alpha particles also travel 8 mm before reaching the detector.
An initial rapid energy calibration was carried out using the SRIM database, and Table V shows the theoretical detected energies of the alpha particles emitted by 239Pu, 241Am and 244Cm obtained in this way. This calibration was also used to
characterize the energy resolution of the device (in keV).
TABLEV
THEORETICAL ENERGIES CALCULATED USING THE SRIM DATABASE
Maximum incident
energy Detected energy
239Pu 5.156 4.162 ± 0.040
241Am 5.486 4.536 ± 0.038
244Cm 5.804 4.893 ± 0.036
The energies are given in MeV and represent the energies detected by the CAM PIPS detector for alpha particles that have passed through 8 mm of air and (1.75 ± 0.25) µm Si-equivalent of dead layer. The maximum incident energies are the main emission lines of the radionuclides in Table I.
Subsequently, all the spectra were energy calibrated using MCNP6, the difference between the SRIM and MCNP6 calibrations being just 0.5 %.
D. Experimental results and comparison with simulations Experimental and simulated spectra were compared to verify the reliability of the model and thus validate its use in future investigations, such as understanding the effects of the operational parameters.
The reliability of the model was first tested in a setup without the grid. Individual measurement was made for the three sources, 239Pu, 241Am and 244Cm, so that the integrated area of the alpha peaks could be calculated rapidly. The final spectrum was obtained by co-adding the three individual spectra. In this case, the sources were placed 1.34 cm from the active surface of the CAMP PIPS detector. The acquisition time was 15 min. Fig. 9 shows a comparison of the simulated and the experimental spectrum.
Fig. 9. Comparison of experimental and simulated alpha spectra with no grid in place between the source and the detector. The measurements were performed under ambient conditions.
The experimental energy resolutions of the 239Pu, 241Am and 244Cm peaks are (722 ± 42) keV, (740 ± 43) keV and (695 ± 40) keV, respectively. The uncertainties are large here because the data were acquired over 1024 channels to increase the counting statistics. The signals from the three radionuclides cannot be quantified separately without using spectral deconvolution software [17].
The systematic error on the detection efficiency for the simulated spectrum is less than 2%. The systematic error on the energy resolution is less than 5% for all three radionuclides.
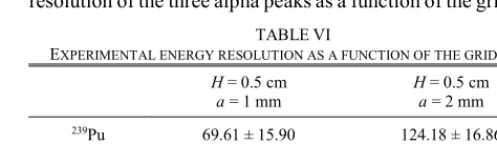
The analysis was repeated using the two grids presented in Fig. 8. The sources were placed 8 mm from the detector. Fig. 10 presents the spectra obtained and Table VI gives the energy resolution of the three alpha peaks as a function of the grid used.
TABLEVI
EXPERIMENTAL ENERGY RESOLUTION AS A FUNCTION OF THE GRID USED H = 0.5 cm
a = 1 mm Ha = 0.5 cm = 2 mm 239Pu 69.61 ± 15.90 124.18 ± 16.86
241Am 69.73 ± 15.93 124.57 ± 16.90
244Cm 77.92 ± 16.11 125.00 ± 16.95
The energy resolutions are expressed in keV. The corresponding uncertainties were calculated using (8) and the actually detected energies given in Table V.
239Pu
241Am
244Cm
The experimental results show that adding a grid allows the peaks from the three radionuclides 239Pu, 241Am and 244Cm to be distinguished, particularly the finer grid (a = 1 mm) which improves the resolution by 70–77 keV for 5–6 MeV incident particles. In this case, no deconvolution of the spectrum is required. Furthermore, the absolute experimental efficiency is as predicted by simulation (Fig. 5) with a mean efficiency of about (0.740 ± 0.012) % for a = 1 mm and (3.030 ± 0.039) % for a = 2 mm.
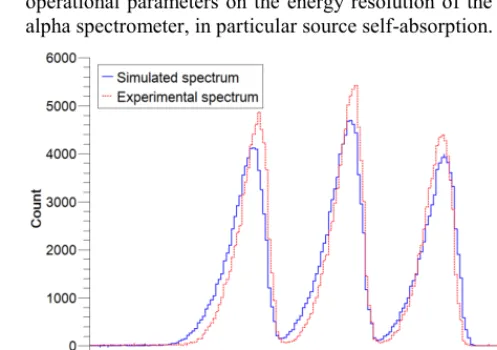
Fig. 10. Comparison of simulated and experimental spectra. The spectra were acquired with grids whose apothem was (A) 1 mm and (B) 2 mm. The black arrows indicate distortions in the simulated alpha spectra.
The energy resolutions in the alpha spectra simulated using MCNP6 are representative of those in the experimental spectra, except for the 241Am peak with the coarser grid, for which the relative error is 33%.
The models are less reliable in reproducing the detection efficiency. Although the spectra in Fig. 10 (A) appear close on visual inspection, the systematic error for the simulated detection efficiency is 14.2% for the 239Pu peak. This error is less 3.3% for the other peaks. There are clear differences in Fig. 10 (B) between the simulated and experimental data, with a systematic error of 20 % for the 244Cm peak. However, distortions in the simulated spectrum are visible for the 241Am and 244Cm peaks. They are similar to those observed in Fig. 7, particularly for 244Cm, which are more prominent for the coarser grid. They are not present on all the simulated peaks (239Pu does not seem to be affected in Fig. 10 (B)) and no distortions are observed in the experimental spectrum. These distortions are most probably the cause of the 33% relative error
on the resolution of the simulated 241Am peak with the coarser grid.
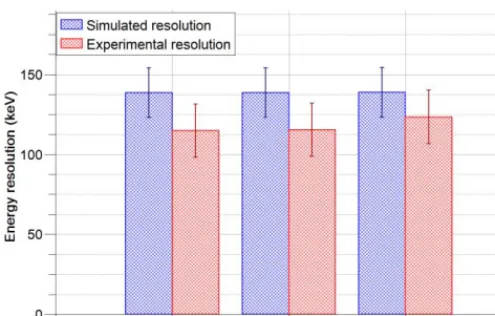
The origin of these distortions is presumably not the model of the CAM PIPS detector because the experiment/simulation comparison without the grid showed that it was reliable. Moreover, adjusting the thickness of the dead layer to 1.5 and 2 µm does not reduce the systematic error in the presence of the grid. The origin of the error must therefore be the grid model. The grid was modeled using a lattice structure. Modeling an isolated cell (i.e. without a lattice) showed that the resulting alpha spectrum was not distorted. A simulation of the device was performed with each cell of the larger grid (only those illuminated by the source) modeled individually. Fig. 11, Fig. 12 and Table VII show the results obtained in comparison with the experimental spectrum.
TABLEVII
SYSTEMATIC ERROR OF THE SIMULATED DETECTION EFFICIENCY WITH RESPECT TO EXPERIMENT
Simulated
efficiency Experimental efficiency Systematic error 239Pu 3.160±0.036% 2.990±0.039% 5.69%
241Am 3.145±0.035% 3.033±0.039% 3.70%
244Cm 3.187±0.036% 3.074±0.040% 3.69%
Results shown for the coarser grid only. The cells in the grid were modeled individually.
These results confirm that the use of repeated structures in MCNP6 can create problems in the simulations, such as distortions of the spectrum, which potentially affect the energy resolution and the detection efficiency. These problems can nonetheless be overcome by modeling each cell in the grid individually. In this case, the simulation reproduces:
- The detection efficiency with a systematic error of less than 6 % over the energy range of interest.
- The energy resolution, with differences between simulation and experiment within the uncertainty range. MCNP6 is sufficiently reliable to be used for the rest of the project, in particular to study the potential negative effects of operational parameters on the energy resolution of the in situ alpha spectrometer, in particular source self-absorption.
was less than 400. Adjusting the P/Z is critical to avoid pile-up and alpha peak distortion.
The Rise Time was set to 4 µs, the value that optimizes the energy resolution in our setup, irrespective of the applied voltage (70 or 24 V). The corresponding dead time is 0.04 %.
The Flat Top was set to 0.2 µs.
The alpha spectra were acquired over 1024 channels to improve the counting statistics.
The source/grid distance was set to 2 mm (not 4 mm as previously) to improve the resolution, giving a source/detector distance of 8 mm.
Data were acquired with electrodeposited 239Pu, 241Am and 244Cm sources, separately for each radionuclide. The final spectrum was assembled by summing the three spectra obtained. The presence of impurities in the source is apparent, notably 239Pu impurities in the 244Cm source. This leads to a systematic error of -1.965 % in the combined spectrum for number of counts in the 239Pu alpha peak.
The acquisition time was 15 min per radionuclide. Under these conditions the detection efficiency variation was 0.662 % and the variation of the full-width at half maximum, 5.194 %. The latter can be reduced by acquiring the alpha spectra over 2048 channels.
C. Energy calibration
Energy calibration cannot be performed directly on experimental spectra because of the energy lost by the alpha particles between the source and the window of the detector.
The energies actually detected can be determined either by Monte-Carlo simulation, with the MCNP6 calculation code for instance, or by using the SRIM (Stopping and Range of Ions in Matter) [15] or the NIST ASTAR (Stopping power and range tables for helium ions) [16] database.
In both cases, with MCNP6 and with SRIM/ASTAR, precise knowledge of the CAMP PIPS detector geometry is required, in particular the thickness of the dead layer. It is listed as being between 1.5 and 2 µm Si-equivalent. In the setup considered here, the alpha particles also travel 8 mm before reaching the detector.
An initial rapid energy calibration was carried out using the SRIM database, and Table V shows the theoretical detected energies of the alpha particles emitted by 239Pu, 241Am and 244Cm obtained in this way. This calibration was also used to
characterize the energy resolution of the device (in keV).
TABLEV
THEORETICAL ENERGIES CALCULATED USING THE SRIM DATABASE
Maximum incident
energy Detected energy
239Pu 5.156 4.162 ± 0.040
241Am 5.486 4.536 ± 0.038
244Cm 5.804 4.893 ± 0.036
The energies are given in MeV and represent the energies detected by the CAM PIPS detector for alpha particles that have passed through 8 mm of air and (1.75 ± 0.25) µm Si-equivalent of dead layer. The maximum incident energies are the main emission lines of the radionuclides in Table I.
Subsequently, all the spectra were energy calibrated using MCNP6, the difference between the SRIM and MCNP6 calibrations being just 0.5 %.
D. Experimental results and comparison with simulations Experimental and simulated spectra were compared to verify the reliability of the model and thus validate its use in future investigations, such as understanding the effects of the operational parameters.
The reliability of the model was first tested in a setup without the grid. Individual measurement was made for the three sources, 239Pu, 241Am and 244Cm, so that the integrated area of the alpha peaks could be calculated rapidly. The final spectrum was obtained by co-adding the three individual spectra. In this case, the sources were placed 1.34 cm from the active surface of the CAMP PIPS detector. The acquisition time was 15 min. Fig. 9 shows a comparison of the simulated and the experimental spectrum.
Fig. 9. Comparison of experimental and simulated alpha spectra with no grid in place between the source and the detector. The measurements were performed under ambient conditions.
The experimental energy resolutions of the 239Pu, 241Am and 244Cm peaks are (722 ± 42) keV, (740 ± 43) keV and (695 ± 40) keV, respectively. The uncertainties are large here because the data were acquired over 1024 channels to increase the counting statistics. The signals from the three radionuclides cannot be quantified separately without using spectral deconvolution software [17].
The systematic error on the detection efficiency for the simulated spectrum is less than 2%. The systematic error on the energy resolution is less than 5% for all three radionuclides.
The analysis was repeated using the two grids presented in Fig. 8. The sources were placed 8 mm from the detector. Fig. 10 presents the spectra obtained and Table VI gives the energy resolution of the three alpha peaks as a function of the grid used.
TABLEVI
EXPERIMENTAL ENERGY RESOLUTION AS A FUNCTION OF THE GRID USED H = 0.5 cm
a = 1 mm Ha = 0.5 cm = 2 mm 239Pu 69.61 ± 15.90 124.18 ± 16.86
241Am 69.73 ± 15.93 124.57 ± 16.90
244Cm 77.92 ± 16.11 125.00 ± 16.95
The energy resolutions are expressed in keV. The corresponding uncertainties were calculated using (8) and the actually detected energies given in Table V.
239Pu
241Am
244Cm
The experimental results show that adding a grid allows the peaks from the three radionuclides 239Pu, 241Am and 244Cm to be distinguished, particularly the finer grid (a = 1 mm) which improves the resolution by 70–77 keV for 5–6 MeV incident particles. In this case, no deconvolution of the spectrum is required. Furthermore, the absolute experimental efficiency is as predicted by simulation (Fig. 5) with a mean efficiency of about (0.740 ± 0.012) % for a = 1 mm and (3.030 ± 0.039) % for a = 2 mm.
Fig. 10. Comparison of simulated and experimental spectra. The spectra were acquired with grids whose apothem was (A) 1 mm and (B) 2 mm. The black arrows indicate distortions in the simulated alpha spectra.
The energy resolutions in the alpha spectra simulated using MCNP6 are representative of those in the experimental spectra, except for the 241Am peak with the coarser grid, for which the relative error is 33%.
The models are less reliable in reproducing the detection efficiency. Although the spectra in Fig. 10 (A) appear close on visual inspection, the systematic error for the simulated detection efficiency is 14.2% for the 239Pu peak. This error is less 3.3% for the other peaks. There are clear differences in Fig. 10 (B) between the simulated and experimental data, with a systematic error of 20 % for the 244Cm peak. However, distortions in the simulated spectrum are visible for the 241Am and 244Cm peaks. They are similar to those observed in Fig. 7, particularly for 244Cm, which are more prominent for the coarser grid. They are not present on all the simulated peaks (239Pu does not seem to be affected in Fig. 10 (B)) and no distortions are observed in the experimental spectrum. These distortions are most probably the cause of the 33% relative error
on the resolution of the simulated 241Am peak with the coarser grid.
The origin of these distortions is presumably not the model of the CAM PIPS detector because the experiment/simulation comparison without the grid showed that it was reliable. Moreover, adjusting the thickness of the dead layer to 1.5 and 2 µm does not reduce the systematic error in the presence of the grid. The origin of the error must therefore be the grid model. The grid was modeled using a lattice structure. Modeling an isolated cell (i.e. without a lattice) showed that the resulting alpha spectrum was not distorted. A simulation of the device was performed with each cell of the larger grid (only those illuminated by the source) modeled individually. Fig. 11, Fig. 12 and Table VII show the results obtained in comparison with the experimental spectrum.
TABLEVII
SYSTEMATIC ERROR OF THE SIMULATED DETECTION EFFICIENCY WITH RESPECT TO EXPERIMENT
Simulated
efficiency Experimental efficiency Systematic error 239Pu 3.160±0.036% 2.990±0.039% 5.69%
241Am 3.145±0.035% 3.033±0.039% 3.70%
244Cm 3.187±0.036% 3.074±0.040% 3.69%
Results shown for the coarser grid only. The cells in the grid were modeled individually.
These results confirm that the use of repeated structures in MCNP6 can create problems in the simulations, such as distortions of the spectrum, which potentially affect the energy resolution and the detection efficiency. These problems can nonetheless be overcome by modeling each cell in the grid individually. In this case, the simulation reproduces:
- The detection efficiency with a systematic error of less than 6 % over the energy range of interest.
- The energy resolution, with differences between simulation and experiment within the uncertainty range. MCNP6 is sufficiently reliable to be used for the rest of the project, in particular to study the potential negative effects of operational parameters on the energy resolution of the in situ alpha spectrometer, in particular source self-absorption.
Fig. 12. Comparison of the simulated and experimental energy resolutions for the alpha peaks of 239Pu, 241Am and 244Cm. Each cell in the grid was modeled individually. The apothem of the grid was 2 mm.
VI. CONCLUSION
These investigations have shown that alpha spectrometry under ambient conditions is experimentally feasible. The collimation method employed here allows the isotropic emissions to be controlled by only selecting the particles that reach the detector at close to perpendicular incidence. This reduces differences between the path lengths of each alpha particle and improves the energy resolution.
The collimator grids with hexagonal meshes were designed using the MCNP6 calculation code, revealing an inevitable compromise in their dimensions to optimize the energy resolution and the detection efficiency. A small collimation height, H, was thus chosen to preserve efficiency and limit the source/detector distance over which the alpha particles lose energy before reaching the active zone. The simulations identified two values for the apothem, a = 1 mm and a = 2 mm, to respectively favor the energy resolution and the detection efficiency.
Laboratory tests of the grids using electrodeposited sources validated their theoretical performances. The alpha peaks of 239Pu, 241Am and 244Cm can thus be distinguished without deconvolution and with and an energy resolution of about 70 keV for the alpha peaks of 239Pu and 241Am, and 77 keV for the peak from 244Cm with the finest collimator grid. The energy resolution of the coarser grid is poorer, no better than 125 keV for any of the alpha peaks, but the detection efficiency is three times higher.
Alpha spectrometry under ambient conditions with a collimator grid can distinguish the same groups of radionuclides as vacuum alpha spectrometry in a laboratory. The objective of this project is to use this method for the in situ analysis of nuclear waste. The technique requires no sample preparation, which will help increase throughput for the analyses and thus for the evacuation of the nuclear waste. Nonetheless, since the measurements are performed on smear samples, self-absorption of alpha particles during the swab process but also in the swab will have to be taken into account. Operational conditions will inevitably degrade the resolution obtained in this study (70 keV in optimal conditions for electrodeposited sources); to allow for these degradations, it is
preferable to choose the grid that provides the best resolution.
REFERENCES
[1] R. Pöllänen et al., “High-resolution alpha spectrometry at ambient
air pressure – Towards new applications,” Nucl. Instr. Meth. A, vol. 694, pp. 173—178, 2012.
[2] R. Pöllänen et al., “In-situ alpha spectrometry from air filters at
ambient air pressure,” Radiations Measurements, vol. 53—54, pp.
65—70, 2013.
[3] J.-C. Carossi et al., “Dispositif de contrôle de contamination
atmosphérique due à des aérosols émetteurs de particules alpha,” France. Patent 2 563 633, April, 27, 1984.
[4] MIRION TECHNOLOGIES: characteristics sheet of ABPM
203M, Online at <
https://mirion.app.box.com/s/eihrxkex0v45s2933ztf > (accessed
on May 2019)
[5] D. B. Pelowitz (Ed.), Los Alamos National Laboratory Report
LA-CP-11-01708, Los Alamos, 2011.
[6] MIRION TECHNOLOGIES: characteristics sheet PIPS Detectors,
Online at <
https://mirion.s3.amazonaws.com/cms4_mirion/files/pdf/spec-sheets/c39313_passivated_pips_super_spec_1.pdf?1557861393 >
(accessed on May 2019).
[7] Handbook of Radioactivity Analysis, 3rd ed., Elsevier Inc., Oxford, UK, 2012, pp. 380—390.
[8] MIRION TECHNOLOGIES: characteristics sheet CAM PIPS
detectors, Online at <
http://www.canberra.com/literature/detectors/application_notes/C
AM-PIPS-Detector-Properties-App-Note-C39167.pdf > (accessed
on May 2019).
[9] Genie 2000 3.3, Canberra Industries Inc., March 2013.
[10] Eckert & Ziegler: Alpha Spectroscopy sources, Online at <
https://www.ezag.com/home/products/isotope_products/isotrak_c alibration_sources/reference_sources/alpha_spectroscopy_sources / > (accessed on June 2019).
[11] LNHB, Nucleide-Lara: Library for gamma and alpha emissions,
Online at < www.nucleide.org/Laraweb/index.php > (accessed on April 2019).
[12] Vised version 2.7.E, generated using MCNPX, April 2011.
[13] G. Bortels et al., “Analytical function for fitting peaks in
alpha-particle spectra from Si detectors”, Appl. Radiat. Isot., vol. 38, pp. 831 – 837, 1987.
[14] K. Fujiwara et al., “Corrosion behavior of aluminium under
simulated environmental conditions of low-level waste,”
Corrosion Engineering, Science and Technology, vol. 52, pp. 162—165, 2017.
[15] J. F. Ziegler et al., “SRIM – The stopping and range of ions in
matter (2010)”, Nucl. Instr. Meth. B, vol. 268, pp. 1818—1823,
2010.
[16] M. J. Berger et al., ASTAR: Stopping-power and range tables for
helium ions, NIST, Online at <
https://physics.nist.gov/PhysRefData/Star/Text/ASTAR.html >
(accessed on April 2019).
[17] MIRION TECHNOLOGIES: Interactive Peak Fit option in Genie
2000 software, Online at <
https://www.mirion.com/products/genie-2000-interactive-peak-fit