Article
Calculating Point Cloud Object Volume using
Co-Opposite-Direction Slicing Method
Bin Li 1,*, Xiaowei Bi 1, Cheng Peng 1, Yong Chen 2, Xiaofa Zhao 3 and Chengsheng Yang 1,*
1 Dept. of Geomatics, School of Geology Engineering and Geomatics, Chang’an University, Xian
710054, China; [email protected] (B.L.); [email protected] (X.B.); [email protected] (C.P.); [email protected] (C.Y.)
2 Hebei Provincial Geological Environment Monitoring Institute, Shijiazhuang 050022, China;
[email protected] (Y.C.)
3 Shenzhen Cadastral Surveying and Mapping Office, Shenzhen 518000, China; [email protected]
(X.Z.)
* Correspondence: [email protected] (B.L.), 1862-908-2897; [email protected] (C.Y.), Tel.: +86-1348-826-5004 (C.Y.)
Abstract: Although the Slicing Method (SM) is effective for calculating the volume of point cloud objects (PCOs), it is restricted in terms of applicability and practicability because of a certain contingency and directional defects. The Co-Opposite-Direction Slicing Method (CODSM) proposed in this paper is an improved method for calculating PCO volume by increasing parallel (co-opposite-direction) observation and considering the two-way mean as the result. This method takes full advantage of the mutual offsetting of random errors and the compensation of systematic directional errors, which can effectively overcome (or mitigate) the effect of random errors and reduce the effect of systematic errors in SM. In this paper, two typical objects, a cone model and a stone lion base, are the examples for calculating PCO volume using CODSM. The results show that CODSM has all the inherent advantages of SM and effectively weakens the volatility of random errors and the directionality of systematic errors from SM. Therefore, CODSM is a robust configuration upgrade of SM.
Keywords: point cloud objects (PCOs); volume calculation (VC); co-opposite-direction slicing method (CODSM); systematic directional errors; random errors
1. Introduction
The volume calculation of PCOs (PCVC) is an effective way to obtain the volume of spatial objects [1-4], and is being widely applied in fields such as forestry, geology, engineering, transportation, navigation, and surveying and mapping [5-10]. Although a variety of PCVC methods are available [11,12], only two, namely segmenting [13] and slicing [14], can be considered precise and effective for irregular objects.
The traditional segmenting method consists of six steps [13], whereas the slicing method originating from it is simplified to five steps [15]. The main difference between these two methods is the lack of the projection link in the segmenting method. Without this projection link, the slicing method can avoid the inherent triple magnifying effects and the possible shape distortion effect commonly seen in the segmenting method [15]. However, since the shape of the slice varies with the slicing position, the volume calculation base of the single shape is bound to change accordingly, which distorts the final volume calculation results. Owing to these problems and pitfalls, the adaptability, reliability and robustness of the slicing method is affected and questioned in practical application which, to a certain extent, restricts its popularization and use. To effectively deal with the volume calculation distortion incurred by random errors and directionality of the slicing method, improvements are necessary in terms
of ensuring that its theoretical model and algorithm better satisfy the requirements of practical application and engineering of PCVC.
Based on these facts and existing SM, this paper makes use of the mutual compensation of random errors and the directional consistency of systematic errors [16] and proposes the Co-Opposite-Direction Slicing Method (CODSM), which increases parallel observations and uses the two-way mean as the result, for PCVC. As an improved method, CODSM tries to foster the strengths of the original method—maintaining the advantage of high efficiency, while circumventing the weaknesses—and eliminating shortcomings such as weak resistance against random errors and insufficient consideration of systematic directional errors. To verify the effectiveness of this algorithm, the focus of this paper was a PCVC experiment with CODSM by considering two working conditions for each of the two typical objects—a cone model and a stone lion base—to analyze and compare the results of CODSM with traditional SM. The results indicate that the CODSM proposed in this paper can effectively alleviate or even overcome the double adverse effects of error contingency and directionality. CODSM is therefore not only an upgrade for SM, but also a full-fledged practical and effective method for PCVC.
2. Methods
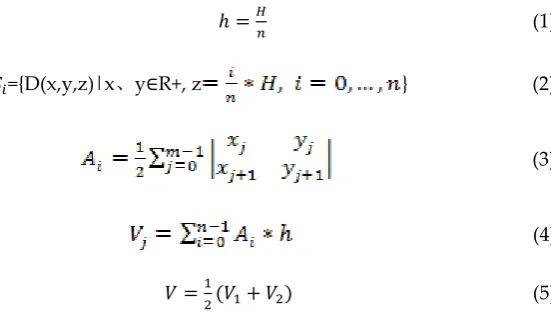
CODSM is derived from SM. The fundamental principles of CODSM in the forward (top-down) and reverse (bottom-up) directions for a laser scanned PCO which is sliced horizontally are summarized in the process shown in Figure 1. As shown in the figure, the PCO data 𝐷 can be obtained by object scanning; between the longitudinal minimum value 0 and maximum value H of the PCO, a set of (n+1) slices 𝑆𝑖 (as shown in equation (2)) with equal spacing (h, as
shown in equation (1)) in the horizontally forward or reverse directions can be obtained by forward or reverse slicing. The outline boundary is determined by the outline boundary
polygon . Calculating the area of polygon , as shown in equation (3), gives the area of the slices. The forward or reverse PCO volume 𝑉𝑗 (j=1, 2) can
then be obtained by accumulating the bottom area 𝐴𝑖 and then multiplying by h, as shown in
equation (4), where 𝑉1 and 𝑉2 are the forward and reverse slicing values of PCO volume,
Figure 1. Flow chart of point cloud object volume calculation with opposite-direction slicing method.
ℎ =𝐻
𝑛 (1)
𝑆𝑖={D(x,y,z)|x、y∈R+, z } (2)
(3)
(4)
𝑉 =1
2(𝑉1+ 𝑉2) (5)
In the above equations, H is the height of PCO; n+1 is the total number of forward or reverse slices; m is the number of polygonal vertices of the slice outline boundary; x, y, z are the polygonal vertex coordinates of the slice outline boundary; 𝑉1represents the forward PCO
volume; and 𝑉2represents the reverse PCO volume. The traditional slicing [14] is a one-way
SM. For basic slices, the shape is related to the slicing position (value z), and because each slice is surrounded by adjacent slices, the single volume varies with the slice and the slicing position. In other words, different slicing directions and spacings may produce different calculation results of 𝑉1 and 𝑉2 with SM. The CODSM, by taking the mean value of 𝑉1 and 𝑉2 as the
optimal estimation, can objectively eliminate random errors and may also reduce directional systematic errors, thus improving the reliability and precision of PCVC results. In other words, the CODSM based on the principle of “mean eliminating error” [16,17] has the advantage of complementary gains and losses, and thus can be considered a simple and effective PCVC method.
3. Experimental Model Design
To verify the effectiveness of CODSM, the experiment was designed and conducted using the highest possible PCO scanning resolution (1 mm) and the most complete slicing spacing (
Figure 2. Cone model, its size and point cloud data. (a) Measuring the radius and height of the cone model; (b) The cone model; (c) Point cloud data of the cone model.
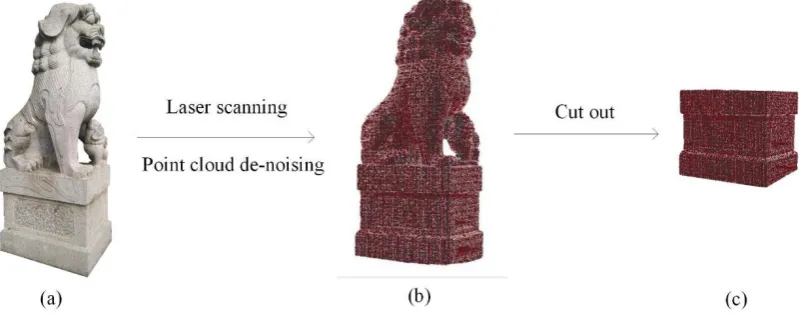
Figure 3. Physical map and point cloud data of the stone lion base. (a) The stone lion; (b) Point cloud data of the stone lion; (c) Point cloud data of the stone lion base.
3.1 Slicing Spacing Design
For the purpose of this experiment, it has been stipulated that the slicing spacing (hereinafter referred to as spacing) is h, the forward direction is from top to bottom, and the reverse direction is from bottom to top.
The value of h is set to satisfy the requirements of equation (6). When forward or reverse slicing is performed between the longitudinal minimum value 0 and the maximum value H of
the PCO, n+1 slices can be obtained. Since H is generally not divisible by h, there are n equally spaced slices with the spacing of h and 1 slice with a height less than h (set to ℎ𝑏). ℎ𝑏< ℎ and the segment corresponding to ℎ𝑏 is identified as the remnant of PCO
(hereinafter referred to as PCO remnant).
(6)
Here
.
When choosing the value of the slicing spacing
h
on the experiment scale, both the
precision of the estimation and representativity of the span were considered.
During the one-way forward or reverse PCO volume experiment of SM, the volume 𝑉 is composed of two parts—the main volume 𝑉𝑎 and the remnant volume 𝑉𝑏, which can be
calculated as shown in equations (7)-(9). 𝑉𝑎 corresponds to the main part of PCO with a height
of ℎ ∗ (𝑛 − 1), which can be divided by spacing h, while 𝑉𝑏 is the PCO remnant with a height
of ℎ𝑏.
(7)
𝑉
𝑏= 𝐴
𝑛∗ ℎ
𝑏(8)
ℎ
𝑏= (𝐻 − ℎ ∗ (𝑛 − 1))
(9)
𝑉 = 𝑉
𝑎+ 𝑉
𝑏(10)
Equations (7)–(10) are suitable for calculating the volumes of both forward and reverse PCOs, and their mean value is the final PCO volume as calculated by CODSM.
4. Results
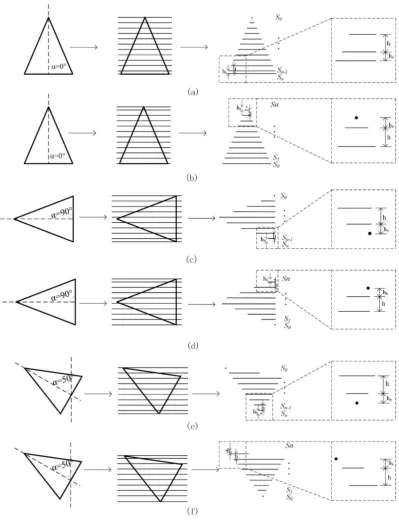
Taking the regular cone (shown in Figure 4) and the irregular stone lion base (shown in Figure 5) as examples, the experiment was conducted along their positive and oblique axes, respectively, followed by denoising [18-20] and calculation [14] of the PCO data for the laser scanned objects to verify the compensation, applicability and correctness of CODSM by both representative and general experiments.
4.1 Biaxial Experiment on the Cone
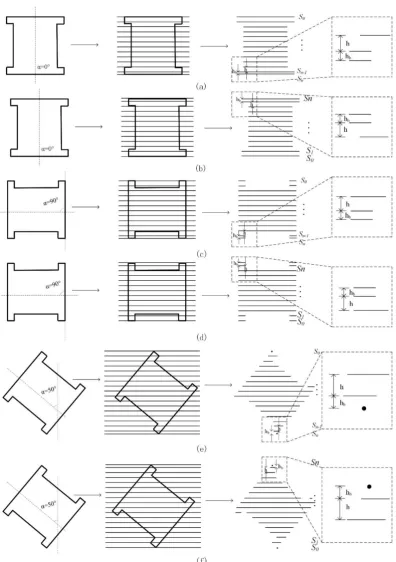
Figure 5. Schematic of test cutting form of oblique axis of stone lion base point cloud. (a) Sectional drawing of a normal positive axis; (b) Sectional drawing of a normal negative axis; (c) Sectional drawing of a transverse positive axis; (d) Sectional drawing of a transverse negative axis; (e) Sectional drawing of an oblique positive axis; (f) Sectional drawing of an oblique negative axis.
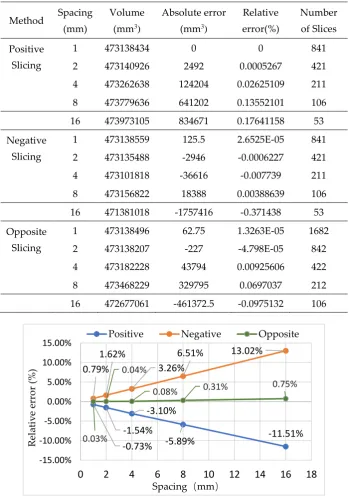
According to the positive axis SM shown in Figures 4a and 4b, spacings of 1 mm, 2 mm, 4 mm, 8 mm, and 16 mm have been adopted to calculate the one-way and co-opposite-direction forward and reverse PCO volumes along the positive axis of cone (as shown in Table 1). As the true volume of cone can be calculated [14] (473,142,270 mm³), the one-way and co-opposite-direction volumes and their relative errors can be calculated under different conditions; the results and trend are shown in Table 1 and Figure 6, respectively.
Table 1.
Comprehensive experimental results for normal axis of cone model.Method Spacing (mm)
Volume (mm3)
Absolute error (mm3)
Relative error(%) Number of Slices Positive Slicing
1 473138434 0 0 841
2 473140926 2492 0.0005267 421
4 473262638 124204 0.02625109 211
8 473779636 641202 0.13552101 106
16 473973105 834671 0.17641158 53
Negative Slicing
1 473138559 125.5 2.6525E-05 841
2 473135488 -2946 -0.0006227 421
4 473101818 -36616 -0.007739 211
8 473156822 18388 0.00388639 106
16 471381018 -1757416 -0.371438 53
Opposite Slicing
1 473138496 62.75 1.3263E-05 1682
2 473138207 -227 -4.798E-05 842
4 473182228 43794 0.00925606 422
8 473468229 329795 0.0697037 212
16 472677061 -461372.5 -0.0975132 106
Figure 6. Relative error diagram of volume calculation for normal axis of cone model.
As can be seen from Table 1 and Figure 6, the absolute values of volume errors along the positive axis of the cone in forward and reverse SM are both proportional to the slicing spacing, and the errors are almost the same but with opposite symbols. Thus, it can be inferred that
-0.73% -1.54% -3.10% -5.89% -11.51% 0.79% 1.62% 3.26% 6.51% 13.02% 0.03% 0.04%
0.08% 0.31% 0.75%
-15.00% -10.00% -5.00% 0.00% 5.00% 10.00% 15.00%
0
2
4
6
8
10
12
14
16
18
R el ati v e er ro r (%) Spacing(mm)
larger spacings result in larger the errors. However, the mean value of CODSM offsets the errors caused by the differences in slicing direction.
4.1.2 Oblique Axis Experiment of a Cone
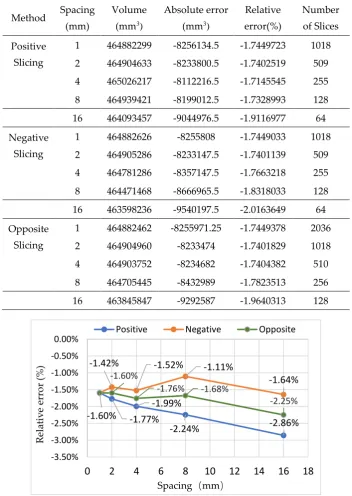
To discuss a more general scenario, for example one based on the oblique axis SM shown in Figures 4e and 4f, spacings of 1 mm, 2 mm, 4 mm, 8 mm, and 16 mm have been adopted to calculate the one-way and co-opposite-direction forward and reverse PCO volumes along the oblique axis of the cone (as shown in Table 2). For the same cone with a known volume, the volumes and their relative errors are shown in Table 2 and the trend is shown in Figure 7.
Table 2. Comprehensive experimental results for oblique axis of cone model.
Method Spacing (mm)
Volume (mm3)
Absolute error (mm3)
Relative error(%) Number of Slices Positive Slicing
1 464882299 -8256134.5 -1.7449723 1018
2 464904633 -8233800.5 -1.7402519 509
4 465026217 -8112216.5 -1.7145545 255
8 464939421 -8199012.5 -1.7328993 128
16 464093457 -9044976.5 -1.9116977 64
Negative Slicing
1 464882626 -8255808 -1.7449033 1018
2 464905286 -8233147.5 -1.7401139 509
4 464781286 -8357147.5 -1.7663218 255
8 464471468 -8666965.5 -1.8318033 128
16 463598236 -9540197.5 -2.0163649 64
Opposite Slicing
1 464882462 -8255971.25 -1.7449378 2036
2 464904960 -8233474 -1.7401829 1018
4 464903752 -8234682 -1.7404382 510
8 464705445 -8432989 -1.7823513 256
16 463845847 -9292587 -1.9640313 128
Figure 7. Relative error diagram of volume calculation for oblique axis of cone model.
-1.77% -1.99%
-2.24% -2.86%
-1.60%
-1.42% -1.52% -1.11%
-1.64% -1.60% -1.76% -1.68% -2.25% -3.50% -3.00% -2.50% -2.00% -1.50% -1.00% -0.50% 0.00%
0
2
4
6
8
10
12
14
16
18
R el ati v e er ro r (%) Spacing(mm)
As can be seen from Table 2 and Figure 7, although the volume calculation errors along the oblique axis of the cone by forward or reverse SM are roughly proportional to the slicing spacing, the volatility (or contingency) and directional errors have been observed to increase with spacing. However, the mean value of CODSM overcomes (or partially offsets) these contingency and directional errors. This is because the dominant direction of the one-way SM is unknown in advance and the mean error of CODSM ensures that it is smaller than the error of the forward slicing method.
4.2 Biaxial Experiment of a Stone Lion Base
As the forward and reverse shapes of a stone lion base are axisymmetric (i.e., there is upper and lower symmetry with the horizontal axis as the symmetry axis, as shown in Figures 5a-5d) along both the positive and horizontal axes, it is sufficient to select a single axis along which to conduct the experiment. The selected and listed experiment calculations, and analyzed data are still the experiment results of representative positive axis and general oblique axis of the stone lion base (as shown in Tables 3 and 4, and Figures 8 and 9). Therefore, the characteristics of one-way and co-opposite-direction algorithms can be analyzed and compared based on these results.
4.2.1 Positive Axis Experiment of a Stone Lion Base
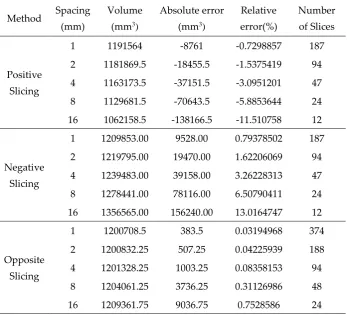
According to the positive axis SM shown in Figures 5a and 5b, spacings of 1 mm, 2 mm, 4 mm, 8 mm, and 16 mm have been adopted to calculate the one-way and co-opposite-direction forward and reverse PCO volumes and their relative errors along the positive axis of the stone lion base (as shown in Table 3), and the trend is shown in Figure 8.
Table 3. Comprehensive experimental results for normal axis of stone lion base.
Method Spacing (mm)
Volume (mm3)
Absolute error (mm3)
Relative error(%)
Number of Slices
Positive
Slicing
1 1191564 -8761 -0.7298857 187
2 1181869.5 -18455.5 -1.5375419 94
4 1163173.5 -37151.5 -3.0951201 47
8 1129681.5 -70643.5 -5.8853644 24
16 1062158.5 -138166.5 -11.510758 12
Negative
Slicing
1 1209853.00 9528.00 0.79378502 187
2 1219795.00 19470.00 1.62206069 94
4 1239483.00 39158.00 3.26228313 47
8 1278441.00 78116.00 6.50790411 24
16 1356565.00 156240.00 13.0164747 12
Opposite
Slicing
1 1200708.5 383.5 0.03194968 374
2 1200832.25 507.25 0.04225939 188
4 1201328.25 1003.25 0.08358153 94
8 1204061.25 3736.25 0.31126986 48
Figure 8. Relative error diagram of volume calculation for normal axis of stone lion base.
As can be seen from Table 3 and Figure 8, although the volume calculation errors of the positive axis of the stone lion base by forward or reverse SM are roughly proportional to the spacing, volatility and directionality have been observed to increase with the spacing. Hence, despite the fact that the forward and reverse compensatory effect of the CODSM with the characteristic of mean value can be shown in each spacing, it is obvious that the smaller the spacing, the better the effect.
4.2.2 Oblique Axis Experiment of a Stone Lion Base
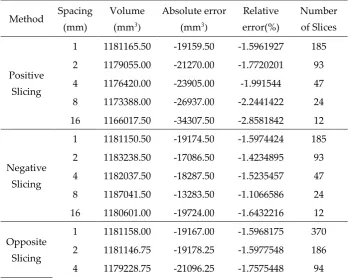
Spacings of 1 mm, 2 mm, 4 mm, 8 mm, and 16 mm have been adopted for calculation of the one-way and co-opposite-direction forward and reverse PCO volumes and their relative errors along the oblique axis of a stone lion base (as shown in Table 4) based on the oblique axis SM shown in Figures 5a and 5b; the trend is shown in Figure 9.
Table 4. Comprehensive experimental results for oblique axis of stone lion base.
Method Spacing (mm)
Volume
(mm3)
Absolute error
(mm3)
Relative error(%) Number of Slices Positive Slicing
1 1181165.50 -19159.50 -1.5961927 185
2 1179055.00 -21270.00 -1.7720201 93
4 1176420.00 -23905.00 -1.991544 47
8 1173388.00 -26937.00 -2.2441422 24
16 1166017.50 -34307.50 -2.8581842 12
Negative Slicing
1 1181150.50 -19174.50 -1.5974424 185
2 1183238.50 -17086.50 -1.4234895 93
4 1182037.50 -18287.50 -1.5235457 47
8 1187041.50 -13283.50 -1.1066586 24
16 1180601.00 -19724.00 -1.6432216 12
Opposite Slicing
1 1181158.00 -19167.00 -1.5968175 370
2 1181146.75 -19178.25 -1.5977548 186
4 1179228.75 -21096.25 -1.7575448 94
0.03% 0.14% 0.18% 0.00% 0.00% -0.01% 0.00% -0.37% 0.01% 0.07% -0.10% -0.40% -0.30% -0.20% -0.10% 0.00% 0.10% 0.20% 0.30%
0
2
4
6
8
10
12
14
16
18
R el ati v e er ro r (%) Spacing(mm)
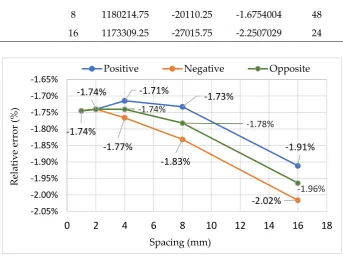
8 1180214.75 -20110.25 -1.6754004 48
16 1173309.25 -27015.75 -2.2507029 24
Figure 9. Relative error diagram of volume calculation for oblique axis of stone lion base.
As can be seen from Table 4 and Figure 9, although the volume calculation errors by forward or reverse SM along the oblique axis of the stone lion base are roughly proportional to the slicing spacing, a high volatility and systematicness (low overall) have been observed; these show a marked one-way increasing trend as the spacing increase, which is similar to the U-turn “distortion” of a higher-order polynomial interpolation curve [21]. As a result, the forward and reverse compensatory effects of CODSM are ameliorated to a certain extent and become obvious only when the spacing is small; however, the positive effect of maintaining the calculation results centered and balanced is retained.
From the experiment (as shown in Tables 1-4 and Figures 6-9) and the following analysis, there are great differences in error and compensation between one-way SM and CODSM (as shown in Table 5).
Table 5. Comparison of error and compensation between SM and CODSM.
Object Method
Effect of Random Errors Compensation of Random Errors Effect of Systematic Directional Errors Compensation of Random Errors Cone Model
SM Strong Weak or No Strong Weak or No
CODSM Weak Strong Weak Strong
Stone
Lion Base
SM Strong Weak or No Strong Weak or No
CODSM Slightly
Weak Fairly Strong
Slightly
Weak Fairly Strong
-1.71% -1.73% -1.91% -1.74% -1.74% -1.77% -1.83% -2.02% -1.74% -1.78% -1.96% -2.05% -2.00% -1.95% -1.90% -1.85% -1.80% -1.75% -1.70% -1.65%
0
2
4
6
8
10
12
14
16
18
R el ati v e er ro r (% ) Spacing (mm)
From these results, after comprehensively examining and accounting for the fact that “the smaller the slicing spacing, the higher the precision” [14,15], it can be concluded that, overall, CODSM has consistent characteristics and advantages of higher precision, stronger reliability and better robustness than forward or reverse one-way SM.
5. Discussion
5.1 Analysis of Basic Characteristics
The slicing experiment and calculation of PCO volume of a cone and a stone lion base under two typical working conditions were carried out using SM and CODSM, and the results are shown in Tables 1-4 and Figures 6-9. In general, irrespective of the regularity of PCOs, CODSM used along the positive axis complemented and compensated the best for the errors resulting from shape contingency and directional systematicness, and its advantages are the most distinct. Although a certain degree of weakening and uncertainty in the compensation effect is observed under general working conditions such as oblique axis, the compensation is present in all conditions with the difference being in quantity rather than quality. Consequently, under any given working conditions, the calculation results of CODSM are better, more reliable, and thus more robust than those of the one-way SM.
5.2 Analysis of the Causes for Compensation
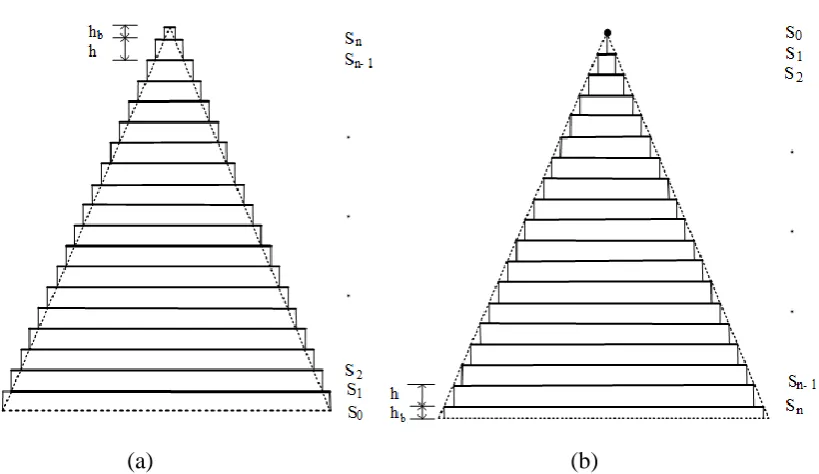
The root cause for the compensatory effect is that ℎ𝑏 (height of the PCO remnant, as shown in
Figures 3 and 4) is different for one-way forward and reverse slicing, which results in uncertainties and varying volumes of remnant segments depending on the spacing. Even if the one-way forward and reverse ℎ𝑏 happen to be the same, the calculation results obtained by one-way forward and
(a)
(b)
Figure 10. Schematic of one-way slicing method (taking the positive axis of cone as an example). (a) Slicing from the bottom up; (b) Slicing from the top down.
5.3 Summary and Prospects
The CODSM that is proposed and formed based on theoretical analysis and experimentation has been proven effective and has the following characteristics and advantages:
1. The cause and source of the CODSM is a single difference. The differences between forward and reverse SM are in four aspects, namely the slicing position, slices obtained, height of
PCO remnant, and PCO remnant itself. The single difference is bound to produce different results for single accumulation, which means, the forward and reverse calculations will lead
to systematic deviations.
2. The CODSM can effectively overcome the directionality, volatility, contingency, and
systematic nature of SM using co-opposite-direction (i.e., forward and reverse) slicing to deal with directionality. CODSM reduces directional effects, volatility, uncertainty and any
systemic effects while partially compensating for possible contingency defects.
3. With better precision compared to the one-way SM when the slicing spacing is small, the CODSM is a more robust and reliable method for PCVC.
4. The CODSM has certain applicable conditions. CODSM has distinct advantages when the spacing is small; however, when the forward and reverse axes are symmetrical (such as the
horizontal axis of a cone, the positive axis of a stone lion base, and horizontal axis of a stone lion base), there is little difference between the CODSM and SM; therefore, the latter can be
adopted.
5. The CODSM has an advantage range of error compensation; the smaller the spacing, the
better the compensatory effect.
6. The error compensation of the CODSM is asymmetric. The asymmetry, which is closely
related to the slice shape, varies with working conditions. The ideal working condition is the positive axis of a cone; under other working conditions, different degrees of volatility arise.
errors. For example, during the experiment along the positive axis of the stone lion base with spacings of 4 mm, 8 mm, and 16 mm, the relative errors of volume calculation demonstrated volatility (shown in Figure 9), and the relative error openings of forward and reverse slicing
display the magnifying feature of increasing with the slicing spacing (shown in Figures 6-9).
8.
The CODSM still needs further exploration and expansion. As seen from Figure 7 and Figure9, it seems to have no solution to the problem that the PCVC along the oblique axis is systematically smaller than the actual value. As shown in Figures 6 and 8, the slice shape is
regular and equal in each direction, which is the optimal and preferred working condition along the positive axis in this experiment. As a result, for specific regular or irregular PCOs,
an in-depth exploration of the systematic errors of CODSM could be one of the focuses in subsequent research.
6. Conclusion
The volatility, systematicness, and contingency of SM are positively correlated with the PCO slicing direction. By increasing parallel observation and considering the two-way mean as the PCO volume, the CODSM proposed in this paper can restrain or even eliminate any uncertain random errors caused by the irregular shape or segment volume of PCO slices, or by the irregular shape of PCOs while essentially weakening the forward, reverse, or unilateral systematic errors of SM. The CODSM is feasible and effective at balancing and reducing both contingency and systematic errors, which makes the calculation results more reasonable and the precision more robust. In conclusion, from the results of the algorithm model and experimental analysis, the CODSM is not only a development from SM, but also a sign indicating that SM can be a full-fledged and reliable method for calculating PCVC.
Funding
The National Key Research and Development Plan (Grant No. 2018YFC150480505) and Hebei Provincial Geological Environment Monitoring Institute (Grant No. 211526190129) are gratefully acknowledged.
Acknowledgments:
This study is completed on the basis of SM, an effective method for point cloud object volume calculation. We hereby express our gratitude to actual participants and contributors Li Bin, Wei Junbo, Ma Bochao, Wang Lu in the exploration process of slicing method. We also would like to thank Editage (www.editage.cn) for English language editing.
References