109
† Corresponding author
MARKET EFFICIENCY OF ASEAN STOCK MARKETS
Muneer Shaik1† --- S. Maheswaran2
1Research Scholar, Institute for Financial Management and Research, 25 , Kothari Road, Nungambakkam, Chennai, India 2
Senior Professor, Institute for Financial Management and Research, 24, Kothari Road, Nungambakkam, Chennai, India
ABSTRACT
In this paper, we examine the stock market efficiency of the members of the Association of South East Asian Nations
(ASEAN). We use the conventional individual variance ratio tests like the Lo and MacKinlay (1988) test, Choi (1999) test, Wright (2000) test and Chen and Deo (2006)) test to check for the efficient market hypothesis in these markets.
We also perform the spectral shape test of Durlauf (1991) and Average exponential test as in Andrews and Ploberger
(1996) to check for the serial correlations in these stock indices. This study rejects the efficient market hypothesis for the stock markets of Indonesia, Malaysia, Philippines, Thailand and Vietnam. However, we find that the stock markets
in Cambodia, Lao and Singapore are weak form efficient. This study is essential for the policy makers of ASEAN
member nations who attempt to introduce new financial regulations to make their markets more attractive to the
investors by making the stock markets efficient.
© 2017 AESS Publications. All Rights Reserved.
Keywords: Variance ratio tests, Random walk, Efficient market hypothesis, ASEAN, Spectral shape test, Average exponential test. JEL Classification: C15, C58, G15.
Received: 9 September 2016/ Revised: 6 October 2016/ Accepted: 31 October 2016/ Published: 5 November 2016
Contribution/ Originality
This study contributes to the existing literature of the stock market efficiency of the member nations of the ASEAN region by employing individual variance ratio tests, spectral shape test and Average exponential test. This study documents that stock indices of Cambodia, Lao and Singapore are weak form efficient.
1. INTRODUCTION
Market efficiency has been an important area of research in the financial literature. It is only when the functioning of the markets is efficient, then no individual investor will have an upper hand over the other based on available information. According to the Efficient Market Hypothesis [EMH], any new information will immediately reflect in the price of the asset (Fama, 1970). Hence it becomes impossible to predict the price of an asset based on the past information. That is to say, the stock markets follow random walk in an efficient market.
In this paper, we examine the efficient market hypothesis for the Association of South East Asian Nations (ASEAN), which is the biggest regional community in the largest continent of the world with total nominal gross
Asian Economic and Financial Review
ISSN(e): 2222-6737/ISSN(p): 2305-2147
domestic product (GDP) of more than USD 2.8 trillion in 2015. According to Hill and Menon (2010) studies on financial integration and market development have been conducted by looking ASEAN nations as a group of economies. After the Asian financial crisis, in order to monitor the functioning of the financial sector activities, some of the ASEAN countries have introduced domestic regulatory frameworks. There was a huge surge in the number of listed companies, market capitalization and liquidity in the ASEAN member nations since then. Of the 10 ASEAN member nations, 8 nations have their own stock exchanges that include Cambodia, Indonesia, Lao, Malaysia, Philippines, Singapore, Thailand and Vietnam. Myanmar has started its own Yangon stock exchange in March 2016. Brunei has also announced of starting its own exchange but is not yet in function.
In order to achieve the goal of greater economic integration among the ASEAN member nations and the better development of sustainable capital markets, it is necessary to have efficiency in these ASEAN stock markets. It is known that if markets are inefficient, it becomes difficult to raise the capital through the markets which will hinder the viable investment projects. This paper also contributes to the existing literature in the area of market efficiency of the emerging stock markets and ASEAN member nations in particular. ASEAN is also chosen to bridge the gap in academic literature where majority of the work in efficient markets is done in the developed nations. The next section presents a brief review of literature. We then discuss the methodologies used in the study in Section 3. We discuss our data in Section 4 and provide empirical results in Section 5. Finally we conclude by providing some policy implications in the last section.
2. LITERATURE REVIEW
In this section we discuss some of the important contributions in the area of market efficiency present in the financial literature that focuses on the member nations of ASEAN community in particular. Though there exists many studies on emerging Asian markets, the results on the efficiency of these markets is mixed due to different methodologies that were employed in the literature and the difference in the study periods.
Huang (1995) have studied the random walk hypothesis for 8 Asian countries and Japan using Lo & MacKinlay variance ratio test for the period 1984-1998. Kawakatsu and Morey (1999) have performed Unit root test and multiple variance ratio tests on 16 emerging markets for the period 1976-1997. Malliaropulos and Priestley (1999) used Lo and MacKinlay (1988) test and Bootstrap methodology on Southeast Asian markets for the period 1988-1995.
Worthington and Higgs (2004) have studied weak form market efficiency in Asian emerging and developed equity markets using serial correlation and unit root tests and concluded the emerging markets are not weak form efficient. A number of other studies on random walk hypothesis include the works of (Karemera and Ojah, 1999; Darrat and Zhong, 2000; Chang et al., 2004; Hoque et al., 2007).
Hamid et al. (2010) studied 14 Asian markets and concluded that monthly prices do not follow random walks.
3. METHODOLOGY
In this section, we discuss the various methods that are used in this paper to examine the random walk hypothesis like Unit root test, Variance ratio test, Spectral shape test and Average exponential tests.
3.1. Augmented Dickey Fuller Unit Root test
The ADF unit root test Dickey and Fuller (1979) is carried out by estimating the below equation for which the null and alternate hypothesis is , where and evaluated using the conventional t-ratio for
as ̂ ̂)) .
The presence of a unit root in a time series suggests support for the random walk hypothesis.
3.2. Variance Ratio Tests
The Variance ratio [VR] statistics and its advanced versions are widely used in the financial literature since the pioneer works of Lo and MacKinlay (1988;1989); Poterba and Summers (1988) and Cochrane (1988). The VR statistic in finance is used to test the market efficiency, i.e. to say whether the given time series of stock prices or its first difference (or returns) follow random walk.
Let denote the logarithm of the stock price at time t. Let be an asset return at time t, where t=1, 2, ….., T, and defined as, . The variance ratio (VR) can be expressed in terms of auto-correlation coefficients as explained in Lo and MacKinlay (1988) and defined as,
) )
) ∑ )
where is the i-th lag auto-correlation coefficient of If the asset returns are uncorrelated over time then we have V(k) = 1.
The variance ratio test statistic can further be constructed based on an estimator of ). Let ̂ denote the sample mean of the asset returns defined as ̂ ∑ Let ̂ be the sample variance of the asset return. The sample variance of the one-period return can be defined as ,
̂ )
∑ ̂)
∑ ̂)
The sample variance of the k-period return can be defined as,
̂ ) ∑ ̂)
∑ ̂)
where we define the parameter in such a way that ̂ ) is an unbiased estimator of k-period return. i.e.
) )
The variance ratio is defined as
) ̂ )
̂ )
Hence the VR will be equal to 1 for all values of k, when the asset returns follow the random walk. If the VR is less than 1, then we have indications of negative serial correlation (mean-reversion). If the VR is more than 1, then we have indications of the positive serial correlation (mean-aversion).
The VR statistic as explained in Wright (2000) can be defined as
) ,
∑ ̂)
-, ∑ ̂)
-Let us describe the individual VR tests developed by Lo and MacKinlay (1988) as well as some of its advancements.
3.2.1.Lo and MacKinlay (1988) Variance Ratio Test
Lo & MacKinlay proposed the asymptotic distribution of ) by assuming that k is fixed when They showed that if is i.i.d., i.e. under the assumption of homoscedasticity, then under the null hypothesis that
) , the test statistic ) is given by
)
)
√ )
which follows the standard normal distribution asymptotically. The asymptotic variance ), is given by
) ) )
Lo and MacKinlay (1988) proposed the heteroscedasticity robust test statistic ), to accommodate exhibiting the conditional heteroscedasticity as,
)
)
√ )
which follows the standard normal distribution asymptotically under null hypothesis that ) where
) ∑ [ )] )
) {∑ ̂) ̂) }
[∑ ̂) ]
3.2.2. Choi (1999) Test
The choice of holding period k when implementing the VR tests is important but is rather chosen arbitrarily. Hence to overcome this issue, Choi (1999) proposed a data dependent procedure to determine the optimal value of k. The VR estimator is defined as
) ∑ ⁄ ) ̂ )
Where ̂ ) is the auto-correlation function, and ) is the Quadratic Spectral kernel defined as
)
[
)⁄
⁄ )⁄ ]
) √
√ ⁄
Under the null hypothesis the test statistic follows the standard normal distribution asymptotically. Note that it is assumed that as the small sample properties of this automatic VR test under heteroscedasticity are unknown and not investigated properly.
3.2.3.Wright (2000) Test
Wright (2000) proposed a non-parametric alternative to conventional asymptotic VR tests using signs and ranks. The tests based on ranks are exact under the i.i.d. assumption, whereas the tests based on signs are exact under conditional hetereoscedasticity. Wright (2000) proposed and statistics defined as
) { ∑ )
∑
} √ )
) { ∑ )
∑ } √ )
Where the standardized ranks are given by
)
√ ) ) ⁄
) )
Where
) ) )
And is the inverse of the standard normal cumulative distribution function. The tests based on signs of the first difference is given by
) { ∑ )
∑
} √ )
) { ∑ ̅) ̅) ̅))
∑ ̅)
} √ )
) ̅) )
) (
)
Note that the critical values of can be obtained by simulating its exact sampling distributions.
3.2.4. Chen and Deo (2006) Test
statistic has been impeded by the fact that the asymptotic theory provides a poor approximation to the small-sample distribution of the VR statistic. In general, the ability of the asymptotic distribution to approximate the finite sample distribution depends crucially on the value of the horizon k. More specifically, rather than being normally distributed (when standardized by √ ) as the theory states, the statistics are severely biased and right skewed for large k (relative to T) (Lo and MacKinlay, 1989) which makes application of the statistic problematic. In other words, the finite-sample null distribution of the test statistic is quite asymmetric and non-normal.
Chen and Deo (2006) suggested a simple power transformation of the VR statistic that, when k is not too large, provides a better approximation to the normal distribution in finite samples and is able to solve the well-known right skewness problem. They showed that the transformed VR statistic leads to significant gains in power against mean reverting alternatives. Furthermore, the distribution of the transformed VR statistic is shown, both theoretically and through simulations, to be robust to conditional heteroscedasticity.
First, they defined the VR statistic based on the periodogram as
)
( )
̂ ∑ ) )
) ⁄
To obtain the transformed VR statistic, the following power transformation to ) is applied,
∑ ( ) ∑ )
) ⁄ ) ⁄
*∑ ) ⁄ )+
3.3. Spectral Shape Tests
The spectral shape tests as introduced in Durlauf (1991) are designed to test the serial correlation. These tests are completely data dependent and there is no parameter that researcher needs to select. The tests we use are
∫ )
[ )]
∫ )
∫ )
Where
) √
[ ) ) ]
∑
We have
) ) ∑ )
∑
And
)
∑ )
The and tests are studied in Durlauf (1991) and the test in Choi and Mark (1997).
3.4. Average Exponential Tests
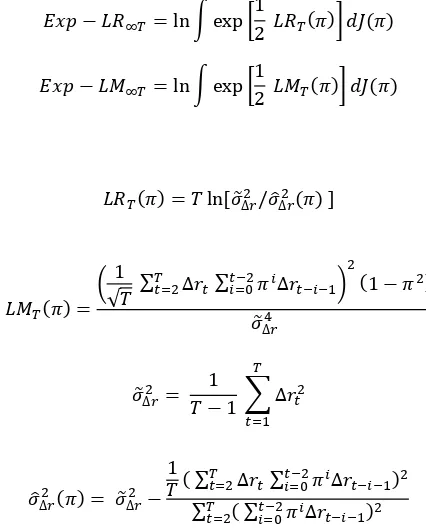
These tests essentially combine either the likelihood ratio (LR) tests or the Lagrange multiplier (LM) such that an optimality property is achieved. Though the Andrews and Ploberger (1996) tests are devised for the ARMA(1,1) alternative under a normality assumption, they are consistent against all weakly stationary and strong mixing alternatives. Among the tests introduced in Andrews and Ploberger (1996) we will employ the average exponential likelihood ratio and Lagrange multiplier. The average exponential LR and LM tests are
∫ [ )] )
∫ [ )] )
Where
) [ ̃ ̂ ) ]
)
(
√ ∑ ∑
) )
̃
̃
∑
̂ ) ̃ ∑ ∑
)
∑ ∑ )
And ) is the uniform measure on which is the parameter space on π.
4. DATA DESCRIPTION
In this section, we describe the data that we have used for our empirical analysis. We have collected the daily closing prices data of 8 ASEAN stock indices for the period mentioned in the brackets; namely Cambodia’s CSX Index (2012-2016), Indonesia’s JCI Index (1990-2016), Lao’s LSXC Index (2011-2016), Malaysia’s FBMKLCI Index (1994-2016) , Philippines’s PCOMP Index (1990-2016), Singapore’s STI Index (1999-2016), Thailand’s SET50 Index (1995-2016) and Vietnam’s VNIN Index (2000-2016). The daily data is collected from the source Bloomberg. In Table 1: we provide the descriptive statistics of the 8 ASEAN stock indices under consideration. We observe negative skewness in Cambodia, Indonesia, Singapore and Vietnam. The kurtosis was higher in Malaysia, Indonesia, Philippines and Thailand. We observe that all the stock indices are non-normal as per the results of Jarque-Bera test.
5. EMPIRICAL FINDINGS
Table-1. Descriptive Statistics
Cambodia Indonesia Lao Malaysia Philippines Singapore Thailand Vietnam
No of Obs 974 6487 1390 5579 6583 4262 5144 3820
Mean -0.001 0.000 0.000 0.000 0.000 0.000 0.000 0.000
Maximum 0.049 0.131 0.063 0.208 0.162 0.075 0.126 0.067
Minimum -0.051 -0.127 -0.063 -0.242 -0.131 -0.087 -0.172 -0.077
Std Dev 0.015 0.015 0.013 0.013 0.015 0.012 0.018 0.016
Skewness -0.313 -0.071 0.210 0.461 0.157 -0.254 0.209 -0.257 Kurtosis 2.645 9.242 3.825 53.227 8.788 5.017 7.252 2.660 Jarque Bera 302.261 23112.330 861.854 659272.700 21228.290 4521.778 11323.350 1170.563 p-value 0.000*** 0.000*** 0.000*** 0.000*** 0.000*** 0.000*** 0.000*** 0.000***
*** represents 1% level of significance. Stock returns are calculated using the formula [ ) ))]
Source: Developed by the authors
Table-2. Augmented Dickey Fuller Unit Root test
Model Cambodia Indonesia Lao Malaysia Philippines Singapore Thailand Vietnam None -19.69* -51.83* -24.93* -50.05* -53.70* -45.08* -47.03* -38.19* Drift -19.85* -51.87* -24.92* -50.04* -53.72* -45.07* -47.03* -38.22* Trend -19.91* -51.88* -24.94* -50.06* -53.73* -45.07* -47.07* -38.24*
Critical values for the model-"None" are -2.58 (1%) and -1.95 (5%). Critical values for the model-"Drift" are -3.43(1%) and -2.86(5%). Critical Values for the model-"Trend" are -3.96 (1%) and -3.41 (5%). * represents significance at 1% level of significance. Augmented Dickey Fuller (ADF) test is performed on the stock returns.
Source: Developed by the authors.
In Table 3, we present the details of Lo & Mackinlay variance ratio test results for k-day =2, 4, 6, 8 and 10. We test the null hypothesis that variance ratio is equal to 1.If we consider the M1 statistic which is based on the homoscedastic assumption, random walk hypothesis is rejected for Indonesia, Malaysia, Philippines, Thailand and Vietnam for all the k-day windows as we find the test statistic to be significant.Also for Cambodia , M1 statistic is significant for day =4 and 6 ; for Lao, it is significant for day=6,8 & 10 and for Singapore, it is significant for k-day =6 ,8. That is to say, we get mixed results for diffferent k-k-days for Cambodia, Lao and Singapore when we consider the homoscedastic assumption. We also present the results of M2 statistic, which is based on the heterosedastic assumption. The M2 statistic is found to be significant in Indonesia, Philippines, Thailand and Vietnam and hence we reject the random walk hypothesis. Overall, we can conclude that the random walk hypothesis is rejected in all ASEAN nations except for Cambodia, Lao and Singapore. In case of Malaysia we have mixed results as M1 rejects the random walk hypothesis where as M2 statistic doesnot based on Lo & Mackinaly variance ratio test.
In Table 4, we show the results of the individual variance ratio tests namely (Choi, 1999) Automatic Variance ratio test and Chen and Deo (2006) power transformed joint variance ratio test. We observe that the random walk hypothesis is rejected in all ASEAN stock markets based on Automatic variance ratio test as the test statistics are significant at 1% level of significance, except for Cambodia, Lao and Singapore. In case of the Chen and Deo (2006)
Table-3. Lo & MacKinlay Variance Ratio No of holding period days i.e. k-days
k=2 k=4 k=6 k=8 k=10
Cambodia VR(k) M1 M2 1.009 0.285 0.183 1.121 2.024** 1.290 1.161 2.036** 1.306 1.170 1.791 1.160 1.114 1.056 0.693 Indonesia VR(k) M1 M2 1.165 13.253** 7.444** 1.267 11.499** 6.486** 1.279 9.087** 5.186** 1.267 7.280** 4.215** 1.266 6.354** 3.726** Lao VR(q) M1 M2 1.025 0.925 0.472 1.094 1.879 0.987 1.144 2.171** 1.171 1.177 2.231** 1.225 1.184 2.036** 1.133 Malaysia VR(k) M1 M2 1.173 5.423** 1.021 1.251 5.383** 1.100 1.278 3.677** 0.801 1.281 2.608** 0.597 1.303 2.043** 0.490 Philippines VR(k) M1 M2 1.173 14.024** 9.312** 1.251 10.883** 7.163** 1.278 9.131** 6.058** 1.281 7.697** 5.186** 1.303 7.283** 4.979** Singapore VR(k) M1 M2 1.028 1.811 1.149 1.052 1.811 1.099 1.085 2.257** 1.354 1.091 2.009** 1.206 1.097 1.882 1.135 Thailand VR(k) M1 M2 1.084 6.038** 3.071** 1.159 6.116** 3.267** 1.171 4.973** 2.770** 1.159 3.850** 2.220** 1.162 3.459** 2.048** Vietnam VR(k) M1 M2 1.294 18.180** 9.428** 1.499 16.481** 8.750** 1.666 16.656** 8.987** 1.830 17.343** 9.454** 1.955 17.488** 9.622**
** represents 5% level of significance. VR (k) is the Lo & Mackinlay variance ratio statistic. M1 is the test statistic for homoscedasticity assumption whereas M2 is the test statistic for heteroscedasticity assumption.
Table-4. The results of Choi (1999) test and Chen and Deo (2006) variance ratio test:
Choi (1999) Test Chen and Deo (2006)
Automatic Variance Ratio Test Power Transformed Joint Variance Ratio test
stat sum Vrsum Qpn
Cambodia 0.140 1.008 0.135 4.584
Indonesia 7.603** 1.318 0.228 52.531**
Lao 0.641 1.032 0.170 6.017
Malaysia 4.351** 1.157 0.105 1.864
Philippines 7.440** 1.314 0.231 84.358**
Singapore 1.295 1.042 0.067 3.821
Thailand 5.224** 1.202 0.137 14.188* Vietnam 15.620** 1.970 0.501 86.871**
**, * represents 1%, 5% level of significance respectively. 'stat' represents the Automatic variance ratio test statistic. 's um' is the 1+ weighted sum of autocorrelation up to the optimal order. 'Vrsum' is the sum of power transformed individual VR-1.
In Table 5, we present the results of Spectral shape tests as proposed in Durlauf (1991). We observe that the random walk hypothesis is rejected in all ASEAN nations except for Cambodia, Lao and Singapore. We find that Mellows M statistic is significant for Indonesia (3.663) and Philippines (3.980) at 1% level of significance whereas for Malaysia and Thailand, M statistic is significant at 5% level of significance. We also show the results of Average exponential test as proposed in Andrews and Ploberger (1996). It clearly shows that there exists weak form efficiency only in Cambodia, Lao and Singapore as the test statistic in other ASEAN nations are significant.
Table-5. The results of Spectral shape test and Average Exponential test
Durlauf (1991) Andrews and Ploberger (1996)
Spectral Shape Test Average Exponential Test
AD CVM M Ex.LM Ex.LR
Cambodia 2.519 0.348 0.507 1.622 1.390
Indonesia 82.221** 17.325** 3.663** 88.801** 87.574**
Lao 3.393 0.342 0.388 4.708 3.455
Malaysia 18.258** 3.422** 1.618* 14.465** 15.822** Philippines 96.592** 20.472** 3.980** 96.485** 100.243**
Singapore 2.064 0.377 0.549 1.653 1.605
Thailand 19.345** 4.018** 1.750* 19.081** 18.279** Vietnam 176.257** 34.245** 5.326** 178.645** 174.391**
**, * represents 1%, 5 % level of significance respectively. AD is the Anderson-Darling statistic. CVM is the Cramer-von Mises statistic. M is the Mellows statistic. LM is the Lagrange Multiplier test. LR is the likelihood ratio test.
Source: Developed by authors
In Table 6, we show the results of Wright (2000) Rank and Sign test. Based on the results of rank tests R1 and R2, we can observe that the random walk hypothesis is rejected in Indonesia, Malaysia, Philippines, Thailand and Vietnam. We can find that there exists weak form efficiency in Cambodia, Lao and Singapore. However when we look at the results of sign test S1, we reject the random walk hypothesis in all ASEAN nations including Cambodia and Lao except at Singapore. So overall, we find Singapore as the weak form efficient market based on Wright (2000) Rank and Sign test.
6. CONCLUSION
This paper examines the market efficiency in the ASEAN-8 nations that include Cambodia, Indonesia, Lao, Malaysia, Philippines, Singapore, Thailand and Vietnam. The ADF unit root test rejects the random walk hypothesis in all the ASEAN markets under study. We have used the individual variance ratio tests which are considered to be more powerful than the unit root tests. We observe that Lo and MacKinlay (1988) variance ratio test and Choi (1999)
Automatic variance ratio test give similar results in which out of the 8 ASEAN nations only 3 nations (i.e. Cambodia, Lao and Singapore) stock markets are found to be weak form efficient. Durlauf (1991) spectral shape test, Andrews and Ploberger (1996) Average exponential test also confirms that the 3 ASEAN nations are weak form efficient like the results of Choi (1999) test. In Wright (2000) rank and sign based test, we have found that all the ASEAN nations are inefficient, except Singapore.
Table-6. The results of Wright (2000) Rank and Sign test:
Cambodia Indonesia Lao Malaysia
R1 R2 S1 R1 R2 S1 R1 R2 S1 R1 R2 S1 k=2
k=4 k=6 k=8 k=10
-1.652 -1.007 5.447** -0.441 0.520 9.402** -0.383 0.582 11.795** -0.292 0.587 13.924** -0.380 0.248 15.506**
13.346** 13.859** 9.622** 12.496** 12.583** 9.762** 11.247** 10.820** 9.299** 10.141** 9.373** 8.887** 9.587 ** 8.644** 8.851**
-3.281** -1.848 1.233 -1.965 -0.735 3.856** -1.364 -0.268 5.670** -0.726 0.183 6.950** -0.294 0.413 7.861**
11.248** 11.836** 7.055** 10.702** 11.181** 7.227** 9.583** 9.849** 7.038** 8.266** 8.347** 6.325** 7.708** 7.703** 6.080**
Philippines Singapore Thailand Vietnam
R1 R2 S1 R1 R2 S1 R1 R2 S1 R1 R2 S1 k=2
k=4 k=6 k=8 k=10
14.237** 14.925** 10.735** 12.031** 12.377** 9.256** 10.289** 10.635** 7.696** 8.449** 8.882** 6.210** 7.530** 8.129** 5.544**
0.356 1.235 -0.980 0.846 1.356 -0.131 1.938 2.114 1.239 1.887 1.920 1.416 1.968 1.879 1.602
5.133** 5.735** 2.816** 5.898** 6.366** 2.914** 5.236** 5.505** 2.530** 4.637** 4.646** 2.403** 4.552** 4.414** 2.464**
16.601** 17.589** 11.487** 16.985** 16.993** 11.882** 17.966** 17.581** 12.980** 19.022** 18.443** 14.046** 19.719** 18.870** 14.830**
Funding: This study received no specific financial support.
Competing Interests: The authors declare that they have no competing interests.
Contributors/Acknowledgement: All authors contributed equally to the conception and design of the study.
REFERENCES
Amer, S., 2014. Efficiency of South Asian capital markets: An empirical analysis. European Journal of Business and Management,
6(11): 30-33.
Andrews, D.W.K. and W. Ploberger, 1996. Testing for correlation against an arma (1,1) process. Journal of the American
Statistical Association, 91(435): 1331-1342.
Chang, E.J., E.J. Arauio-Lima and B.M. Tabak, 2004. Testing for predictability in emerging equity markets. Emerging Market
Review, 5(3): 295-316.
Charles, A. and O. Darnè, 2009. The random walk hypothesis for Chinese stock markets: Evidence from variance ratio tests.
Economic Systems, 33(2): 117-126.
Chen, W.W. and R.S. Deo, 2006. The variance ratio statistic at large horizons. Econometric Theory, 22(2): 206-234.
Choi, I., 1999. Testing the random walk hypothesis for real exchange rates. Journal of Applied Econometrics, 14: 293-308.
Choi, I. and N. Mark, 1997. Frequency domain tests for residual serial correlation in cointegration regressions. Oxford Bulletin of
Economics and Statistics, 59(4): 549-562.
Cochrane, J.H., 1988. How big is the random walk in GNP? Journal of Political Economy, 96(5): 893-920.
Darrat, A.F. and M. Zhong, 2000. On testing the random walk hypothesis: A model comparison approach. Financial Review,
35(3): 105-124.
Dickey, D. and W.A. Fuller, 1979. Distribution of the estimates for autoregressive time series with a unit root. Journal of the
American Statistical Association, 74(366): 427-431.
Durlauf, S., 1991. Spectral based testing of the martingale hypothesis. Journal of Econometrics, 50(3): 355-376.
Fama, E.F., 1970. Efficient capital markets: A review of theory and empirical work. Journal of Finance, 25(2): 383–417.
Hamid, K., M.T. Suleman, S.S.Z. Ali and R.S. Akash, 2010. Testing the weak form of efficient market hypothesis: Empirical
evidence from Asia-pacific markets. International Research Journal of Finance and Economics: 121-133.
Hill, H. and J. Menon, 2010. ASEAN economic integration: Features, fulfillments, failures and future. ADB Working Paper Series
on Regional Economic Integration, 69: 1-44.
Hoque, H., H.K. Jae and C.S. Pyun, 2007. A comparison of variance ratio tests of random walk: A case of Asian emerging stock
markets. International Review of Economics and Finance, 16(4): 488-502.
Huang, B.N., 1995. Do Asian stock market prices follow random walks? Evidence from variance ratio test. Applied Financial
Economics, 5(4): 251–256.
Karemera, D. and K. Ojah, 1999. Random walks and market efficiency tests: Evidence from emerging equity markets. Review of
Quantitative Finance and Accounting 13(2): 171-188.
Kawakatsu, H. and M.R. Morey, 1999. An empirical examination of financial liberalization and efficiency of emerging market
stock prices. Journal of Financial Research, 22(4): 358–411.
Kim, H.J. and A. Shamsuddin, 2008. Are Asian stock markets efficient? Evidence from new multiple varaince ratio tests. Journa l
of Empirical Finance, 15(3): 518-532.
Lo, A.W. and C.A. MacKinlay, 1988. Stock market prices do not follow random walk: Evidence from a simple specification test.
Review of Financial Studies, 1(1): 41-66.
Lo, A.W. and C.A. MacKinlay, 1988;1989. Stock market prices do not follow random walk: Evidence from a simple specification
Lo, A.W. and C.A. MacKinlay, 1989. The size and power of the variance ratio test in finite samples: A Monte Carlo investigation.
Journal of Econometrics, 20(2): 203-238.
Malliaropulos, D. and R. Priestley, 1999. Mean reversion in Southeast Asian stock markets. Journal of Empirical Finance, 6(4):
355–384.
Mishra, P.K., 2012. Efficiency of South Asian capital markets. Pakistan Journal of Commerce and Social Sciences, 6(1): 27-34.
Nisar, S. and H. Muhammed, 2012. Testing weak form of efficient market hypothesis: Empirical evidence from South-Asia. World
Applied Sciences Journal, 17(4): 414-427.
Paulo, V., 2013. The efficiency of Asian stock markets: A weak-form efficiency analysis. IJER, 10(1): 117-136.
Poterba, J.M. and L.H. Summers, 1988. Mean reversion in stock prices: Evidence and implications. Journal of Financial
Economics, 22(1): 27-59.
Worthington, A. and H. Higgs, 2004. Random walks and market efficiency in European equity markets. Global Journal of Finance
and Economics, 1(1): 59-78.
Wright, J.H., 2000. Alternative variance-ratio tests using ranks and signs. Journal of Business & Economics Statistics, 1(1): 1-9.