Scholarship@Western
Scholarship@Western
Electronic Thesis and Dissertation Repository
8-4-2016 12:00 AM
Towards the use of transcranial direct current stimulation to
Towards the use of transcranial direct current stimulation to
improve motor function
improve motor function
Kathleen M. LyonsThe University of Western Ontario
Supervisor Dr. Adrian Owen
The University of Western Ontario Graduate Program in Psychology
A thesis submitted in partial fulfillment of the requirements for the degree in Master of Science © Kathleen M. Lyons 2016
Follow this and additional works at: https://ir.lib.uwo.ca/etd
Recommended Citation Recommended Citation
Lyons, Kathleen M., "Towards the use of transcranial direct current stimulation to improve motor function" (2016). Electronic Thesis and Dissertation Repository. 3906.
https://ir.lib.uwo.ca/etd/3906
This Dissertation/Thesis is brought to you for free and open access by Scholarship@Western. It has been accepted for inclusion in Electronic Thesis and Dissertation Repository by an authorized administrator of
This study investigated the effect of anodal tDCS on motor control and corticomotor excitability in healthy controls, with the long-term goal of investigating the use of anodal tDCS to improve motor function in covertly aware vegetative state patients. Experiment I investigated the effects of anodal tDCS on a motor reaction time task, and found no effect of tDCS on performance, whether or not participants trained on the task or were at rest during the stimulation. Experiment II looked at the effects of anodal tDCS paired with passive movements on corticomotor excitability, and found no significant difference in corticomotor excitability, as measured by motor evoked potentials (MEPs), between the placebo and anodal conditions. Future investigation is needed to understand if and when anodal tDCS can be used to improve motor function in this patient group.
ii
Acknowledgments
I would first like to thank my supervisor, Dr. Adrian Owen, for his guidance, support, and encouragement throughout my degree. I am grateful for the many opportunities Dr. Owen has given me throughout my time at Western, and for all the advice and direction he provided to me on my research projects. I am especially thankful for all the time and effort
my co-supervisor, Dr. Davinia Fernández Espejo put into this project and my academic
development. Without Dr. Fernández Espejo, this project would not have been possible. She
is a brilliant researcher who went above and beyond as a supervisor. She was always patient and understanding with me, but also pushed me to become a better scientist. I also would like to thank Dr. Li-Ann Leow, who trained me on tDCS and who gave important input on the design of this project. I am appreciative of all the help and training Dr. Lucilla Cardinali and Dr. TC Chiang provided me while I was learning TMS. In addition, I am tremendously grateful to Michelle Nguyen and Clara Strafford for helping me with data collection; if it had not been for their help, I likely would have not finished this project on time. I would like to thank Dr. Damien Cruse for helping to write the MATLAB script to run my experiment.
I am also very thankful for everyone in the Owen lab, who gave me input on my project, advice on how to be successful in graduate school, and emotional support when I needed it. I am especially thankful to Jeremy Viczko, who was always there when I needed help. Additionally, I am particularly grateful to Rae Gibson, who has been there throughout these two years to help me with data analysis and interpretation, silly MATLAB errors, and scholarship applications. I am appreciative of Tram Nguyen’s help with my writing. I am also so grateful to Dr. Bobby Stojanoski, who I have learned so much from in the past year. Additionally, I am grateful to Dawn Pavich and Haitao Yang, who made sure I had
everything I needed to complete my thesis, and who were always patient with me, even when I kept bothering them with all my questions.
iii
Table of Contents
Abstract ... i
Acknowledgments ... ii
Table of Contents ... iii
List of Tables ... v
List of Figures ... vi
Appendix ... viii
Chapter 1 ... 1
1 Introduction ... 1
1.1 Disorders of consciousness ... 1
1.2 Covertly aware patients ... 3
1.3 Brain stimulation ... 5
1.3.1 Mechanisms of action of tDCS ... 7
1.3.2 tDCS and motor function ... 9
1.4 Study Objectives. ... 15
Chapter 2 ... 17
2 Experiment I – Investigating the use of transcranial direct current stimulation to improve motor performance with and without training ... 17
2.1 Materials and Methods ... 18
2.1.1 Participant Demographics. ... 18
2.1.2 Experimental Design ... 18
2.1.3 Transcranial direct current stimulation ... 20
2.1.4 Experimental Task ... 20
2.1.5 Data Analysis ... 21
2.2 Results ... 21
iv
2.2.2 Performance on motor control task during tDCS ... 25
2.2.3 Perception of tDCS ... 25
2.3 Discussion ... 26
Chapter 3 ... 31
3 Experiment II – Investigating the use of transcranial direct current stimulation to improve corticomotor excitability during passive training ... 31
3.1 Materials and Methods ... 33
3.1.1 Participant Demographics ... 33
3.1.2 Experimental Design ... 34
3.1.3 Transcranial direct current stimulation ... 35
3.1.4 Experimental Task ... 35
3.1.5 Data Analysis ... 35
3.1.6 Follow up experiment ... 36
3.2 Results ... 36
3.2.1 MEP amplitude change ... 36
3.2.2 Perceptions of tDCS ... 38
3.2.3 MEP amplitude in rest group ... 39
3.3 Discussion ... 40
Chapter 4 ... 45
4 General Discussion ... 45
References ... 48
Appendix ... 61
Questionnaires ... 61
v
List of Tables
Table 1 Performance values for training group. Means and standard deviations for
baseline and post-test performance on the random sequence reaction time task for training
group. ... 21
Table 2Performance values for rest group. Means and standard deviations for baseline
and post-test performance on the random sequence reaction time task for rest group. ... 22
Table 3 Perception of tDCS sensations. Mean ratings on a scale from 1 to 10 for anodal and
sham tDCS group from the tDCS perception questionnaire. No significant differences were
found in responses between anodal and sham conditions. ... 26
Table 4Group averaged MEP amplitude for the passive condition. MEP amplitude
means, post/pre ratio, and standard deviations for anodal tDCS and sham tDCS group. ... 37
Table 5Perception of tDCS for sham and anodal groups. Mean ratings from 1 to 10 for
anodal and sham tDCS group from tDCS perception questionnaire. No significant differences
were found in responses between the two groups. ... 38
Table 6Group averaged MEP amplitude for the rest condition. MEP amplitude means,
post/pre ratio, and standard deviations for anodal tDCS and sham tDCS group for the rest
vi
List of Figures
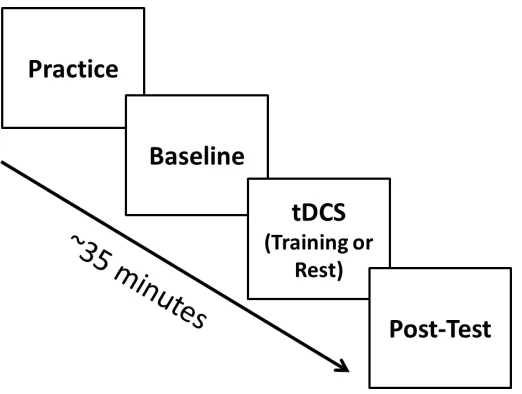
Figure 1 Schematic of procedure. All participants practiced on the task and performed the
task before receiving tDCS to get a baseline measure of performance. Then participants received either anodal or sham tDCS, and either trained on the task or were at rest during stimulation. Then all participants performed the task after tDCS to get a post-tDCS measure
of performance. ... 19
Figure 2 Accuracy in training group. Difference in average accuracy from baseline to
post-test for each participant in the training group. ... 22
Figure 3 Reaction times in training group. Difference in average reaction time from
baseline to post-test for each participant in the training group. ... 23
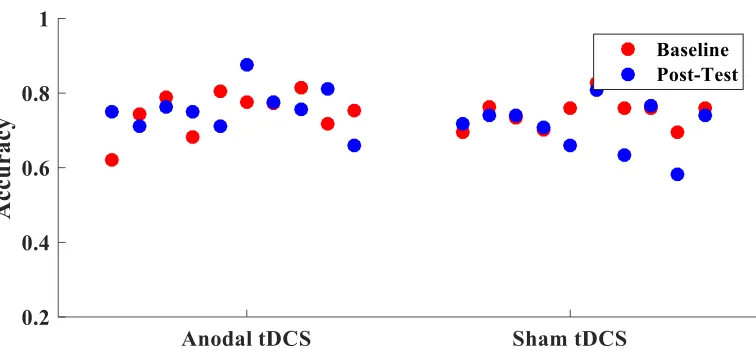
Figure 4 Accuracy in rest group. Change in average accuracy from baseline to post-test for
participants in the rest group. ... 24
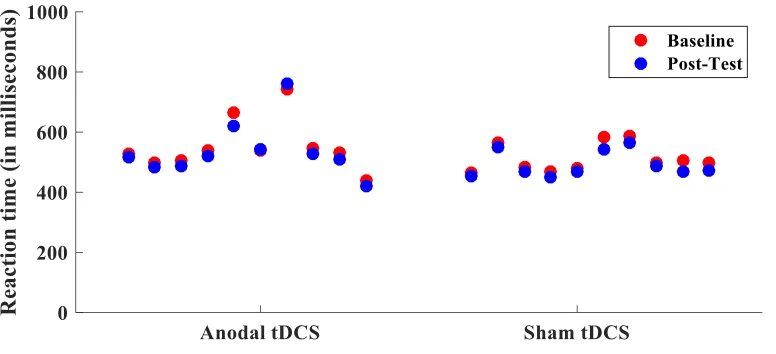
Figure 5 Reaction times in rest group. Difference in average reaction time from baseline to
post-test for each participant in the rest group. ... 25
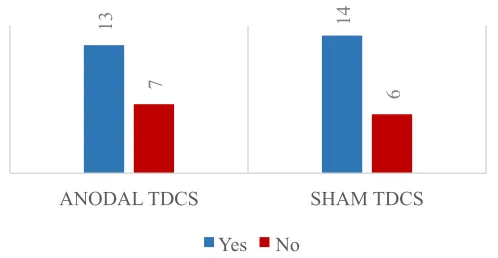
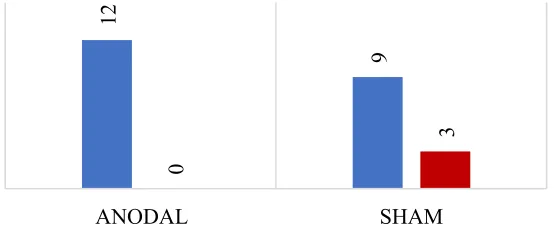
Figure 6 Belief as to whether participants received real tDCS. Number of participants
who responded yes versus no as to whether or not they believed they received real tDCS for
anodal and sham condition. No significant difference was found in responses between the
two groups. ... 26
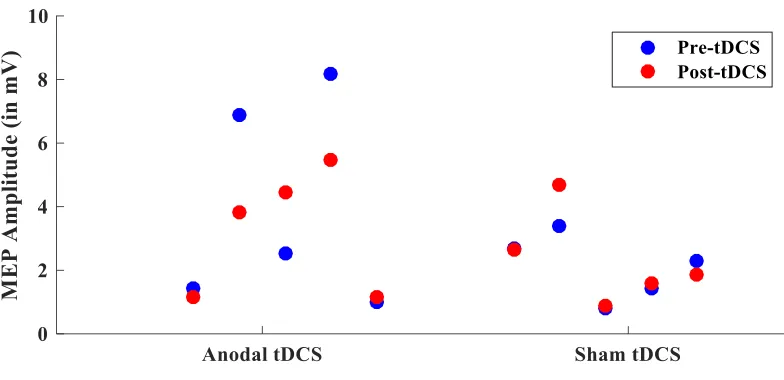
Figure 7 MEP amplitude for each passive group participant. MEP amplitude for pre and
post tDCS for each participant. ... 37
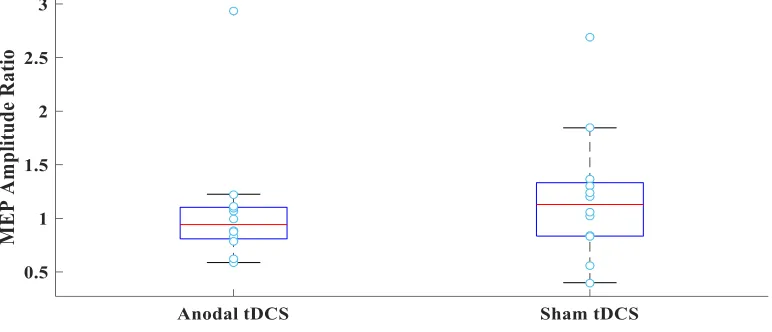
Figure 8MEP ratio boxplot for the passive group. MEP amplitude ratio displayed for
each participant in the anodal and sham tDCS groups. No significant difference was found in
MEP ratios between the anodal and sham tDCS group. ... 37
Figure 9Belief as to whether participants received real tDCS. Number of participants
vii
anodal and sham condition. No significant difference was found in responses between the
two groups. ... 38
Figure 10 MEP amplitude for each rest group participant. MEP amplitude from baseline
to post-tDCS for each participant. ... 39
Figure 11 MEP ratio boxplot for the rest group.MEP amplitude ratio is displayed for each
participant in the anodal and sham groups. No significant difference was found between the
sham and anodal group in MEP ratios. ... 40
viii
Appendix
Chapter 1
1 Introduction
1.1 Disorders of consciousness
Consciousness is a complex psychological concept that primarily relies on two major
components: arousal and awareness. Arousal (or wakefulness) is defined as the level of
consciousness. Sleeping is a low state of arousal, whereas being awake is a high state of
arousal. Arousal is supported by the brainstem, specifically the reticular activating
system, which projects to the thalamus and then to cortical regions (Laureys, Boly,
Moonen, & Maquet, 2009). Damage to the brainstem or extensive damage to the cortex
can lead to lower levels of arousal. Awareness is defined as the content of consciousness.
An individual shows signs of awareness if they are capable of processing and responding
to their environment. The neural mechanisms supporting awareness are not well
understood, but it is hypothesized that they depend on the integrity of the cortex and its
subcortical connections (Laureys et al., 2009). Several theories suggest that awareness is
supported by fronto-parietal networks (Cavinato et al., 2015; Fernández-Espejo et al.,
2012; Laureys et al., 2009) and thalamocortical networks (Fernández-Espejo et al., 2012;
Laureys et al., 2000; White & Alkire, 2003). Patients who are not awake and do not show
any signs of awareness are defined as being unconscious (Posner, Saper, Schiff, & Plum,
2007).
More often than not arousal and awareness are not dissociable because awareness
is usually not present without a reasonable degree of arousal (Posner et al., 2007).
However, in rare cases it is possible for these two components to dissociate. For example,
the vegetative state (VS) and minimally conscious state (MCS), which are both disorders
of consciousness (DoC), lead to a dissociation of awareness and arousal. VS and MCS
patients have intact wakefulness (arousal), but show a disruption in their awareness.
Specifically, VS patients show no behavioural signs of awareness of themselves or the
environment, whereas MCS patients show fluctuating but minimal levels of awareness
The most common cause of VS and MCS is a severe brain injury that leads to a
comatose, or unconscious state. Patients in a coma do not show signs of awareness, nor
do they have sleep-wake cycles (Laureys et al., 2009). After a short period of time
(between hours and a few weeks), patients in a coma will either recover or permanently
lose all brain function (brain death). However, a small number of patients progress into a
VS or MCS, in which they regain wakefulness, but still show minimal to no awareness
(Laureys, Owen, & Schiff, 2004). The brain injury etiology that typically leads to these
disorders involves extensive damage to the thalamus or bilateral hemispheric damage,
with little to no damage in the brainstem (Posner et al., 2007).
The progression and prognosis of these two disorders can vary from patient to
patient. For example, VS and MCS can be a transitional state indicating recovery from a
coma or a worsening of a neurological disease, but it can also be a permanent state for
some patients. Depending on the source of injury, a patient is considered to be in a
permanent vegetative state if they have been in that state for 3 months after a
non-traumatic brain injury or 1 year after non-traumatic brain injury. These permanent VS patients
rarely recover after that period of time (Posner et al., 2007). Patients who are
permanently in this state are severely disabled, and need constant care (Wilson, Harpur,
Watson, & Morrow, 2002).
The diagnosis of VS and MCS is complex, as determining whether a patient is
lacking awareness is significantly more difficult than diagnosing lack of wakefulness.
The clinical diagnosis of VS and MCS relies on the observation of the patients’ voluntary
behaviours by the examiner (Laureys et al., 2004; Monti, Laureys, & Owen, 2010). The
assessment tool most commonly used to diagnose VS and MCS patients is the Coma
Recovery Scale-Revised (CRS-R) (Giacino, Kalmar, & Whyte, 2004). These patients
often display substantial involuntary movement, thus, it is difficult to differentiate
between voluntary and involuntary movements (Laureys et al., 2009). Moreover, patients
may have a comorbid disability (e.g. blindness, motor deficits), which may make it more
difficult to respond to the commands of the examiner. Even when these patients are able
to engage in purposeful behaviour, they often fatigue quickly or the behaviours that they
of this condition, examiners often lack experience with these diagnoses, and may be
confused about terminology (Monti, Laureys, & Owen, 2010). For these reasons, relying
on behavioural measures to diagnose these patients has led to a high rate of misdiagnoses.
Wilson and colleagues (2002) found that when they re-assessed patients using
behavioural measures, 33% of VS and MCS patients were discovered to have been
misdiagnosed by their health care practitioner upon entry to studies. These patients
showed signs of awareness upon entry to the study that their health care practitioners had
missed. Other studies have found similar rates of misdiagnosis (Andrews, Murphy,
Munday, & Littlewood, 1996; Childs, Mercer, & Childs, 1993; Schnakers et al., 2009),
and it is estimated that up to one in three patients diagnosed as VS should be diagnosed
as MCS (Laureys et al., 2009). Therefore, relying on behavioral measures to diagnose
these patients has led to a high rate of misdiagnoses (Laureys et al., 2004).
1.2 Covertly aware patients
Even when the behavioural assessment is conducted properly, behavioural assessments
cannot discriminate between a correct diagnosis of VS and a patient who is aware but
lacks the motor capabilities to respond to the examiner. These two very different patient
groups would appear indistinguishable on the basis of a behavioural assessment. By using
neuroimaging, it was discovered that there is a subset of patients who are diagnosed as
VS because they show no signs of behavioural awareness but do show signs of covert
awareness (Fernández-Espejo & Owen, 2013; Owen et al., 2006). Owen et al. (2006)
discovered a patient who was diagnosed as VS but was able to modulate her brain
activity based on commands using functional magnetic resonance imaging (fMRI). More
specifically, this patient was asked to imagine playing tennis and to walk around her
house (two tasks that recruit distinct brain areas), and her brain activity during these two
tasks was compared to healthy controls engaging in the same tasks. During the tennis
task, the patient showed activity in the supplementary motor area; in contrast, when
imagining walking around her house, the patient showed activity in parahippocampal
gyrus, posterior parietal lobe, and the lateral premotor cortex. This brain activation was
similar to the activation seen when healthy controls imagined these two activities. Since
estimated at approximately 20%, who are diagnosed as VS but who can modulate their
brain activity based on their environment (Fernández-Espejo & Owen, 2013; Monti,
Vanhaudenhuyse, et al., 2010). The behavioural measures used to diagnose these patients
use command following as an indication of awareness. A patient who is able to complete
this motor imagery task is able to follow commands, and therefore shows signs of
awareness.
Cruse et al. (2011) were able to use another neuroimaging technique,
electroencephalography (EEG), to replicate the finding that some VS patients show signs
of covert command following, despite being diagnosed as not aware. In this study, Cruse
et al. (2011) asked patients who were diagnosed as VS to imagine moving their hand in
some trials, and imagine moving their toe in other trials, which are processes that can be
distinguished from each other using EEG. Three VS patients were able to consistently
imagine these two behaviours based on commands given by the experimenter over
multiple trials. Additionally, Monti et al. (2010) used a paradigm involving motor
imagery to allow covertly aware patients to answer yes-no questions by modulating their
brain activity, which has now been replicated in two other studies (Fernández-Espejo &
Owen, 2013; Naci & Owen, 2013). These patients were able to reliably and correctly
respond to questions that had answers that were known by the experimenter (e.g. “are you
in the grocery store” versus “are you in the hospital”). Using these techniques, some
patients have also been able to answer non-verifiable questions, for example what they
preferred to watch on television or if they were in pain (Fernández-Espejo & Owen,
2013). The findings from these neuroimaging studies suggest that some VS patients are
being misdiagnosed as unaware because they are unable to indicate their awareness with
voluntary motor behaviors.
Tasks used to assess covert awareness with neuroimaging have typically involve
some form of motor imagery. These motor imagery paradigms engage complex cognitive
processes, and require the patient to encode verbal instructions, produce the mental
imagery for a prolonged period of time, and reproduce this imagery multiple times in a
session. These tasks entail many aspects of cognitive control, including sustained
and memory of what to do for each trial (Cruse et al., 2011). Given the complexity of
these motor imagery tasks, and that these responses can be replicated many times in the
same patient, this is definitive evidence that the patients who can complete the tasks are
aware.
The discovery of covertly aware patients raises questions as to why these patients
are able to imagine motor behaviour, but unable to produce these same movements
voluntarily. One possible explanation for these motor deficits would be a disruption in the
connections between the thalamus and motor areas, as these connections are important
for initiating simple and more complex volitional movement (Magoun, 1949). Moreover,
Fernández-Espejo, Rossit, & Owen (2015) conducted a study to investigate the neural
underpinnings that lead to these patients having no voluntary control of their motor
responses. First, they compared the effective connectivity of healthy participants’ motor
networks during motor imagery and motor execution while in the fMRI, and found that
motor execution, but not motor imagery, requires an excitatory coupling from the
thalamus to the motor cortex. Second, they compared motor network structural
connectivity of a covertly aware patient to a non-VS patient with a similar injury
etiology. This non-VS patient had a similar clinical history as the VS patient, but had
emerged from MCS and was able to follow commands with motor responses. They found
that there was a selective disruption of the fibers connecting the motor cortex and
thalamus in the covertly aware patient but not in the non-VS patient. This observation
suggests that a disruption in connectivity between the thalamus and motor cortex may
explain the lack of volitional motor responses in covertly aware patients. This finding
indicates that this disruption may be a possible route for rehabilitation. Specifically, if it
were possible to enhance the connections between the thalamus and motor cortex, it may
be possible to improve these patients’ voluntary motor control, which would allow these
patients to respond to their environment behaviourally.
1.3 Brain stimulation
One way to further understand and possibly rehabilitate the motor deficits in covertly
aware patients would be to alter the dynamics of the motor system and study the resulting
or modulate brain activity, such as deep brain stimulation (DBS) and transcranial
magnetic stimulation (TMS). DBS involves the surgical implantation of a device that
delivers electrical current to a specified brain area, and can be effective at ameliorating
motor symptoms in several neurological disorders (Grill, 2005). One drawback of DBS is
that it involves neurosurgery to implant the device, thus it is invasive and expensive
(Gardner, 2013). In contrast, TMS is a non-invasive brain stimulation technique that
involves using magnetic fields to stimulate a cortical area of interest. Specifically, TMS
delivers electrical current through a magnetic coil placed on an individual’s head, and this
current produces a magnetic field that lasts approximately a millisecond. The magnetic
field creates an electrical field that can be large enough to lead to changes in neuronal
activity and, with enough current, cause an action potential in the neurons being
stimulated (Sandrini, Umilta, & Rusconi, 2011). Repetitive-TMS (r-TMS) can cause
decreases or increases in cortical excitability that can lead to plasticity changes in the
brain (Hallett, 2007), and has been used in many different clinical populations to improve
functioning, such as in Parkinson’s disease (Lefaucheur et al., 2004) and stroke patients
(Kim et al., 2006). However, TMS, especially r-TMS, is not without its risks, as r-TMS
has a risk of seizures (Hallet, 2007). DoC patients have a very high rate of seizures
(Posner, Saper, Schiff, & Plum, 2007; Tresch, Sims, Duthie, Goldstein, & Lane, 1991)
and epileptic activity is related to worsening of clinical symptoms (Chen & Wasterlain,
2006; Posner, Saper, Schiff, & Plum, 2007), consequently r-TMS would be too risky to
be implement with these patients. While some studies have investigated the effects of
DBS and TMS in vegetative state patients (Ragazzoni et al., 2013; Schiff et al., 2007),
there are risks and difficulties associated with implementing these procedures with this
patient group.
Another non-invasive brain stimulation technique that is gaining popularity in
research and clinical worlds is transcranial direct current stimulation (tDCS). tDCS
modulates the excitability of target brain areas by using electrodes placed on the scalp.
These electrodes deliver a weak electrical current (usually between 0.5 to 2 mA), which
can increase or decrease the likelihood of an action potential in the neurons being
stimulated (Filmer, Dux, & Mattingley, 2014). tDCS has two types of electrodes: anodal
is considered to be excitatory. Cathodal tDCS, where the cathode electrode is placed on
the area of interest, is considered inhibitory. There is also a sham tDCS that mimics the
sensations of active tDCS without stimulating the brain. The purpose of the sham tDCS is
to control for factors unrelated to the stimulation that may lead to changes in behavior,
for example learning and placebo effects (Filmer et al., 2014). The advantages of tDCS
allow for it to be a better suited method to use in DoC patients. Specifically, tDCS can be
easily transported, is non-invasive, and does not carry a risk of inducing seizures
(Poreisz, Boros, Antal, & Paulus, 2007).
1.3.1 Mechanisms of action of tDCS
Anodal tDCS can modulate corticomotor excitability (Nitsche & Paulus, 2000), improve
motor performance (Waters-Metenier, Husain, Wiestler, & Diedrichsen, 2014), and
improve cognitive functions, including attention, motor learning, and working memory
(Fregni et al., 2005; Jacobson, Koslowsky, & Lavidor, 2012; Kang & Paik, 2011). How
tDCS is able to influence performance on numerous cognitive and motor tasks is not well
understood, although there are some theories on its underlying mechanisms. Nitsche &
Paulus (2011) and Nitsche et al. (2008) suggests that tDCS differs from other forms of
brain stimulation, for example TMS, because the static fields of tDCS are not large
enough to cause depolarization quickly enough to lead to an action potential. Instead,
tDCS changes the resting membrane potential of the neurons near the stimulation site,
which leads to an increase or decrease in the likelihood of an action potential firing. In
support of this theory, low current excitatory stimulation of animal hippocampal slices
decreased the threshold needed for these neurons to fire (Bikson et al., 2004). According
to this theory, the changes seen during tDCS are thought to be dependent on changes in
the permeability of neuronal ion channels, specifically sodium and calcium channels
(Nitsche et al., 2003). In animals, anodal direct current stimulation leads to increases in
calcium levels in cells (Islam, Aftabuddin, Moriwaki, Hattori, & Hori, 1995).
Additionally, when a sodium channel-blocking drug is administered to healthy
participants before anodal tDCS, no changes in corticomotor excitability are observed
during the stimulation (Liebetanz, Nitsche, Tergau, & Paulus, 2002). Nitsche’s et al.
that tDCS will be most effective when it is paired with an action or task that involves the
brain area being stimulated, so that an action potential is initiated by that task.
In addition, N-methyl-D-aspartate (NMDA) receptors, which respond to the
neurotransmitter glutamate, have been implicated in the learning effects seen after tDCS.
Specifically, it is believed that the effect of tDCS on NMDA receptors leads to changes in
neuronal plasticity through long-term potentiation and long-term depression (Luft,
Pereda, Banissy, & Bhattacharya, 2014; Nitsche et al., 2008). In support of this idea,
when drugs that block NMDA receptors are administered before stimulation, tDCS is less
effective at modulating MEP amplitude (Nitsche et al., 2003), and a reduction of the
long-term effects of tDCS is observed (Liebetanz et al., 2002). Additionally, after anodal
stimulation of the motor cortex, increases in myoinositol, a chemical involved in the
long-term potentiation second messenger system, are observed in the area being
stimulated (Rango et al., 2008). Various other studies have implicated changes in NMDA
receptors and/or glutamate as a key mechanism of action in the learning effects observed
with tDCS (Clark, Coffman, Trumbo, & Gasparovic, 2011; Hunter et al., 2015).
Other neurotransmitters have also been implicated in the effects of tDCS. For
example, Kim, Stephenson, Morris, & Jackson (2014) used fMRI to investigate
neurotransmitter changes during a motor task paired with anodal tDCS over the motor
cortex. They found a significant reduction in gamma-Aminobutyric acid (GABA)
concentrations in the motor cortex during anodal stimulation, and that the concentration
of GABA predicted inter-individual differences in motor learning memory on the motor
task performed during stimulation. tDCS has also been shown to influence levels of
brain-derived neurotropic factors (Fritsch et al., 2010), acetylcholine (Kuo, Grosch,
Fregni, Paulus, & Nitsche, 2007), and dopamine (Tanaka et al., 2013).
Another relatively new theory on the mechanisms underlying tDCS suggests that
the stimulation may influence glial cells in the area being stimulated. Ruohonen & Karhu
(2012) used mathematical modeling to estimate transmembrane potentials in neuron and
glial cells during tDCS. They showed that the changes in transmembrane potentials
caused by tDCS display many similarities to the changes seen in glial cells, specifically
with tDCS, ~2mV, would be enough current to cause glial cells to undergo
depolarization, and this would lead to changes in the regulation of neurotransmitter
uptake and release. To my knowledge, there is no experimental evidence to support – or
detract from – this theory.
1.3.2 tDCS and motor function
The effects of tDCS on motor function have been investigated extensively (Pavlova, Kuo,
Nitsche, & Borg, 2014; Saucedo Marquez, Zhang, Swinnen, Meesen, & Wenderoth,
2013; Simonetta-Moreau, 2014; Vines, Cerruti, & Schlaug, 2008). These studies have
shown that tDCS can modulate the excitability of the motor cortex (López-Alonso,
Fernández-del-Olmo, Costantini, Gonzalez-Henriquez, & Cheeran, 2015; M.A. Nitsche
& Paulus, 2000), improve motor learning (Waters-Metenier et al., 2014), and influence
brain activity in the motor network (Polanía, Paulus, & Nitsche, 2012), when stimulating
the motor cortex. Moreover, tDCS has been shown to improve motor function in stroke
patients and in patients with other neurological disorders (Bastani & Jaberzadeh, 2012;
Boggio et al., 2007).
tDCS and corticomotor excitability. The most consistent and robust finding from the
tDCS literature is that tDCS modulates cortical excitability of the motor cortex, as
measured by TMS induced motor evoked potentials (Lang, Nitsche, Paulus, Rothwell, &
Lemon, 2004; Nitsche & Paulus, 2000). As mentioned previously, TMS is another type
of brain stimulation method that delivers magnetic pulses to the brain area being
stimulated and, unlike tDCS, these pulses can cause an action potential. When these
pulses are delivered to the motor cortex, a motor evoked potential (MEP) can be
produced. A MEP is muscle activity that has been caused by a TMS pulse, and MEP
amplitude (how large the muscle activity is) is considered to be a measure of excitability
in the motor cortex (Hallet, 2000). When anodal tDCS is applied over the motor cortex at
rest, an increase in MEP amplitude is observed. When cathodal tDCS is applied over the
motor cortex at rest, a decrease in MEP amplitude is observed (Nitsche & Paulus, 2000;
Pellicciari, Brignani, & Miniussi, 2013). This change in cortical excitability lasts up to 90
When anodal tDCS is applied daily, cumulative effects of tDCS are observed on MEP
amplitude (Alonzo, Brassil, Taylor, Martin, & Loo, 2012). Furthermore, when tDCS over
the motor cortex is paired with active movement, MEP amplitude is modulated to a
greater degree than when tDCS is applied at rest (Kim & Ko, 2013). For example, Kim &
Ko (2013) compared the effects of anodal tDCS and sham tDCS during rest and a grip
exercise. They found that pairing anodal tDCS with the grip exercise led to the greatest
increase in MEP amplitude after stimulation, whereas anodal tDCS at rest and the grip
exercise with sham tDCS led to a similar smaller increase in MEP amplitude. Sham tDCS
at rest led to no increase in MEP amplitude. These findings provide evidence that anodal
tDCS increases corticomotor excitability when applied to the motor cortex, whether the
subject is at rest or engaging in a motor behaviour.
There are some inconsistencies in the literature on the amount and direction of
change in MEP amplitude after movements are paired with anodal tDCS over the motor
cortex. Miyaguchi and colleagues (2013) investigated the effects of anodal tDCS over the
motor cortex on MEP amplitude when the stimulation was paired with a finger
abductor-adduction task or applied at rest. They found that anodal tDCS paired with rest led to an
increase in MEP amplitude, but the active movements paired with tDCS and without
tDCS led to a decrease in MEP amplitude. One possible explanation for these
inconsistent findings may be related to effects of different types of movements on MEP
amplitude. For example, Bortoletto, Pellicciari, Rodella, & Miniussi (2015) compared the
effects of fast and slow thumb movements on MEP amplitude when paired with anodal
tDCS over the motor cortex. They found that anodal tDCS paired with slow movements
increased MEP amplitude to a greater degree than sham tDCS and anodal tDCS paired
with fast movements. They concluded that combining anodal tDCS with another event
that increases corticomotor excitability to a large degree (i.e. fast, exhaustive movements)
reversed the facilitatory effect of anodal tDCS on MEP amplitude.
More generally, there are some inconsistent findings on the assumption that
anodal tDCS enhances cortical excitability and cathodal tDCS diminishes it (Batsikadze,
Moliadze, Paulus, Kuo, & Nitsche, 2013; Rosenkranz, Nitsche, Tergau, & Paulus, 2000).
within studies that have found results consistent with this assumption, large
inter-individual variability on changes in excitability after tDCS have been observed (Nitsche
& Paulus, 2000; Strube, Bunse, Malchow, & Hasan, 2015; Wiethoff, Hamada, &
Rothwell, 2014), although there is support that the intra-individual variability in response
to tDCS is small (Alonzo et al., 2012). Wiethoff and colleagues (2013) observed only
half of their participants’ had increased MEP amplitude after anodal tDCS. Despite these
findings, there have been numerous studies under many different experimental conditions
that support the assumption that anodal tDCS increases excitability and cathodal tDCS
decreases it when stimulating the motor cortex (Alonzo et al., 2012; Nitsche & Paulus,
2000).
tDCS and motor learning. In addition to modulating corticomotor excitability, tDCS
over the motor cortex also influences performance on motor tasks. One theory of anodal
tDCS is that it increases long term potentiation, which leads to increased plasticity during
a motor learning task (Nitsche et al., 2003). The beneficial effects of tDCS on task
performance have been demonstrated in thumb movements (Bortoletto et al., 2015;
Koyama, Tanaka, Tanabe, & Sadato, 2015), to more complex motor behaviours, for
example sequence learning (Waters-Metenier et al., 2014), and robotic manipulandum
(Hunter, Sacco, Nitsche, & Turner, 2009). For instance, Bortoletto et al. (2015) found
participants receiving anodal tDCS over the motor cortex showed increased peak
acceleration of thumb abduction movements when compared to a control condition.
These results have been replicated in similar studies looking at increasing acceleration in
a ballistic thumb movement task (Koyama et al., 2015), and improving hand dexterity
with tDCS (Pavlova et al., 2014). Christova, Rafolt, & Gallasch (2015) had participants
perform the grooved pegboard test, which assesses manual dexterity and coordination,
and found that participants completed the task faster when stimulated with anodal tDCS
compared with when they were given sham tDCS. In addition, anodal tDCS has also
shown to improve swallowing (Zhao et al., 2015), whole body balance (Kaminski et al.,
2013), and visuomotor tracking (Goodwill, Reynolds, Daly, & Kidgell, 2013).
A similar effect of tDCS on more complex motor learning tasks has also been
anodal tDCS over motor areas improves finger sequence learning. They used stimulation
in conjunction with daily training on a sequence learning task, and found that by the end
of four days the anodal group was 40% faster in the task than the sham group. Similarly,
Reis et al. (2009) had participants train on a sequential visual isometric pinch task for five
days in conjunction with anodal or sham tDCS over the motor cortex, and found that the
anodal tDCS group showed significantly more training improvements than the sham
group. Numerous studies have shown that motor learning, and in particular sequence
learning, can be significantly enhanced with anodal tDCS paired with training on the task
(Gomes-Osman & Field-Fote, 2013; Saucedo Marquez et al., 2013; Stagg et al., 2011).
Neural mechanisms underlying the behavioural effect of tDCS.In addition to
changing corticomotor excitability and influencing performance on motor tasks,
simultaneous tDCS/fMRI studies have demonstrated that tDCS influences activity in
brain networks. There is large variability in the findings from neuroimaging studies with
tDCS. For example, Antal, Polania, Schmidt-Samoa, Dechent, & Paulus (2011) found
that short periods of anodal tDCS and cathodal tDCS over the motor cortex during finger
tapping did not have any effect on activity in the motor cortex or basal ganglia, although
anodal tDCS during finger tapping led to reduced activity in supplementary motor cortex
in the hemisphere being stimulated. In addition, Amadi, Ilie, Johansen-Berg, & Stagg
(2014) investigated changes in connectivity 10 minutes after receiving anodal, cathodal,
and sham tDCS separately over the motor cortex and found that although cathodal
stimulation increased connectivity in the motor network, anodal tDCS did not produce
significant changes in connectivity. In contrast, Baudewig, Nitsche, Paulus, & Frahm
(2001) found reduced activation in the premotor cortex and the supplementary motor
cortex after cathodal tDCS, and a trend to increased activation in these areas after anodal
tDCS. In addition, Zheng, Alsop, & Schlaug (2011) observed an increase in regional
cerebral blood flow during and after anodal tDCS. Sehm et al. (2012) observed increased
functional connectivity in the motor network during anodal tDCS. Specifically,
bihemispheric tDCS (where the anodal and cathodal electrode is positioned on the left
and right hemispheres) modulated activation in prefrontal regions and the primary and
area of interest, and the reference electrode is placed on the forehead) modulated
prefrontal, parietal, and cerebellar areas. Furthermore, Polanía, Nitsche, & Paulus (2011)
stimulated the motor cortex of participants with anodal tDCS and found there was an
increase in functional coupling of the thalamus and the motor cortex during stimulation.
While Polanía and colleagues’ (2011) results suggest that it would be theoretically
possible to increase the connectivity between the motor cortex and the thalamus in
covertly aware patients, the heterogeneity of the neuroimaging results warrants further
investigation of the underlying neural mechanisms of tDCS.
Clinical applications of tDCS.In support of improving motor function in covertly aware
patients, previous studies on neurological patients have shown that motor deficits can be
improved with anodal tDCS (Boggio et al., 2007; Bolognini et al., 2011), and these
improvements can last past the stimulation period (Angelakis et al., 2014). The effects of
tDCS on stroke patients have been widely studied, and many of these studies show
positive tDCS effects on motor function. For example, Boggio et al. (2007) investigated
the effects of four weeks of tDCS on the motor cortex in chronic subcortical stroke
patients with motor deficits. They had three stimulation conditions: sham tDCS, anodal
tDCS of the affected hemisphere, and cathodal tDCS of the unaffected hemisphere. They
found that participants in both active stimulation conditions showed improvements on
motor tasks, and these improvements were greatest in the last two weeks of stimulation.
Bolognini and colleagues (2011) investigated the effects of pairing bihemispheric tDCS
with constraint movement therapy, a rehabilitation program used to improve motor
function, in stroke patients. They found that active tDCS paired with this program led to
functional improvements in participants’ motor abilities to a greater degree than when
sham tDCS was paired with the program.
tDCS can improve motor functioning in other types of neurological patients with
motor dysfunction, including patients with damaged spinal cords and Parkinson’s
patients. For example, Murray et al. (2015) demonstrated that tDCS improves
corticomotor excitability in patients with spinal cord injuries who had motor deficits in
their wrist. Although they observed an increase in MEP amplitude after anodal tDCS but
This study involved only two sessions of active tDCS, which may explain why tDCS did
not lead to functional motor improvements. Fregni et al. (2006) found that anodal tDCS
over the motor cortex increased MEP amplitude and improved motor function, as
measured by the Unified Parkinson's Disease Rating Scale, a simple reaction time task
and Purdue Pegboard test, in Parkinson’s patients when compared with cathodal
stimulation of the motor cortex as well as anodal stimulation of the dorsolateral prefrontal
cortex. Kaski, Allum, Bronstein, & Dominguez (2014) paired anodal tDCS with dance
therapy in one Parkinson’s patient, and found that when compared to sham, pairing
anodal tDCS with tango dancing led to improvements in the patient’s dance ability and
the patient’s gait and ability to walk for six minutes. These studies, among many others
(Benninger et al., 2010; Hesse et al., 2007; Hummel, 2005), demonstrate that tDCS can
improve motor function for many patient types, with different neurological profiles.
In addition, tDCS has also been investigated, with some success, in DoC patients.
For example, Thibaut, Bruno, Ledoux, Demertzi, & Laureys (2014) used one session of
anodal tDCS over the dorsolateral prefrontal cortex of 30 VS and MCS patients, and
showed improvements on the Coma Recovery Scale. Specifically, they found a
significant improvement during tDCS in scores on the Coma Recovery Scale in MCS
patients, but no improvements were seen in VS patients during tDCS. They also found 2
out of 25 VS patients, and 13 out of 30 MCS patients, showed post-tDCS signs of
consciousness. They concluded that anodal tDCS over the dorsolateral prefrontal cortex
transiently improved signs of consciousness in some DoC patients.
Similarly, Angelakis et al. (2014) used anodal tDCS to stimulate the dorsolateral
prefrontal cortex or the sensorimotor cortex for two weeks in MCS and VS patients, and
investigated the effect of tDCS on performance on the Coma Recovery Scale. They found
that all MCS patients showed an improvement in their scores, whether the dorsolateral
prefrontal cortex or the sensorimotor cortex was stimulated. They did not find any
improvement in scores after tDCS in the VS patients. In the patients that improved, these
improvements included becoming able to swallow food, localizing noxious stimuli, and
tDCS over the cerebellum of DoC patients, and saw transient clinical improvements on
the CRS-R in MCS but not VS patients.
These three studies support the idea that tDCS can improve functioning in some
DoC patients. One reason that only some patients in these studies improved could be that
those patients who responded to tDCS had some intact awareness. Because none of these
studies specifically examined covertly aware patients, or compared differences in patients
who did and did not respond to tDCS, the reason why some patients and not others
responded is not clear. Moreover, these studies did not look at motor functions
specifically, and a targeted approach on motor function for covertly aware patients may
lead to more clinical benefits for these patients.
1.4 Study Objectives.
As summarized above, previous research has shown that tDCS increases corticomotor
excitability (Nitsche & Paulus, 2000) and improves motor learning in healthy controls
(Waters-Metenier et al., 2014) and neurological patients (Angelakis et al., 2014), and
provides evidence that stimulating the motor cortex may influence the functional
connectivity between the motor cortex and the thalamus (Polanía, Paulus, & Nitsche,
2011). This suggests that anodal tDCS has the potential to increase the connectivity
between these two areas in covertly aware patients. If this were possible, we do not know
if this increase in connectivity may lead to improvements in motor execution in these
patients. It is also presently unknown if tDCS can improve motor execution, without a
sequence learning component.
The long-term goal of this study is to investigate the mechanisms underlying the
effect of tDCS in covertly aware patients and study its potential to improve their motor
functioning. Before investigating the effects of tDCS in covertly aware patients, it is
important to investigate the efficacy of possible paradigms in healthy controls to find a
paradigm with the greatest potential to improve motor function in patients. As a starting
point, it is important to find a paradigm that improves motor functioning without
sequence learning, and that can be implemented in covertly aware patients. Experiment I
Experiment I investigated the potential for tDCS to improve voluntary motor
execution, as opposed to motor sequence learning, in healthy controls. Motor skill
learning involves improving the spatial and temporal accuracy in motor tasks with
practice, whereas motor control involves the planning and execution of movements.
Motor skill learning is a more complex process that originates from the repeated practice
of motor control, and leads to more efficient motor control for the task at hand
(Willingham, 1998). Although there is strong support that anodal tDCS can improve
motor skill learning in the form of sequence learning, whether anodal tDCS can improve
voluntary motor control without sequence learning is not clear. The motor deficits
covertly aware patients display are so severe that they have minimal to no control over
their movements. Given these deficits, we would not expect that covertly aware patients
would be able to learn and repeat a sequence or pattern of motor responses. The first step
to improving these deficits would be to improve motor control, as opposed to sequence
learning.
In addition to not knowing if tDCS can improve motor control without sequence
learning, it is not known if training on a motor task during stimulation is necessary to see
significant improvements in motor control. Most studies investigating the effects of tDCS
on motor function have combined practicing on a motor task with the stimulation (Reis et
al., 2009; Waters-Metenier et al., 2014). As mentioned previously, VS patients who have
minimal to no motor control would be unable to perform any motor task during the
stimulation period. Experiment I investigated the effects of tDCS when participants are at
rest versus when they are training on a motor control task. If training were necessary, one
way that training would be possible in this patient group would be to passively move
them during the stimulation period. Experiment II investigates the effects of anodal tDCS
in healthy controls during passive movements on corticomotor excitability, specifically
Chapter 2
2 Experiment I – Investigating the use of transcranial direct current stimulation to
improve motor performance with and without training
Many previous tDCS studies have shown performance improvements in motor skill learning, for example on a sequence reaction time task, with brain stimulation (Kang & Paik, 2011; Lefebvre et al., 2012; Reis et al., 2009). However, these studies involved training on the task at hand. Active motor training in vegetative state patients is not possible, as they have minimal to no voluntary control over their motor behaviors. Moreover, we do not know whether DoC patients can learn motor sequences, and motor skill learning involves having the individual engage in a task for long periods of time, which would likely not be possible for DoC patients due to fatigue. The current study investigated if tDCS can improve motor control without sequence learning, and explored if training during stimulation was necessary to see performance improvements.
Previous studies have shown that tDCS can improve accuracy and reaction time in explicit and implicit sequence learning tasks (Kang & Paik, 2011; Waters-Metenier et al., 2014). These tasks involve presenting numbers or symbols to participants, and having participants respond as quickly as possible by pressing a button that corresponds with that number or symbol. These numbers or symbols are presented in a predetermined order with a pattern or sequence, and participants can learn the sequence by practicing on the task (Schwarb & Schumacher, 2012). Since the current study was investigating if tDCS can improve motor control without sequence learning, a similar task was used in Experiment I except the numbers were presented in a random order instead of a predetermined sequence, so that participants would not be learning patterns of motor responses. Instead, participants would have no prior information of what button they will be expected to press until the numbers appeared on the screen. To my knowledge, no previous study has investigated the effect of tDCS on a random ordered sequence reaction time task.
tDCS. A secondary aim was to determine if active training is necessary to see
improvements, or if tDCS can improve motor control while the participant is at rest. It was hypothesized that participants receiving anodal tDCS will improve on this task more than participants receiving sham tDCS. As well, it was predicted that participants
receiving anodal tDCS in the training and no training group would improve on the task, but the improvement would be greater in the training group. This is based on previous research that shows anodal tDCS at rest shows increases in MEP amplitude greater than sham tDCS at rest (Nitsche & Paulus, 2000). However, motor training in combination with tDCS shows greater increases in MEP amplitude and motor performance
improvement when compared to tDCS at rest (Kim & Ko, 2013).
2.1 Materials and Methods
2.1.1 Participant Demographics.
Forty-one healthy right-handed participants (25 female, 16 males) between the ages of 18 to 30 (M= 22, SD=2.4) participated in this study. Participants were recruited through posted flyers from the University of Western Ontario campus, and were screened prior to recruitment into study to ensure they did not meet any exclusion criteria. Exclusion criteria included: left-handed or mixed handedness, any neurological or psychiatric problems, implantation of metallic objects in the brain, use of psychoactive medication, active skin problems, unstable medical conditions, susceptible to migraines or other frequent headaches, any history of episodes of faintness, any metal implants or devices, current use of a hearing aid and/or pregnant or trying to become pregnant. Upon arriving for study, participants provided written informed consent. At the end of the study, participants received $10 for their participation. The Health Sciences Research Ethics Board of the University of Western Ontario provided ethical approval for the study. One participant was excluded because the experimenter was unable to reduce the impedance during stimulation due to the thickness of the participants’ hair.
2.1.2 Experimental Design
below) during stimulation or were at rest during stimulation. Participants completed the Edinburgh Handedness Questionnaire, and then were given instruction on how to perform the motor task, and performed a 1-minute practice session before beginning the study. Once participants felt comfortable with the task, the anodal and cathodal electrodes were positioned on the scalp. Before starting the stimulation, participants in all conditions performed the task for five minutes to measure baseline performance. Then the
stimulation was turned on, and participants either trained on the task for 20 minutes, or watched a 20-minute video. This video was a 20-minute episode of the show “Friends”, which was chosen so participants would be in a relaxed state during the stimulation and to ensure all participants were doing the same thing during the rest period. They were also instructed to not move as much as possible during the video. Once the stimulation was complete, all participants performed the task again for five minutes to measure post-tDCS performance. Finally, participants completed a post-tDCS perceptual scale (modified from Waters-Metenier et al., 2014) to investigate if there were differences in perception between sham and anodal tDCS.
Figure 1 Schematic of procedure. All participants practiced on the task and performed
the task before receiving tDCS to get a baseline measure of performance. Then
2.1.3 Transcranial direct current stimulation
The Chattanooga Ionto Dual Channel Electrophoresis System was used to deliver
stimulation to participants. Carbon rubber electrodes (size: 3.81 cm x 5.72 cm) covered in
saline soaked sponges were placed on participants’ heads. The anodal electrode was
placed over the left motor cortex (C3) and the cathodal was placed over the right motor
cortex (C4). The unit was set to a current for 2 mA for 20 minutes. In the sham tDCS
condition, the unit was ramped up for 30 seconds, and then ramped down. In the anodal
tDCS condition, participants received a total of 48 coulombs over the 20-minute period.
Bihemispheric tDCS was used instead of the traditional unilateral montage because
previous studies have demonstrated that this bihemispheric montage improves motor
learning to a greater degree than unilateral montages (Kang & Paik, 2011). We
speculated that since this montage shows greater performance improvements in motor
learning tasks that it may also lead to greater performance gains on the motor control task
used in this study.
2.1.4 Experimental Task
The task used for this experiment was modified based on the serial reaction time task.
This task involves presenting numbers to participants, and asking participants to respond
as quickly as possible by pressing the corresponding key on the keyboard. The numbers
in the serial reaction time task are presented in predetermined order or sequence. In the
current study, the numbers presented did not have a pattern or sequence, and were instead
presented in a pseudorandom order. The task was presented using MATLAB R2013b on
a Dell laptop (Windows 7). Participants were presented with random digits (1-4) on a
computer screen, and asked to respond with their right hand by pressing the
corresponding keys on the computer keyboard as quickly as possible. The ‘f’ key
corresponded with ‘1’, the ‘g’ key corresponded with ‘2’, the ‘h’ key corresponded with
‘3’, the ‘j’ key corresponded with ‘4’, and these keys were labeled with their
corresponding number. Participants were asked to use their index finger to indicate ‘1’,
their middle finger to indicate ‘2’, their ring finger to indicate ‘3’, and their pinky finger
to indicate ‘4’. Each number was pseudo randomized to appear the same number of times
within the blocks in which keys were pressed more or less. A block consisted of a total of
10 trials, where digits were presented for 20 seconds, and each trial had a 5 second break
in between. For the participants who trained on the task during stimulation, they
completed 4 blocks of 10 trials during the stimulation period. After each block they had a
self-selected break of the participants’ choosing, which lasted on approximately 30
seconds.
2.1.5 Data Analysis
To investigate performance improvements, average reaction time (in seconds) and accuracy (correct responses / total responses) were calculated for the baseline and post-test for each participant. A mixed model Analysis of Variance (ANOVA) was conducted for both the training and non-training groups separately. Time point (baseline vs. post-test) was the within subject factor, and tDCS type (anodal vs. sham) was the between subject factor. To investigate if participants receiving sham tDCS differed in their responses on the tDCS perceptual scale from participants receiving anodal tDCS, a chi-square test of association was conducted.
2.2 Results
2.2.1 Performance on the motor control task before and after tDCS
Table 1 displays the means and standard deviations for accuracy and reaction time on the
task before and after receiving tDCS for the group of participants who trained on the task.
Table 2 displays means and standard deviations for accuracy and reaction time on the
task before and after receiving tDCS for the group of participants who were at rest while
receiving tDCS.
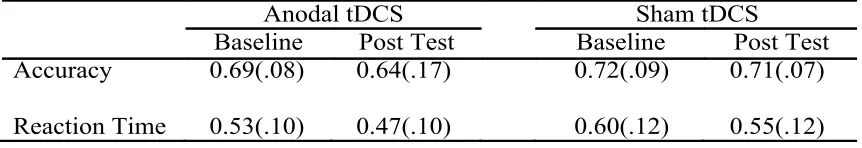
Table 1 Performance values for training group. Means and standard deviations for
baseline and post-test performance on the random sequence reaction time task for training group.
Anodal tDCS Sham tDCS
Baseline Post Test Baseline Post Test
Accuracy 0.69(.08) 0.64(.17) 0.72(.09) 0.71(.07)
Reaction Time 0.53(.10) 0.47(.10) 0.60(.12) 0.55(.12)
Table 2Performance values for rest group. Means and standard deviations for baseline and post-test performance on the random sequence reaction time task for rest group.
A mixed design ANOVA performed on the training group’s accuracy revealed no significant interaction for the difference between the sham and anodal group’s change in
accuracy from baseline to post-test (F(1,18) = .583, p =.455), which suggests tDCS did not
have an effect on accuracy in this group. In addition, no significant main effect of time
(i.e. baseline and post-test) was found for accuracy (F(1,18) = 1.456, p =.243), nor was a
significant main effect of tDCS type found in accuracy between the sham and anodal
group (F(1,18) = 1.199, p =.288). A follow up mixed design ANOVA was conducted after
removing any participants who performed below chance (accuracy of less than .25), and they confirmed the previous reported results. There was no significant interaction for the difference between the sham and anodal group’s change in accuracy from baseline to
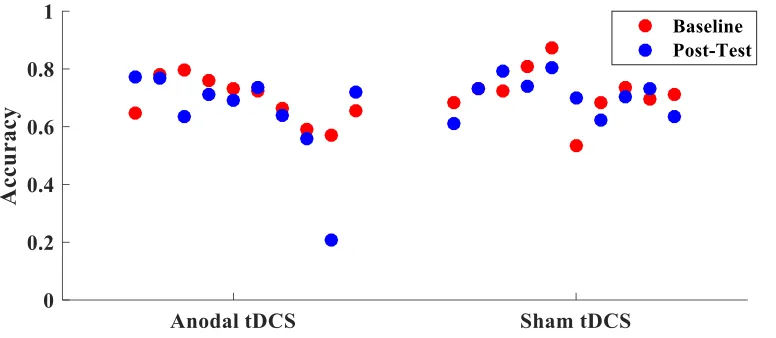
post-test (F(1,17) = .006, p=.940). Figure 2 displays the change in accuracy from baseline
to post test for each participant.
Figure 2 Accuracy in training group. Difference in average accuracy from baseline to
post-test for each participant in the training group.
Anodal tDCS Sham tDCS
Baseline Post Test Baseline Post Test
Accuracy 0.75(.06) 0.76(.06) 0.75(.04) 0.71(.07)
Reaction Time 0.55(.09) 0.54(.09) 0.51(.05) 0.50(.04)
A mixed design ANOVA performed on the trained group’s reaction time revealed no significant interaction for the difference between the sham and anodal group’s change in
speed from baseline to post test (F(1,18) = .200, p =.660), which suggests tDCS did not
have an effect on reaction time in this group. However, a main effect of time (F(1,18) =
7.497, p =.014) revealed a significant decreased in reaction time between the baseline (M = .562, SD =.10) and post-test (M = .511, SD = .12). No main effect of tDCS type was
found (F(1,18) = 2.871, p =.107) . A follow up mixed design ANOVA was conducted after
removing any participants who performed below chance (accuracy of less than .25), and they confirmed the previous reported results. There was no significant interaction for the difference between the sham and anodal group’s change in reaction time from baseline to
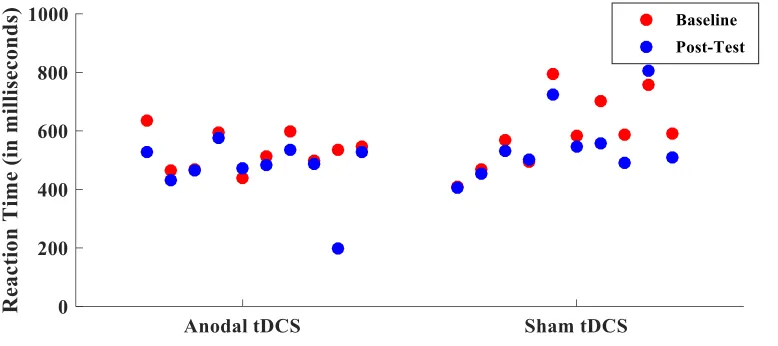
post-test (F(1,17) = .392, p=.540). Figure 3 displays the change in reaction time from
baseline to post-test for each participant.
Figure 3 Reaction times in training group. Difference in average reaction time from
baseline to post-test for each participant in the training group.
A mixed design ANOVA performed on the rest group’s accuracy revealed no significant interaction between the sham and anodal group’s change in accuracy from baseline to
post-test (F(1,18) = 2.043, p =.170), which suggests tDCS did not have an effect on
accuracy in this group. In addition, no significant main effect of time (i.e. baseline to
post-test) was found for change in accuracy (F(1,18) = .740, p =.401), nor was a significant
1.397, p =.253). Figure 4 displays the change in accuracy from baseline to post-test for each participant.
Figure 4 Accuracy in rest group. Change in average accuracy from baseline to post-test
for participants in the rest group.
A mixed design ANOVA performed on the rest group’s reaction time revealed no
significant interaction for the differences between the sham and anodal group’s change in
speed from baseline to post-test (F(1,18) = .677, p =.422), which suggests tDCS did not
have an effect on reaction time in this group. A main effect of time (F(1,18) = 31.046, p
<.000) revealed a significant decrease in reaction time between baseline (M = .533, SD =.071) and post tDCS (M = .516, SD = .074). No significant main effect of tDCS type
was found between the anodal and sham group (F(1,18) = 1.850, p =.422). Figure 5
Figure 5 Reaction times in rest group. Difference in average reaction time from baseline to post-test for each participant in the rest group.
2.2.2 Performance on motor control task during tDCS
As no difference in performance was found from baseline to post-test in the anodal and
sham tDCS groups, an exploratory post-hoc analysis of the training group’s performance
improvement during the stimulation period was conducted to investigate if online tDCS
led to improvement on this task. A mixed model ANOVA revealed no significant
interaction for the difference in accuracy from the first training block to the last training
block between the sham and anodal groups (F(1,18) = .000, p =.997). A mixed model
ANOVA revealed no significant interaction for the difference in reaction time from the
first training block to the last training block between the sham and anodal groups (F(1,18) =
3.998, p =.061).
2.2.3 Perception of tDCS
Table 3 displays participants’ responses to each question about the sensations from tDCS
in the tDCS perception questionnaire, which was completed at the end of the experiment.
No significant difference in responses on the questionnaire between the sham and anodal
group was found. A chi square test of association was performed to determine if there
was a difference between the sham and anodal tDCS condition in participants’ belief that
they received real versus placebo tDCS, with no difference found in responses between
the two conditions (X2
Table 3 Perception of tDCS sensations. Mean ratings on a scale from 1 to 10 for anodal and sham tDCS group from the tDCS perception questionnaire. No significant differences were found in responses between anodal and sham conditions.
Figure 6 Belief as to whether participants received real tDCS. Number of participants
who responded yes versus no as to whether or not they believed they received real tDCS for anodal and sham condition. No significant difference was found in responses between the two groups.
2.3 Discussion
This experiment did not find evidence that anodal tDCS improves reaction time or
accuracy on a random sequence reaction time task when compared to sham tDCS.
Participants in both tDCS groups did not improve in accuracy from baseline to post test.
The results indicate that participants did tend to decrease their speed significantly on the
task from baseline to the post-test, whether or not they had trained on the task. This
decrease in speed happened whether participants received anodal or sham tDCS,
signifying that this improvement in reaction time was unrelated to the tDCS.
!
Question Anodal
tDCS
Sham tDCS
P value
tDCS intensity level 4.55 4.00 .252
Distraction due to tDCS 2.15 2.25 .806
Discomfort level from tDCS 2.95 2.25 .222
Feeling of tingling from tDCS 4.00 4.20 .795
Pain from tDCS 2.05 2.10 .947
Feeling of burning from tDCS 3.18 2.55 .494
Feeling of itching from tDCS 2.65 2.70 .954
Feeling of dizziness from tDCS 0.55 0.50 .904
13 14
7 6
ANODAL TDCS SHAM TDCS
In addition, no group differences between the anodal and sham tDCS conditions were
found in terms of hours of sleep the night before and perception of tDCS sensations.
There was also no significant difference in belief as to whether participants had received
sham versus anodal tDCS, which suggests that the sham condition was effective at
mimicking the sensations of real tDCS. This finding supports the use of the sham
condition as an appropriate placebo condition.
There may be multiple explanations for why anodal tDCS did not improve
performance on this task. Firstly, it is possible that multiple sessions of tDCS would be
needed. Studies that stimulate participants over a number of days find more robust tDCS
effects on performance compared to when tDCS is applied over one day (Alonzo et al.,
2012; Reis et al., 2009). Additionally, studies have found that on some motor tasks, tDCS
leads to greater improvement when tested on the task the next day compared to
immediately after stimulation (Saucedo Marquez et al., 2013). Nevertheless, even if
multiple days were required to see significant improvement on this task with tDCS, a
pattern of improvement with tDCS, even if not significant, would likely still appear with
one session of tDCS. For example, Reis and colleagues (2009) investigated the effects of
anodal tDCS on motor skill learning over five days. Although the greatest improvement
due to anodal tDCS was observed on the fifth day, there was still improvement within the
first day. No pattern of improvement was observed when comparing performance in the
anodal and sham tDCS condition for the current study, suggesting that even with multiple
days, performance would likely not be improved by tDCS on this task.
Another possibility as to why we did not see a significant effect of tDCS is
because of a lack of power to detect an effect, had it been there. We included 10
participants in each condition, which is typical for other tDCS studies that have about 10
to 15 participants in each condition (Alonzo et al., 2012; Baarbé et al., 2014; Gálvez,
Alonzo, Martin, & Loo, 2012). In addition, if this were the case, a pattern would likely
have emerged from the data despite it not being significant. No discernable pattern
emerged from the data when comparing the change in performance in the sham and
anodal tDCS (refer to figures 3, 4, 5, & 6). Based on these figures, very few participants
showed large changes in their performance, and there was no difference in pattern for this