Scholarship@Western
Scholarship@Western
Electronic Thesis and Dissertation Repository
9-26-2017 2:00 PM
The Development and Numerical Modelling of a Representative
The Development and Numerical Modelling of a Representative
Elemental Volume for Packed Sand
Elemental Volume for Packed Sand
Ashraf ThabetThe University of Western Ontario
Supervisor
Dr. Anthony Straatman
The University of Western Ontario
Graduate Program in Mechanical and Materials Engineering
A thesis submitted in partial fulfillment of the requirements for the degree in Master of Engineering Science
© Ashraf Thabet 2017
Follow this and additional works at: https://ir.lib.uwo.ca/etd
Part of the Computer-Aided Engineering and Design Commons, Energy Systems Commons,
Environmental Engineering Commons, Heat Transfer, Combustion Commons, and the Other Mechanical Engineering Commons
Recommended Citation Recommended Citation
Thabet, Ashraf, "The Development and Numerical Modelling of a Representative Elemental Volume for Packed Sand" (2017). Electronic Thesis and Dissertation Repository. 4996.
https://ir.lib.uwo.ca/etd/4996
This Dissertation/Thesis is brought to you for free and open access by Scholarship@Western. It has been accepted for inclusion in Electronic Thesis and Dissertation Repository by an authorized administrator of
i
The motivation of this thesis is the development of simple microscopic-scale model
(representative elemental volume; REV) that can be used to conduct flow and heat transfer
simulations from which closure coefficients can be established for the volume-averaged
transport equations for porous media (packed bed). The thesis provides a brief introduction
to the computational technique adopted for the geometric generation of the REV (YADE),
followed by a parametric study undertaken to reveal the minimum number of particles
inside the REV that are required to mimic the appropriate physics. Additional analysis was
conducted with the goal of determining the influence of deviation in particle diameter. A
wide range of particle temperatures was considered for analyzing the convective heat
transfer and hydrodynamic behavior such the influence of property variation on
temperature could also be studied.
The key research output is a detailed comparison of the results related to the
hydrodynamics and heat transfer closures produced by an idealized, YADE-generated
model against a three-dimensional, digitized model of packed sand. It is shown that the
YADE model gives results that are in very good agreement with the digitized packed-sand
model in the range of Reynolds numbers considered. The YADE model results were then
compared with experimental findings and it was found that while the trends in convective
heat transfer were well-predicted, there was a difference in the magnitude of the convective
coefficients predicted and measured in previous experiments.
Keywords
Heat transfer, CFD, Digitized image, Numerical modelling, Low Reynolds number, Pore
ii
I would like to thank my supervisor Dr. Anthony Straatman for his support, guidance, and
advice with the encouragement to succeed.
I would like to thank OGS for providing me with the financial support to successfully
conduct my research, and enhance my educational experience. Without your assistance,
this project would not have been possible.
To my colleagues in the Computational Fluid Dynamics Lab, I am very grateful to have
spent the last two years working with you and for the assistance you have provided me.
This includes; Nolan Dyck and Mahmoud Elhalwagy. I am also thankful for the help of
Marco Zanoni for providing the experimental results in addition to valuable advice and
information, and Ian Molnar for the raw file of the digitized image.
Finally, I would like to sincerely thank my family and friends. Your support and
iii
Abstract ... i
Acknowledgments... ii
Table of Contents ... iii
List of Tables ... vi
List of Figures ... vii
List of Appendices ... xi
Chapter 1 ... 1
1 Introduction ... 1
1.1 Background information about porous media... 1
1.2 Heat transfer and hydrodynamics in porous media (volume-averaging) ... 4
1.3 General objective and approach to the problem ... 10
1.4 Thesis outline ... 11
Chapter 2 ... 13
2 Literature Review ... 13
2.1 Smouldering in porous media ... 13
2.2 Modelling porous media ... 15
2.3 Packed beds of particles ... 18
2.4 Project scope and summary ... 23
Chapter 3 ... 25
3 Transport Equations in Porous Media ... 25
3.1 Pore-level (Microscopic) governing equations ... 25
3.2 Volume-averaging energy equations ... 26
3.2.1 Mass and Momentum ... 26
iv
3.2.2.2 Fluid energy equation ... 31
3.3 Summary ... 33
Chapter 4 ... 34
4 Microscopic CFD Analysis ... 34
4.1 Transport equations closure using CFD approach ... 34
4.2 Fundamentals of geometric modelling (CFD-YADE) ... 37
4.2.1 Minimum number of particles ... 40
4.2.2 Sphere diameter deviation... 41
4.3 Segmented image of sand ... 42
4.3.1 Imaging, reconstruction and segmentation ... 43
4.3.2 Image post-processing ... 43
4.3.3 Building a REV counterpart to digitized image ... 45
4.3.4 Results and discussion ... 48
4.4 Validation of YADE REV against experimental results... 50
4.5 Summary ... 57
Chapter 5 ... 58
5 Column of Packed Bed of Sand ... 58
5.1 Experimental setup... 58
5.2 Numerical modelling ... 60
5.3 Results and discussion ... 63
5.4 Summary ... 65
Chapter 6 ... 66
6 Summary ... 66
v
6.3 Future work ... 68
6.3.1 Recommendations for further investigation ... 71
References ... 72
Appendix A: Derivation of the interfacial heat transfer closure ... 76
Appendix B: Air property versus temperature variation (K) ... 78
vi
Table 4.1: Physical properties of the studied case. ... 38
Table 4.2: Grid independence of normalized properties for the studied case. ... 39
Table 4.3: Geometric properties for the digitized image [19]. ... 43
Table 4.4: Constant coefficient of Eq. 4.11. These coefficients were produced using
variable thermodynamic properties of air. ... 55
Table 5.1: Initial and boundary conditions for 80 L/min airflow. ... 61
vii
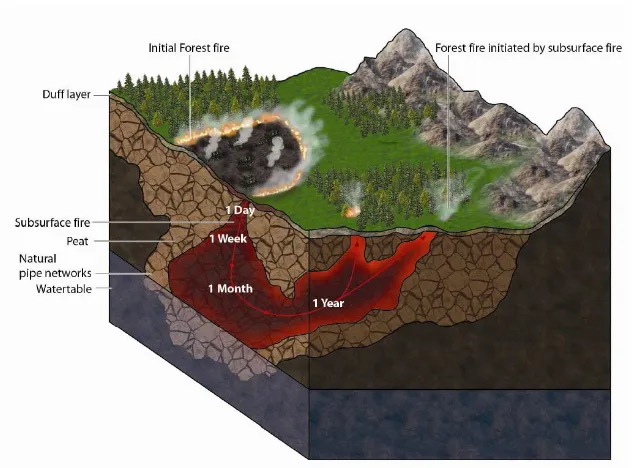
Figure 1.1: Image of a subsurface smouldering wildland fire. Fire initiated at the surface
propagates in the ground and re-emerges months later [14]. ... 5
Figure 1.2: In situ treatment of contaminated soil. Schematic diagram of STAR
components as a remediation solution [16] . ... 6
Figure 1.3: Illustration of an arbitrary porous medium containing fluid and solid volumes
based on a volume-averaged method. ... 7
Figure 2.1: Forward and opposed types of smouldering. Airflow direction versus the
smouldering combustion propagation [14]. ... 14
Figure 2.2: Schematic of the classification of flows through porous media [31]. Reproduced
Data. ... 17
Figure 2.3: CAD images showing the unit-cube model. (a) A single unit-cube with
spherical void, and (b) A pore block containing interconnected pores [37]. ... 19
Figure 2.4: Cubic box and spheres for simple cubic packing [38]. ... 19
Figure 2.5: Approximate schematic of ranges of dimensionless numbers covered by
experiments reviewed and reported in Wakao and Kaguei [44]. ... 22
Figure 2.6: Heat transfer data from steady-state experiments [40]. ... 22
Figure 2.7: Data from the published literature: Shaded area represents the experimental
findings of 22 studies [45]. Reproduced Data. ... 24
Figure 3.1: Possible modes of heat transfer in porous media. ... 26
Figure 3.2: Schematic diagram of a representative elemental volume (REV). ... 28
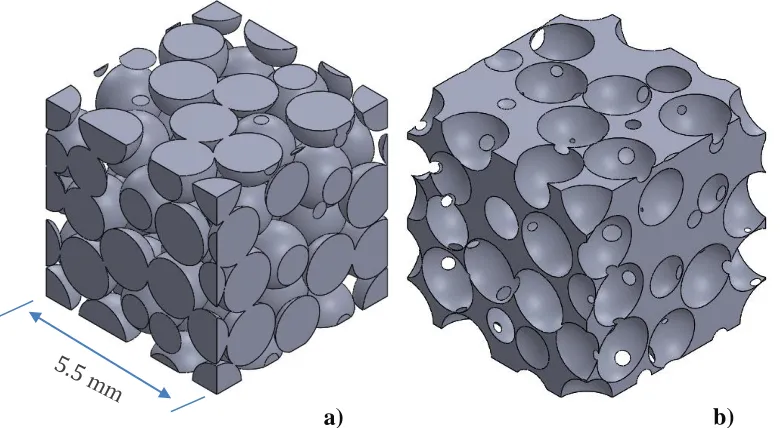
Figure 4.1: (a) Proposed REV of a packed bed of particles (spheres), and (b) Geometric
viii
Figure 4.3: Nusselt number versus different number of particles at different diameter
deviations. ... 41
Figure 4.4: Nusselt number as a function of total variation of particle diameter ... 42
Figure 4.5: a) Scanned image of sand, and b) Mid-plane cut-out of the image [19].
Reproduced image. ... 44
Figure 4.6: Image REV composed of sand and surrounded fluid (air). ... 44
Figure 4.7: (a) 3D mesh of digitized image adjusted by adding extra length at the image
exit, and (b) Cut-out at the mid-plane parallel to the flow without the extended length. . 45
Figure 4.8: YADE model is comprised of particles (spheres) bounded by cubic lines. Ghost
spheres represent periodic effect. ... 46
Figure 4.9: YADE REV of spherical particles with same geometric properties as digitized
image. ... 47
Figure 4.10: Mesh generated in ANSYS meshingTM Tool for the counterpart REV. ... 47
Figure 4.11: Velocity vector field of the digitized image at Re=10 and Pr=0.7. Extension
length has been added to mitigate the reversed flow effect. ... 48
Figure 4.12: Mid-plane distribution of fluid temperature variations for (a) Digitized image,
and (b) YADE REV. Red =10 and Tp=523K. ... 49
Figure 4.13: Comparison between REVs based on Nusselt number versus Reynolds
number at the temperature difference of particles (Tp) and inlet flow (Tin) equal to 25°C,
and Pr=0.7. ... 50
Figure 4.14: Comparison between REVs based on Pressure drops through the length (L) of
ix
Figure 4.16: Variation of Nusselt number with the ratio of surface-to-bulk temperature
using conventional methods of correlating heat transfer coefficients [64]. ... 53
Figure 4.17: Nusselt number (averaged temperature) variation with respect to Reynolds
number and solid temperature, and Pr=0.7. ... 54
Figure 4.18: Comparison between the simulated and correlated data applying Eq.4.11. See
Fig. 4.17 for more details about the simulated data. ... 55
Figure 4.19: Pressure drop versus particles temperature at different Reynolds numbers. 56
Figure 4.20: Variations of overall heat transfer efficiencies at different temperature of
particles. ... 57
Figure 5.1: Cross section diagram of experimental apparatus [20]. ... 59
Figure 5.2: Experimental temperature evolution versus time. It shows thermocouple
positions (x) from 0.120 to 0.505 m with 0.035 m intervals for 80 L/min [20]. ... 60
Figure 5.3: Experimental temperature evolution versus time. It shows thermocouple
positions (x) from 0.120 to 0.505 m with 0.035 m intervals. The solid curves represent the
experiments and the dotted curves represent the numerical results of solid constituent for
closures based on a) Eq. 4.11. b) Eq. 2.9. The flow is 80 L/min. ... 64
Figure 5.4: Experimental times (t) from 3840 to 9240 s with intervals of 1080 s
(temperature profile versus height of the column). Dotted lines represent the numerical
results of solid temperature and the solid lines represent the experiments. ... 65
Figure 6.1: YADE REV composed of (a) Clumps model of particles. (b) Ellipses. ... 69
Figure 6.2: REV of elliptical shape generated in Autodesk InventorTM. The REV has the
x
REVs are generated by YADE. ... 70
Figure 6.4: Comparison between REVs based on Pressure drop through the length (L) of
the REV. ... 70
xi
Appendix A: Derivation of the interfacial heat transfer closure ... 76
Appendix B: Air property versus temperature variation (K) ... 78
xii
LatinLetter
afs Specific interfacial surface area of porous media, m-1
Afs Interfacial surface area of porous media, m2
Cp Specific heat capacity, J kg-1 K-1
d Particle diameter, m
L length scale of porous medium or REV length, m
g Acceleration of gravity, m s-2
hfs Interstitial heat transfer coefficient between the solid and gas phases, W m-2 K-1
k Thermal conductivity, W m-1 K-1
𝑘𝑓𝑒 Effective conductivity of fluid phase, W m-1 K-1
𝑘𝑠𝑒 Effective conductivity of solid phase, W m-1 K-1
K Permeability of the medium, m2
CE Form drag coefficient for porous medium
P Pressure, Pa
R Specific gas constant of air, J kg-1 K-1
v Darcy velocity, m s-1
u Fluid velocity vector, m s-1
U Extrinsic velocity, m s-1
amb Ambient
m Mass, kg
𝑚̇ Mass flow rate, kg s-1
Tf Temperature of fluid constituent of porous media
xiii
Pf Fluid pressure
t time
th Heater on time
tf Final time
tb Blower time
Ra Rayleigh number
Re Reynolds number
Bi Biot number
Pr Prandtl number
𝐟 body force per unit mass, m s-2
𝑛 outward normal unit vector
< > Denotes extrinsic volume-average
< >f,s Denotes intrinsic volume-average to constituent f or s Greek symbols
ρ Density, kg m-3
μ Dynamic viscosity, Pa s
𝜈 Kinematic viscosity, m2 s-1
𝛼 Thermal diffusivity, m2 s-1
ϕ-𝜀 Porosity
𝜎 Stefan–Boltzmann constant, W m-2 K-4
𝛾 Overall heat transfer efficiency, W m-2 K-1 Pa-1
𝜑 Generic physical quantity
xiv
avg Average
cond Conduction
conv Convection
in Inlet
out Outlet
h Heater
b Blower
o Initial
w Wall
s Solid
f Fluid
eff Effective
disp dispersion
tor tortuosity
Abbreviations
LTE Local Thermal Equilibrium
LTNE Local Thermal Non-Equilibrium
REV Representative Element Volume
Chapter 1
1
Introduction
This thesis presents an advanced physics knowledge in sequential steps. It starts with an
introduction followed by a literature review of hydrodynamics and heat transfer closure in
packed beds of sand. The microscopic and macroscopic scale of porous material is then
discussed. The thesis highlights the background needed for building a project with the
ultimate goal of developing a geometric model for packed bed of sand.
1.1
Background information about porous media
Fundamental and applied research related to heat and mass transfer in porous media has
emphasized the significance of porous media in engineering applications. Growing interest
in this area has resulted in a substantial increase in the number of related studies published
in the literature. Significant progress has been made with respect to understanding the
behaviour of fluid flow and mass movement in permeable porous media, including other
important physical phenomena such as the exchange of energy and chemical reactions.
Porous media are heterogeneous materials composed of a solid microstructure (or matrix)
and a fluid that fills the space unoccupied by the matrix. The structure and the material of
the porous media play an important role in the physical behaviour of the media and in the
interaction of the matrix with the fluid phase [1]. Considering their usefulness in
applications including, for example, heat exchange, a full portrayal of their physical
properties is necessary so that they can be adequately modelled in conjunction with other
phenomena. The matrix can take a wide variety of forms, including packed beds of
particles, networks of interconnected ligaments, or interconnected spherical voids.
The specific type of porous structure affects the way in which the fluid flows through the
medium as well as the amount of the exposed internal area. For example, in enhanced heat
transfer applications, it is preferable for the fluid to be able to pass through the matrix
The wide variety of porous media applications are the result of the wide range of properties
exhibited by the materials. They can have very low conductivities for use in insulation or
very high conductivities for heat transfer applications such as heat sinks.
Prior to a discussion of the scope of this work, the following brief introduction summarizes
the most prominent developments in the understanding of porous media. The contributions
made to the general understanding of transport in porous media can be categorized as either
direct (e.g., Darcy and Carman) or indirect (e.g., Young and Fick).
The fundamental background reaches as far back as the 19th century. (In 1827 and 1845),
the Navier-Stokes momentum equations were presented and then widely applied for the
analysis of the hydrodynamics of porous media [2]. These equations are the foundation for
the modelling and analysis of fluid motion. Later, in 1855, Fick’s application law was
introduced for approximating the relation between the concentration gradient and the
diffusion flux applied in mass transport equations [3]. Another contribution was Darcy’s
empirical relation in 1856, which has been applied for flows through porous media when
the Reynolds number based on the pore size or particle diameter is small [4]:
−∇𝑃 = 𝜇
𝐾v (1.1)
where 𝑃 is the pressure, 𝐾 is the permeability of the porous media, 𝜇 is the dynamic
viscosity, and v is the vector of the average velocity.
Experimental evidence has demonstrated that, for numerous engineering applications, the
operation of flows in porous media characterized by high Reynolds numbers, such as
packed-bed reactors, is not fully described by Darcy’s law. For this reason, to fit the
experimental data, an additional nonlinear term, known as Forchheimer term, was
introduced in 1901 in order to correct the of effect of inertia [5]
−∇𝑃 = 𝜇
𝐾v + 𝐹ρ
where 𝜌 is the density. According to Ergun’s study (1952), the Forchheimer coefficient 𝐹
is given by 𝐹 = 𝑏/√𝑎𝜀3, since 𝑎 and 𝑏 are constants that parameterize the microscopic
geometry of the media [6].
Early in the last century, observations of simultaneous hydrodynamic dispersion and
molecular diffusion were reported by Griffith [7,8]. In addition, the semi-heuristic Carman
(1937) -Kozeny (1927) model of permeability described the permeability of packed beds
reasonably well.
𝐾 = 𝜀
3 𝑑2
𝑎(1 − 𝜀)2 (1.3)
where 𝜀 is the porosity of the porous media, 𝑑is the effective average diameter of a particle,
and 𝑎 is a constant for parameterizing the structure of the microscopic geometry of the
porous materials and takes the value 180 for spheres [7,9]. Muskat later introduced a
description of two-phase (one wetting and one nonwetting) flow in porous media by
incorporating an effective assessment of permeability for each phase [4]. Brinkman’s
modification of Darcy’s law and introduction of effective viscosity was published in 1948
[4]. Other early concepts include those presented by Gibbs’ in 1878: his thermodynamic
treatment of the interface between a liquid and its vapour included wetting phenomena,
and the introduction of surface adsorption energy and entropy [10].
The first correlation of a totally effective thermal conductivity tensor for a two-phase flow
in porous media was published by Weekman and Myers in 1965 [11] and a first
semi-empirical interfacial (porous-plain media) boundary condition was studied by Beavers and
Joseph in 1967 [12]. Constitutive equations for the diffusion of gases in porous media were
developed by Mason et al. in 1967 and by Slattery in 1970 [4]. More recently, the closure
of transport equations in porous media based on a volume-averaged method was derived
by Whitaker in 1997 [13]. The latter form is the one most often applied in studies of porous
media reported in literature [4]. (More information about the history of the exploration of
1.2
Heat transfer and hydrodynamics in porous media
(volume-averaging)
Applications involving fluid flow and heat transfer in porous materials are encountered in
numerous disciplines in science and engineering. For example, in chemical engineering,
transport in porous media is related to filtering and drying applications, packed bed
reactors, catalytic converters and fuel cells. In mechanical engineering, applications of
porous materials include evaporative cooling, insulation and heat sinks. Moreover, porous
media provide context for the study of groundwater flows and contaminant transport in
groundwater in the environmental sciences.
An important environmental application of porous media is connected with smouldering
combustion phenomenon. Smouldering combustion is characterized as an oxygen-limited
flameless form of combustion with a slow propagation rate and a relatively low
temperature. The phenomenon is extremely complex and includes heterogeneous chemical
reactions and the transport of heat, mass, and momentum, including multiple phases [14].
Researchers have increasingly turned their attention to the study of this phenomenon with
the goal of fully understanding and exploring the unknown mechanisms that characterize
multiple chemical reactions, and heat and mass transfer processes.
Motivation of the study of smouldering combustion has arisen primarily from the possible
economic and pollution-related impact of this phenomenon. In the USA, it has been
reported that an estimated 31,200 smouldering fires that occurred during 2001 caused
property losses of about US$400 million [14]. In Canada, since 1990, “wildland fires” have
consumed an average of 2.5 million hectares a year, especially during prolonged periods
of drought [15]. Such fires can smoulder underground all winter and then re-emerge at the
surface in the spring. Figure 1.1 illustrates this effect.
Over the last decade, fire prevention costs in Canada have risen from about $500 million
to $1 billion per year [15]. In China, subsurface fires caused by smouldering combustion
account for 2% to 3% of the annual world emission of atmospheric CO2. The statistics
always lead to consideration of the economic damage and losses, which can pave the way
Figure 1.1: Image of a subsurface smouldering wildland fire. Fire initiated at the
surface propagates in the ground and re-emerges months later [14].
also minimize their harmful effects on climate, the environment and human and animal
life. A second aspect that attracts the attention of researchers is the feasibility of using
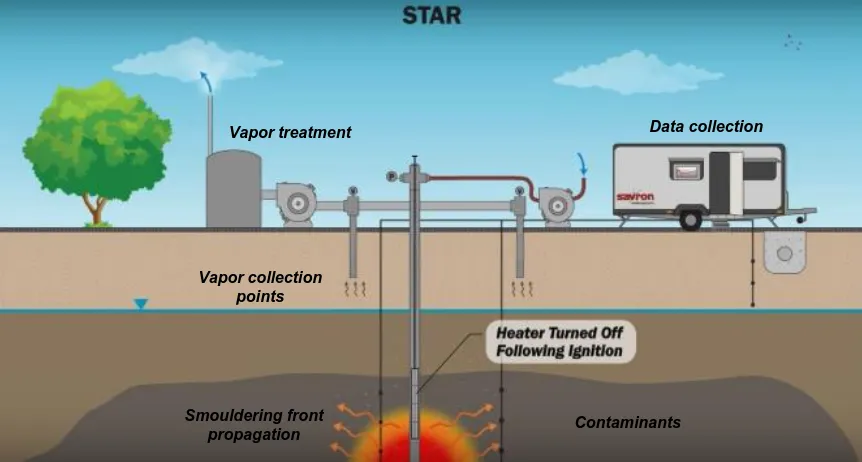
smouldering combustion as a remediation technique. A recent new application called
self-sustaining treatment for active remediation (STAR) has been developed based on in situ
thermal technology derived from smouldering combustion. Compared to currently
available techniques adapted for remediating groundwater and soil contamination, the new
technology is distinguished by its potential to achieve technical effectiveness, the
incorporation of a high rate of an instantaneous treatment, and the resultant substantial
savings in operation and maintenance costs.
The source of fuel for this technology is the underground contaminants that are ignited and
then oxidized using hot air, which is delivered through a well to the target zone. Following
ignition and provided a sufficient amount of ambient or combustion air is supplied, the
process is self-sustaining, without the need for external injected fuel [16]. Figure 1.2
Figure 1.2: In situ treatment of contaminated soil. Schematic diagram of STAR
components as a remediation solution [16] .
The relative complexity of analyzing and exploring smouldering combustion justifies
further research targeted at acquiring a better understanding of the phenomena. Achieving
this goal would ideally involve addressing and finding answers to important questions:
What are the transport equations that describe the phenomenon in physical terms? Can the
transport equations be simplified? What is the best discretization technique that should be
adopted? It should be emphasized here that a set of mass, momentum, energy, species, and
chemical reaction equations are required for describing the behaviour of a smouldering
combustion system. Due to the high temperatures generated from the chemical reactions,
local thermal non-equilibrium among the porous constituents must also be accounted for.
Thus, the closure form for the interfacial heat transfer between the fluid and solid
constituents of packed bed of sand was found to necessitate special treatment.
To answer the above questions, a model was constructed in an attempt to clarify the
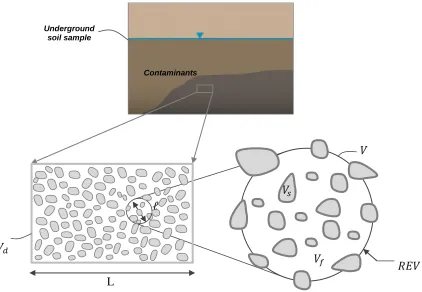
characterization steps inside a sample of a contaminated field (Figure 1.2). A portion of a
contaminated porous media zone depicted in Fig. 1.3 is considered for analysis. Assume
𝑉𝑑 is the space occupied by the porous medium with a length scale L, and let 𝑉 ⊂ 𝑉𝑑 define
the averaging volume having a length scale ℓ. However, 𝑉 must be considered arbitrary Vaporcollection
points
Data collection Vaportreatment
Contaminants Smouldering front
and large enough that the volume-average over a region is relatively insensitive to the
particular choice of 𝑉, which is considered to be a representative elemental volume (REV)
of the porous domain. The value of 𝑉 must nevertheless be chosen small enough that ℓ≪
L, ensuring that the average of a quantity does not vary significantly within 𝑉 and can be
considered as a constant in integral terms. The latter assumption is adopted to guarantee
the physical meaning of the averages in the model studied [13]. In this sense, a REV is a
conceptual space unit, which is the minimum volume that can be located anywhere inside
the porous medium (i.e., sand soil) within which measurable characteristics of the porous
medium become continuum quantities [7].
Two common approaches have been adopted for solving transport processes in the model
mentioned above. In the first approach, the equations for the porous media are solved at
the microscopic scale, which is characterized by the length scale of the particles. At this
scale, the space between the particles is discretized, and the transport equations are applied L
ℓ
𝑉𝑓
𝑉
𝑉𝑑
𝑉𝑠
Contaminants Underground
soil sample
𝑅𝐸𝑉
𝑉𝑠
Figure 1.3: Illustration of an arbitrary porous medium containing fluid
at their differential point and solved for the pore level forms. However, modelling the
problem requires relatively large computational resources. For the second approach, the
porous media can be treated as a continuum by adequately accounting for the role of each
phase in the equations that define the transport through the system of phases. The REVs of
the porous media are thereby scaled up to the macroscopic level, and the domain then
consists of both solid and fluid phases characterized by the use of parameters such as
porosity, permeability, and interfacial heat transfer to describe the transport through the
domain.
To explain more effectively the behaviour of a fluid inside porous materials, researchers
have adopted a variety of definitions of transport equations for describing the flow at the
macroscopic scale within porous media. A strategy of volume-averaged is now considered
the most appropriate technique for dealing with the behaviour of a fluid in porous media
[17]. This refers to the fact that a volume-averaged model is derived based on the general
transport conditions in the porous continuum. In this sense, it retains every required term,
including those that identify the gradients of volume-averaging, which are difficult to frame
in a traditional way.
The concept of a volume-averaging technique is that, for each element in the zone under
study, a normal average over a volume can be characterized by joining the averages of an
appropriate selection of points. Governing differentials that are transferred to
volume-averaged equations represent a means of upscaling the equations in order to take into
consideration the new arrangement of model behaviour so as to facilitate finding a solution
for the bulk flow and thermal fields.
Because a volume-averaging discretization does not result in closure, breaking down the
local transport variables according to those that are mainly volume-averaged and those that
represent spatial deviation becomes essential. Based on this division, the outcome from the
volume-averaging contains integral terms with spatial deviations that are related to the
pore-level flow. Since the derived volume-averaged equations are solved for the bulk flow,
spatial terms with deviation terms must be treated in a manner that seeks the final closure
The acquisition of closure models for volume-averaged equations is usually accomplished
using one of two methodologies. In the first, a semi-heuristic method replaces the
pore-level terms with appropriately chosen terms involving volume-averaged quantities derived
from empirical models. The second method entails the use of constitutive relations. In this
case, variables of volume-averaged deviations are mapped onto the pore level field. The
main reason for using pore-level solutions at that stage is to generate models for the
different cases studied at the volume-averaged level.
In this sense, the semi-heuristic method suggested by Vafai and Tien [7,18] achieved
closure for volume-averaged equations using well-known empirical relations. They
summarized the deviation terms in the volume-averaged momentum equation in order to
produce a body force term that acts on the fluid. This drag force is due to the interaction
between the fluid and solid constituent and was modified to a higher form of Darcy’s law.
The proposed closure of the parameters for the momentum equation thus comprises the
permeability and form drag coefficients. One of the important reasons for deriving the
volume-averaged momentum equation is related to the presence of a viscous force between
the layers of the bulk fluid. In cases in which this force is neglected, the model reduces to
the well-known Darcy’s law.
With respect to the energy equation, the same strategy is adopted as with the momentum
equation. For example, Vafai and Tien [7] proposed a new effective heat flux vector
characterized by an empirical effective conductivity term that includes an important
bulk-scale thermal effect due to the impact of dispersion. This phenomenon is considered in the
macroscopic volume-averaged bulk flow, representing the extra transport of thermal
energy that is a result of pore-level mixing. This can be simplified as an enhanced mixing
effect similar to the turbulent mixing phenomena. The effect of instability in a turbulent
flow caused by both small and large eddies can be mapped in the same way when the
irregular flow inside the structure of the porous medium is obvious. In this context, this
effect should be considered, especially for flows with a high Péclet number, in which the
impact of dispersion dominates by orders of magnitude compared to that of macroscopic
In this work, the primary consideration was the closure forms of the equations that express
the conservation of energy and momentum in a packed bed of sand. These forms
encapsulate the mutual effect between both solid and fluid constituents of porous media
and should be thoroughly analyzed. For this reason, a complete analysis for different cases
of REV geometries will be carried out.
The second goal of the research was to upscale the study toward a macroscopic (porous
continuum) level. To this end, a one-dimensional column of packed bed of sand was
employed to simulate an unsteady heat transfer case. In brief, this model is composed of
an air diffuser and heater element placed at the bottom of a column of sand. The column
measures about 0.505 m in height and 0.162 m in diameter. A portion of the packed-sand
column is initially specified as a determined temperature to mimic electrical heating. An
airflow is then imposed at the lower boundary of the column and the heating is stopped.
Both conduction and convection are active in the column during this transient process, and
thus the airflow causes a temperature pulse or wave to move through the column.
Additional information about the computations and the experiment to which the
computations are compared is provided in Chapter 5.
1.3
General objective and approach to the problem
The work presented in this thesis was motivated by recognition of the need for the
modelling of transport equations in porous media at low Reynolds number. The focus of
this work is the development of a simple microscopic (pore-level) geometric model that
can be used for establishing the closure coefficients for a macroscopic (porous continuum)
model. As the literature survey reveals, information about the hydrodynamic and thermal
transfer in regions with low Reynolds numbers is lacking.
With respect to the pore-level scale, a brief introduction of the Computational Fluid
Dynamics-Discrete Element Method (CFD-DEM) technique is given, followed by the
development of a geometrically idealized packed-sand model developed using YADE.
Detailed comparison of the YADE-based model is made to another model produced by
digitization of a three-dimensional packed bed of sand [19]. The commercial software
models. A parametric study is presented to establish the minimum required number of
particles inside the REV, the influence of deviation in particle diameter and the effect of
the temperature variation on the results. Chapter 4 provides additional details.
At the macroscopic (porous continuum) level, a model based on the non-equilibrium
volume-averaged transport equations is presented. Volume-averaged models have proven
to be a powerful method of modelling flow in porous media, however the derivation of the
closure form of these equations must be treated carefully to ensure accurate results.
Semi-heuristic closure models are presented herein, in which unknown terms are replaced with
heuristic models that mimic the aggregate processes on a volume-averaged scale. Closure
coefficients in these heuristic models, such as permeability and interfacial heat transfer, are
established from the pore-level computations on the REV models described above. The
volume-averaged equations are then solved for a one-dimensional case of a packed bed of
sand for a comparison with the results presented in [20].
1.4
Thesis outline
The following chapters in this thesis outline the framework for modelling and analyzing
transport in porous media with complex porous domain geometries and the application of
a volume-averaged method in a relevant application of packed beds of sand.
The contents of the chapters are as follows:
Chapter 2:
Provides a brief review of the literature related to smouldering combustion, the
discretization method used for transport equations, and the microscopic closure of
transport equations for packed beds of spheres including the REV development for
pore-level study. The review highlights the work that has already been conducted
as well as knowledge gaps that remain.
Chapter 3:
Describes the derivation of the volume-averaged model used for simulating heat
exchange between air and sand in a packed bed based. The model incorporates the
Chapter 4:
Presents pore-level simulations on the YADE and digital REVs for the purpose of
comparing the two geometric models. The application of CFD-DEM technique
based on YADE software [21] in order to generate REVs is detailed along with
parametric study of the REVs.
Chapter 5:
Outlines the solution of the volume-averaged transport equations as a means of
comparing the numerical model results with experimental ones. The effects of the
generated correlation on the experiment of sand column are examined, and the
simulation results that prove the validity of the developed model are presented and
discussed.
Chapter 6:
Summarizes the work and its contributions, and lists recommendations for future
Chapter 2
2
Literature Review
This chapter provides a review of the literature related to smouldering combustion, the
modelling of porous media, and packed beds of particles. The scope of the work undertaken
for this thesis is also explained. With the goal of examining the smouldering combustion
phenomenon as a pathway to soil remediation, it was determined that a brief survey of this
field would provide a global picture that would help advance progress toward a final robust
model and that knowledge of the most recent progress reported in the literature would
enrich and enhance an understanding of this phenomenon. Following this brief survey, the
literature related to the porous media was explored, and the most suitable governing and
discretization method was investigated in an effort to identify the most accurate numerical
model. The results of these areas of the literature review are provided here, along with
discussion of packed bed of spheres (sand) as a matrix of porous media, including details
of REV development for pore-level study and cases involving the most popular correlations
between fluid and solid constituents.
2.1
Smouldering in porous media
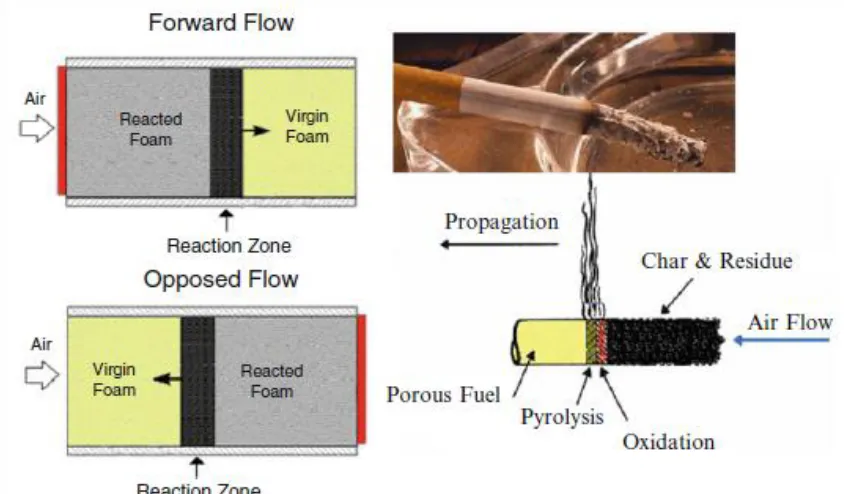
Smouldering is generally classified as either forward smouldering in which the reaction
zone propagates in the same direction as the oxidizer flow, or opposed smouldering in
which the reaction zone propagates in a direction that opposes that of the oxidizer flow
(Figure 2.1). Opposed smouldering is considered a more common fire initiation scenario
[22]. In the literature, forward smouldering has received relatively little attention, although
a number of experimental and theoretical studies can be found that address multiple
scenarios. Schult et al. [23] employed asymptotic methods for investigating smouldering
wave solutions that have two different structures: a reaction leading wave structure, when
the velocity of the combustion layer exceeds that of the heat transfer layer, and a reaction
trailing wave structure produced when the combustion layer is slower than the heat transfer
layer. A reaction leading wave structure occurs when the incoming oxygen concentration
Figure 2.1: Forward and opposed types of smouldering. Airflow direction versus the
smouldering combustion propagation [14].
variety of experimental observations of forward smouldering; however, in their modelling,
they assumed a local temperature equilibrium. Leach et al. [22] developed an advanced
model based on local chemical and temperature non-equilibrium between a solid and a gas,
although they neglected the pressure drop across the pile, which meant that the
conservation of momentum equation was not solved.
Ohlemiller presented independent energy equations for the gas and solid phases based on
the smouldering of cellulose [24]. With respect to forward smouldering, Summerfield et
al. [25] also assumed a thermal non-equilibrium. Fatehi and Kaviany [26] incorporated
some forms of chemical non-equilibrium in their examination of reverse smouldering.
Chen et al. [27] recently implemented a new one-dimensional model that considers the
drying process and the mass transfer mechanism of vapour. They took into account the
boundary layer effect on oxygen diffusion process, which influences the combustion rate.
However, a local thermal equilibrium and only one kinetic reaction were assumed. Fang et
al. had previously solved the same model numerically assuming only two elements, char
earlier one-dimensional simulations of smouldering combustion is that they cannot directly
model the heat loss to the external environment in the perpendicular direction, as occurs in
actual experiments [29]. Most previous studies modelled solid materials (porous matrix)
exclusively. In contrast, no numerical investigations of a non-aqueous phase liquid (NAPL)
as a fraction of the fluid constituent of porous media have been reported in the literature.
A few recent attempts have been made to track a smouldering front, but these studies began
to appear few years ago.
It was evident that appropriate modelling of the smouldering combustion phenomenon in
porous media necessitated the building of a mathematical model of the corresponding
physical properties associated with correct assumptions, followed by the development of
an appropriate numerical model.
2.2
Modelling porous media
In general, porous media applications are widespread in the areas of chemical,
environmental, mechanical and petroleum engineering. Such applications involve porous
media of varied types and characteristic lengths. Examples include catalytic and inert
packed bed reactors, contamination migration in groundwater, single and two-phase
transpiration cooling, and enhanced oil production [4].
Porous media are generally heterogeneous materials that involve a solid structure
framework and a fluid that fills the surrounding space. Of particular interest are
applications involving heat transfer in porous media, in which the connectivity of the
interconnected pore structure allows the fluid to penetrate around the solid constituent of
the porous matrix. For example, literature reports commonly discuss a cooling application,
whereby a cold fluid passing through a porous matrix removes a significant amount of heat
generated at the hot surface of the solid constituent to which the porous material is
connected [4,30]. The mechanism involved is similar to that in traditional heat sinks;
however, the effective surface area in the porous materials is often several orders of
magnitude greater [4]. It was found that the larger the exposed surface area of the solid
constituent, the more heat transfer energy can be extracted, which means that multiple
applications, rather than only a sensible heat mechanism being addressed, latent heat is also
considered, provided phase change occurs.
For accurate estimates of heat and mass transfer, complete description of the physical
properties of the porous materials are essential. For this reason, a goal of the work
conducted for this thesis was to explore the heat transfer phenomenon at low Reynolds
numbers for randomly packed beds of sand and this is an area that is currently weak with
respect to the modelling of smouldering.
The prediction of flow characteristics in porous media has been a topic of study for more
than a century. As previously mentioned, a notable discovery in this area originated with
Darcy, who was able to relate a drop in pressure to bulk velocity using an empirical
constant. Darcy’s law is given as
∆𝑃
𝐿 = −
𝜇
𝐾v (2.1)
where ∆𝑃 is the pressure difference across the length 𝐿.
The Darcy’s law equation expresses a linear relation between pressure and bulk velocity
and that is valid only in viscous dominated flows, where the Reynolds number is low. For
convective dominant flow, this equation is no longer valid and more advanced correlations
are needed. The correlated term in this expression is the permeability, and as given in
Eq. 2.1, this parameter is a measure of the resistance of the porous material to the fluid that
flows through it.
The Darcy equation alone is not valid for Reynolds numbers greater than ten, and an
alternative correlation is needed for accurately modelling the effect of a porous structure
on a flow (Figure 2.2) [31]. Ergun built an expression based on consideration of granular
solids, which is suitable for addressing higher Reynolds numbers by taking into account
both the porous matrix and the particles. Ergun’s equation contains a linear term similar to
the Darcy’s law equation, plus a quadratic term that accounts for the effects of inertia, but
is limited to porous media having a specific internal structure. For more advanced work,
structure: he used dimensional analysis to show that the quadratic term in Ergun’s equation
could be represented in terms of the dynamic pressure, the square-root of the permeability,
and a drag coefficient [32]. The new expression is known as a form drag.
The volume-averaging method, developed independently by both Whitaker [33] and
Slattery [34], is a method for modelling flow and energy transport in porous media. These
transport equations are applicable in complicated regions, because they are developed from
the transport equations for a single constituent continuum and therefore contain all relevant
terms that resolve the gradients. The idea behind this method is to solve transport equations
that are integrated over a representative volume, resolving the bulk flow. This method can
also be extended to all transport equations, such as those for mass fraction and thermal
fields, for which Whitaker used volume-averaging in order to find closure for the physical
processes [13]. It is important to note that volume-averaging does not primarily present a
closed form of transport equations; instead, it contains integral terms based on the
microscopic level. Consequently, at the macroscopic level, the bulk flow solution must
provide these terms. It has been stated that a closure form can be achieved by either of two
methods: 1) the use of constitutive equations when an examination of flow at the pore scale
Figure 2.2: Schematic of the classification of flows through porous media [31].
Reproduced Data.
10 100 1000 10000 100000 1000000
0.01 0.1 1 10 100 1000
F
an
n
in
g f
rict
ion
f
ac
tor
, f
Re
Darcy Law is valid Darcy Law is not valid
is needed and 2) a semi-heuristic method that replaces the integral terms with terms that
relate to the volume-averaged parameters often derived from empirical relations such as
the Darcy or Ergun equations in the momentum equation. This work uses a semi-heuristic
form of closure to represent the final form of the volume-averaged equations.
2.3
Packed beds of particles
A packed bed is a heterogeneous system composed of solid particles and a fluid flowing in
the interstitial space among the particles. Because of its heterogeneity and complexity, a
packed bed has not been the subject of exact, fully detailed simulation theory. However,
instead of an exact theory, a rather conventional and more realistic approach has often been
employed. A typical example is the assumption that a packed bed can be treated as a series
of mixing cells with multiple particles in each cell. This idea governs the volume-averaging
of a packed bed of particles.
Over the past four decades, a series of articles has been published concerning the decrease
in particle-to-fluid heat and mass transfer coefficients with a decreasing flow rate at a low
Reynolds number. In fact, this behaviour had been observed experimentally by a number
of investigators, each of whom arrived at different correlations. The importance of careful
analysis in the work presented in this thesis was thus evident.
The goal of studying a representative element volume (REV) for a packed bed at the
microscopic scale is to eliminate the necessity of modelling the problem at the full scale of
the particles, thus clearly and significantly reducing the computational time required.
However, using this approach requires that detailed information about the pore-level
structure and flow field be determined and provided via physical models that characterize
the porous region [35].
The approach of developing a REV for pore-level study has been used recently in heat
transfer enhancement studies using porous media. Yu et al. proposed a unit-cube geometry
model that is based on interconnected sphere-centered cubes, called unit-cube in order to
characterize the internal structure of graphitic foam, [36] (See Fig. 2.3). They studied the
Karimian and Straatman [37]. They derived a semi-heuristic closures based on the
simulation results of heat transfer and hydrostatics in unit cubic.
Figure 2.3: CAD images showing the unit-cube model. (a) A single unit-cube with
spherical void, and (b) A pore block containing interconnected pores [37].
Another study of a simple cubic packing, shown in Fig. 2.4, has been used to build a
channel of large number of particles [38,39]. As a result, heat transfer and pressure drop
have been studied in a structured packed bed. They conducted different experiments,
studied the forced convective heat transfer in order to generate a heat transfer correlation,
and finally compared their results to other studies. More recently, researchers have
increasingly turned their attention to the idea of building beds of randomly-packed particles
numerically-generated that are based on different shapes and assumptions.
Figure 2.4: Cubic box and spheres for simple cubic packing [38].
Fluid-to-particle heat transfer correlation received extensive attention in the last century,
primarily during the 1970s. These empirical correlations showed that the heat transfer
coefficient is dependent on the porosity, particle size, and shape of the packed bed as well
as on the Prandtl number of the fluid and the Reynolds number derived from the range of
the particle diameters [7].
Dimensionless analysis of the problem suggests that the thermal boundary layer of the
particles surrounded by a fluid at a specific temperature is a reflection of the dynamic
boundary layer. A more general correlation can be suggested, as follows:
Nu = a + c 𝑃𝑟𝑚𝑅𝑒𝑛 (2.2)
where Nu is the Nusselt number [30], and a, c, 𝑚, and 𝑛 are unknowns that require closure for
the conditions under consideration. In 1979, Wakao et al. published their well-known
correlation for packed bed of spheres, wherein the experimental data varied between 0.7 <
Pr < 1 and 15 < Re < 8500, and the particle diameters were of the order of 10 mm to 130
mm [7,40].
Nu =ℎ𝑠𝑓𝑑
𝑘𝑓 = 2 + 1.1 𝑃𝑟
1/3𝑅𝑒0.6 (2.3)
This correlation has been widely used in the studies of packed bed reported in the literature.
In this regard, it could be extended with certain margin of error to include consideration of
low Reynolds numbers or of particles with small diameters or geometric shapes other than
spheres. In 1982, Kar and Dybbs [41] developed another correlation
Nu = 0.004 (𝑑𝑣 𝑑𝑝)
0.35
𝑃𝑟1/3𝑅𝑒1.35 (2.4)
where 𝑑𝑣 = 4𝜀/𝑎𝑠𝑓 is the average void diameter, and 𝑑𝑝 is the particle diameter. This correlation
is valid for Re < 75, but it underestimates the interfacial heat transfer at low Reynolds
numbers. In the literature, different categories of correction for turbulent and laminar
zones, structured and unstructured particles, and foam and packed beds have been
employed to characterize the final formula. In this respect, it is common to have different
formulas such that the coefficient a of Eq. 2.2 is nullified for cellular materials [42]:
Another option is for the second term 𝑃𝑟𝑚𝑅𝑒𝑛 of the same equation to be multiplied by the porosity
(𝜀) for spherical particles whose porosity is within the range of 0.7 < 𝜀 < 0.95 [43].
Nu = 0.07 ( 𝜀
1 − 𝜀) 2/3
(𝑅𝑒𝑃𝑟) (2.6)
The studies published in the literature are significantly lacking in information beyond some
specific zones of Reynolds and Prandtl numbers. Figure 2.5 depicts this distribution of the
available data, which highlights the necessity of filling the knowledge gap. It is clear that
between Prandtl (Pr) or Schmidt (Sc) numbers of 1 and 120, no details concerning heat or
mass transfer behavior are available. The Prandtl number is the ratio of the kinematic
viscosity (also referred to as the momentum diffusivity), 𝜈, to the thermal diffusivity 𝛼. It
provides a measure of the relative effectiveness of momentum and energy transport by
diffusion in the velocity and thermal boundary layers, respectively [30]:
Pr = 𝜈
𝛼 (2.7)
The Schmidt number is the ratio of the momentum diffusivity, 𝜈, and the mass diffusivity,
𝐷. It provides a measure of the relative effectiveness of momentum and mass transport by
diffusion in the velocity and concentration boundary layers, respectively [30]:
Sc = 𝜈
𝐷 (2.8)
For Reynolds number less than 20, a small amount of information is available and is
associated with a high degree of uncertainty. Figure 2.6 provides a graph representing the
well-known correlation developed by Wakao et al. as in Eq. 2.3. The figure includes the
results of a variety of experiments based on multiple assumptions about unstructured
packed beds of particles. Recently, a new study based on experimental analysis described
the heat transfer for small size of particles and a correlation has been developed as [20]
Nu = 0.001 𝑅𝑒1.97 𝑃𝑟1/3 (2.9)
It must be noted that although the flow and heat transfer performance of randomly packed
Figure 2.5: Approximate schematic of ranges of dimensionless numbers covered by
experiments reviewed and reported in Wakao and Kaguei [44].
Figure 2.6: Heat transfer data from steady-state experiments [40].
than those in other forms of packed beds [39], which can significantly lower the overall
heat transfer performance. One remedy for this effect is to construct a structured packed 0.1
1 10 100 1000 10000 100000
0.1 1 10 100 1000 10000
P
r
or
S
c
bed of particles, thereby achieving a notable reduction in the pressure drop and observable
improvement in heat transfer performance.
Researchers have studied the relation governing heat transfer between the fluidizing gas
and the bed of particles. Coefficients for the entire bed have been evaluated through the
use of different types of experiments conducted in order to test steady state and unsteady
state techniques.
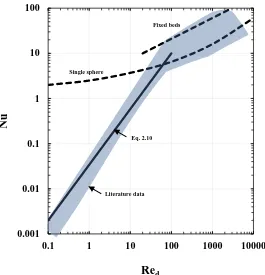
In Fig. 2.7, it can be seen that for 𝑅𝑒𝑝> 100, the Nusselt numbers fall between the values
for single particle and those for fixed beds [45]. For 𝑅𝑒𝑝< 10, the Nusselt number decreases
drastically when the 𝑅𝑒𝑝 decreases and has values far smaller than one. In the region of a
rapidly falling Nusselt number, the empirical expression of Kothari [46] fits all of the
reported data; thus
Nu = 0.03(𝑅𝑒𝑝)1.3 0.1 > 𝑅𝑒𝑝 > 100 (2.10)
2.4
Project scope and summary
The goal of this work was to complete a study of (spherical-phase) packed bed of sand in
order to address the gap evident in the literature with respect to low Reynolds numbers.
Achieving this goal entailed the creation of a general three-dimensional REV to be used
for obtaining the physical parameters of an arbitrary pore geometry. Analyzing transport
equations in porous media with multiple shapes of particles (porous domain geometries)
was then developed. The following specific steps in this overall goal were identified:
Construct a geometric model to represent at a microscopic level the corresponding physical problem, along with appropriate assumptions.
Derive the closure form for the volume-averaged momentum and energy equations
Figure 2.7: Data from the published literature: Shaded area represents the
experimental findings of 22 studies [45]. Reproduced Data.
Develop a suitable numerical model for computing fluid flow and heat transport in
porous media based on the finite-volume method, which incorporates robust and
accurate conditions that are effective for different flow speeds.
As stated earlier, an additional goal of this work was to extend the capability of an in-house
code to include unsteady conduction/convection heat transfer at a high temperature level
so that applications such as heat transfer combustion and two-phase reactions in packed
beds of particles can be simulated. Solving the fluid flow transport equations required the
unit-cell structure of porous media for which a finite volume approach was adopted similar
to that used by Betchen et al. [47].
0.1 1 10 100 1000 10000
0.001 0.01 0.1 1 10 100
0.001 0.01 0.1 1 10 100
0.1 1 10 100 1000 10000
Nu
Red Eq. 2.10 Single sphere
Fixed beds
Chapter 3
3
Transport Equations in Porous Media
In this chapter, we start by defining the general pore level transport equations followed by
the volume-averaged technique applied in the macroscale of porous media. Afterwards, we
introduce the closure forms for both the momentum and energy equations for fluid and
solid constituents. All assumptions needed to close the energy equations based on local
thermal non-equilibrium method are shown later.
3.1
Pore-level (Microscopic) governing equations
At the pore-level scale, the flow and thermal behaviour is described by the standard mass,
momentum, and energy conservation equations. The mass and momentum equations for an
incompressible, Newtonian fluid with constant properties are given by
∇. u = 0 (3.1)
and
𝜌𝑓(𝜕𝑢
𝜕𝑡 + u. ∇u) = −∇p + 𝜇𝑓∇
2𝑢 (3.2)
Under the same assumption, the energy equations for the fluid and solid phases are given
as
𝜌𝑓𝑐𝑝,𝑓( 𝜕𝑇𝑓
𝜕𝑡 + u. ∇𝑇𝑓) = 𝑘𝑓∇ 2𝑇
𝑓 (3.3)
and
𝜌𝑠𝑐𝑝,𝑠𝜕𝑇𝑠
𝜕𝑡 = 𝑘𝑠∇ 2𝑇
𝑠 (3.4)
Eqs. 3.1-3.4 are used to compute the pore-level flow and temperature fields, and are the
starting point from which the volume-averaged equations are to be derived. It was also
3.2
Volume-averaging energy equations
The following assumptions are considered:
I. Transient flow.
II. Laminar and incompressible flow.
III. Uniform properties and porosity of porous media. IV. The local thermal non-equilibrium (LTNE) method.
3.2.1
Mass and Momentum
The local volume-averaging study of problems involving heat and/or mass transfer, and
chemical reactions in porous media requires the treatment of fluid flow, mass and heat
transfer simultaneously. In most cases, the concept of local thermal non-equilibrium is
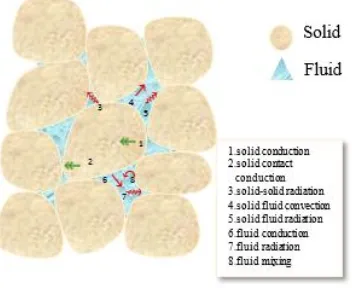
assumed in the heat and mass transfer equations. Figure 3.1 shows various possible types
of thermal transport inside a REV [13,48].
Figure 3.1: Possible modes of heat transfer in porous media.
In the porous continuum region, volume-averaged forms of the transport equations are
used. In this context, transport equations are integrated over a representative elemental
volume (REV) of a porous media. Volume-averaging integration is adopted at the studied
zone, where there exists a volume-averaged value of a quantity 〈𝜑𝑓〉 defined by the
following expression:
〈𝜑𝑓〉 = 1
where, 𝑉 is the volume over which the averaging is carried out, 𝑉𝑓 is the fluid volume inside
𝑉, and 〈𝜑𝑓〉 is the extrinsic-averaged (superficial) quantity of 𝜑𝑓. Similarly, an
intrinsic-averaged quantity 〈𝜑𝑓〉𝑓 can be defined by introducing the porosity 𝜀 as [7,13]
〈𝜑𝑓〉𝑓= 〈𝜑𝑓〉
𝜀 (3.6)
Another important definition is the spatial averaging theorem, which is defined as [7,13]
〈∇𝜑〉 = ∇. 〈𝜑〉 + ∫ 𝑛 𝜑 𝐴𝑓𝑠
𝑑𝑎 (3.7)
where 𝐴𝑓𝑠 is the interfacial surface area of the REV within the averaging volume, and 𝑛 is
the unit vector normal to 𝐴𝑓𝑠. Volume-averaging the products of properties is applied by
decomposing a quantity into its intrinsic average and spatial deviation, and considering the
volume-averaging of the spatial deviation insignificant. This concept will be explained in
the following paragraphs.
The closure form of transport equations discussed later analyzes the pure fluid and solid
constituents without the presence of inherent fuel. At first, the general mass conservation
equation for the liquid or gas phases is [4,7,13,48]
𝜕 𝜕𝑡𝜀〈𝜌𝑓〉
𝑓+ ∇. (〈𝜌
𝑓〉𝑓〈u〉) = 〈𝑚̇〉𝑓 (3.8)
where 〈𝑚̇〉 represents the generation (source) or removal (sink) of mass per unit volume
per unit time for the gas and liquid phases. Momentum equation can be derived as [7,13]
𝜕〈𝜌𝑓〉𝑓〈u〉
𝜕𝑡 +
1
𝜀∇. (〈𝜌𝑓〉
𝑓〈u〉〈u〉)
= −𝜀∇〈𝑃〉𝑓+ 𝜇∇2〈u〉 + 𝜀〈𝜌
𝑓〉𝑓𝐟 − 𝜀 𝜇 𝐾〈u〉
− 𝜀〈𝜌𝑓〉 𝑓𝑐
𝐸
√𝐾 〈u〉|〈u〉|
The last two terms on the right-hand side of Eq. 3.9 (momentum) are the Darcy and
Forchheimer terms, respectively, that represent the viscous and form drag resulting from
the interaction between the solid and fluid-constituents in the porous media. Darcy term is
a result of the microscopic viscous shear stresses applied by the porous matrix to the fluid.
Forchheimer term is a representative of the microscopic inertial forces felt by the fluid as
a result of form drag. In this sense, we need to find the closure coefficients 𝐾 and 𝑐𝐸 in the
momentum equation. Theoretically, if the flow in the fluid-saturated porous domain takes
place with low velocity and 𝑅𝑒 = 𝜌v𝑑
𝜇 < 1, the modified Darcy flow model can be used,
and the momentum equation reduces to [49],
v = −𝐾
𝜇(∇𝑃 − 𝜌𝑔) (3.10)
where v is the fluid phase velocity vector, 𝑑 is the characteristic length, 𝜇 is the viscosity,
𝐾 is the permeability, and 𝑔 is the gravity vector. A gas equation that governs the relation
between the thermo-physical properties of air within the domain is
𝜌 = 𝑃
𝑅𝑇 (3.11)
where 𝜌 in the fluid density, 𝑃 is the static pressure, 𝑅 is the fluid constant and 𝑇 is the
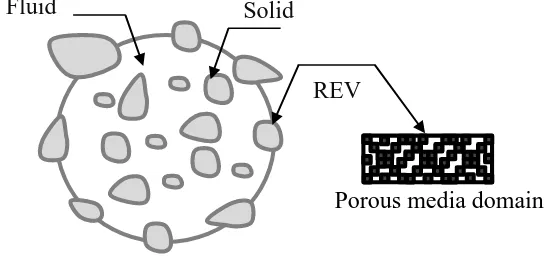
fluid temperature. The macroscopic governing equations for the transport of momentum
and energy in porous media are derived based on the volume averaging method indicated
by Nield and Bejan [9] and Whitaker [13]. As a result, a representative elemental volume
(REV) occupied by fluid and porous matrix is considered to generate the closure forms.
Figure 3.2 represents an elementary volume.
Fluid Solid
REV
Porous media domain
3.2.2
Energy equations
3.2.2.1
Solid energy equation
For the solid energy, we start with two terms, the unsteady and the conduction.
𝜌𝑠𝐶𝑝,𝑠𝜕𝑇𝑠
𝜕𝑡 = ∇. (𝑘𝑠∇𝑇𝑠) (3.12)
By applying the volume average in the first term
〈𝜕𝑇𝑠 𝜕𝑡〉 = 𝑉𝑠 𝑉 𝜕 𝜕𝑡 1
𝑉𝑠 ∫ 𝑇𝑠𝑑𝑉 = (1 − 𝜀) 𝜕〈𝑇𝑠〉𝑠
𝜕𝑡 𝑉𝑠
(3.13)
and for the conduction term [13],
〈∇. 𝑘𝑠∇𝑇𝑠〉 = ∇. 〈𝑘𝑠∇𝑇𝑠〉 + 1 𝑉 ∫ 𝑛𝑠𝑓 . 𝐴𝑓𝑠 𝑘𝑠∇𝑇𝑠𝑑𝐴 = ∇. 𝑘𝑠〈∇𝑇𝑠〉 + 1 𝑉 ∫ 𝑛𝑠𝑓 . 𝐴𝑓𝑠 𝑘𝑠∇𝑇𝑠𝑑𝐴 (3.14) and [13]:
∇. 𝑘𝑠〈∇𝑇𝑠〉 = ∇. (𝑘𝑠∇((1 − 𝜀)〈𝑇𝑠〉𝑠) + 𝑘𝑠 1
𝑉 ∫ 𝑛𝑠𝑓 . 𝐴𝑓𝑠
𝑇𝑠𝑑𝐴) (3.15)
Note that the last term in Eq. 3.14 represents the interfacial heat transfer ℎ𝑠𝑓; in this sense,
it is gainful to close this term by using Newton heuristic cooling law [13].
1
𝑉 ∫ 𝑛𝑠𝑓 . 𝐴𝑓𝑠
𝑘𝑠∇𝑇𝑠𝑑𝐴 = −ℎ𝑓𝑠𝑎𝑓𝑠(〈𝑇𝑠〉𝑠− 〈𝑇
𝑓〉𝑓) (3.16)
𝑎𝑓𝑠 is the specific interfacial surface area and equal to 6(1 − 𝜀)/𝑑𝑝. 𝑑𝑝 is the particle
diameter [4]. In order to close the tortuosity term, we employ the spatial average-deviation
decomposition for simplification.
𝑇𝑜𝑟𝑡𝑢𝑜𝑠𝑖𝑡𝑦
1
𝑉 ∫ 𝑛𝑠𝑓 . 𝐴𝑓𝑠
𝑇𝑠𝑑𝐴 = 〈𝑇𝑠〉𝑠1
𝑉 ∫ 𝑛𝑠𝑓 . 𝐴𝑓𝑠
𝑑𝐴 +1
𝑉 ∫ 𝑛𝑠𝑓 . 𝑇̃𝑠 𝐴𝑓𝑠 𝑑𝐴 (3.17) 1 𝑉 ∫ 𝑛𝑠𝑓 . 𝐴𝑓𝑠
𝑇𝑠𝑑𝐴 = −∇𝜀〈𝑇𝑠〉𝑠+ 1
𝑉 ∫ 𝑛𝑠𝑓 . 𝑇̃𝑠 𝐴𝑓𝑠
𝑑𝐴 (3.18)
By neglecting the porosity variation, we arrive at
1
𝑉 ∫ 𝑛𝑠𝑓 . 𝑇𝑠 𝐴𝑓𝑠
𝑑𝐴 = 1
𝑉 ∫ 𝑛𝑠𝑓 . 𝑇̃𝑠 𝐴𝑓𝑠
𝑑𝐴 (3.19)
so the updated version of Eq. 3.14 is
〈∇. 𝑘𝑠∇𝑇𝑠〉 = ∇. ((1 − 𝜀)𝑘𝑠∇〈𝑇𝑠〉𝑠+ 𝑘𝑠 1 𝑉 ∫ 𝑛𝑠𝑓 . 𝐴𝑓𝑠 𝑇̃𝑠𝑑𝐴) − ℎ𝑓𝑠𝑎𝑓𝑠(〈𝑇𝑠〉𝑠− 〈𝑇 𝑓〉𝑓) (3.20)
In order to close the solid energy equation, the form adopted by Whitaker [13] and Kaviany
[4] is
𝑇̃𝑠 = 𝑏𝑠∇〈𝑇𝑠〉𝑠 (3.21)
𝑇̃𝑠 is the temperature deviation and 𝑏𝑠 is a constant. This leads to the following expression,
〈∇. 𝑘𝑠∇𝑇𝑠〉 = ∇. ((1 − 𝜀)𝑘𝑠∇〈𝑇𝑠〉𝑠+𝑘𝑠
![Figure 2.4: Cubic box and spheres for simple cubic packing [38].](https://thumb-us.123doks.com/thumbv2/123dok_us/1979660.1261539/34.612.202.447.125.254/figure-cubic-box-spheres-simple-cubic-packing.webp)