University of South Carolina
Scholar Commons
Theses and Dissertations
1-1-2013
Effect of Matrix Modulus On Cancer Stem Cells
and Tumorsphere Formation In
Three-Dimensional-Engineered Matrix
Samaneh Kamali SarvestaniUniversity of South Carolina
Follow this and additional works at:https://scholarcommons.sc.edu/etd Part of theChemical Engineering Commons
This Open Access Thesis is brought to you by Scholar Commons. It has been accepted for inclusion in Theses and Dissertations by an authorized administrator of Scholar Commons. For more information, please contactdillarda@mailbox.sc.edu.
Recommended Citation
A
T
HREE-D
IMENSIONAL-E
NGINEEREDM
ATRIX TOS
TUDY THEM
ICROENVIRONMENT OFC
ANCERS
TEMC
ELLSby
Samaneh Kamali Sarvestani
Bachelor of Science University of Tehran, 2007
Master of Science
University of South Carolina, 2013
Submitted in Partial Fulfillment of the Requirements
For the Degree of Doctor of Philosophy in
Chemical Engineering
College of Engineering and Computing
University of South Carolina
2014
Accepted by:
Esmaiel Jabbari, Major Professor
Melissa A. Moss, Committee Member
Francis Gadala-Maria, Committee Member
Tarek Shazly, Committee Member
ii
iii
D
EDICATIONTo my parents, for their endless love, support and encouragement
iv
A
CKNOWLEDGEMENTSI would like to express the sincere appreciation to my advisor Dr. Esmaiel Jabbari for his
guidance and support. Giving me the opportunity to perform this work is something that I
will always appreciate.
I would like to thank my committee members, Dr. Moss, Dr. Gadala and Dr. Shazly for
their support and presence in my defense session.
My gratitude also extends to my friends in our research group, Sina, Danial, Ozan,
Tahereh, Ramin and Leily for their continuous help through this process.
I owe my deepest gratitude to my family and my best friend. Your motivation and
v
A
BSTRACTMaintenance of cancer stem cells (CSCs) is regulated by their microenvironment. As
cancer cells are affected by many factors in their microenvironment, a major challenge is
to isolate the effect of a specific factor on CSCs while keeping other factors unchanged.
We developed a synthetic inert 3D Poly Ethylene Glycol Di-Acrylate (PEGDA) gel
culture system as a unique tool to study the effect of microenvironmental factors on CSCs
response. Synthetic hydrogels provide the flexibility to design three-dimensional (3D)
matrices to isolate and study individual factors in the tumor microenvironment.
The first objective of this work was to investigate the effect of physical properties of
microenvironment including modulus and geometry on maintenance of CSCs isolated of
4T1 (mouse breast cancer cell line), MCF7 and MDA-MB-231 (human Breast carcinoma
cells) HCT116 (Colon), AGS (Gastric) and U-2 OS (Bone) human cancer cell lines in an
inert microenvironment. We have shown that the gel elastic modulus had a strong effect
on tumorsphere formation. CSCs formed in the inert PEGDA gel keep their stemness
within certain ranges of gel stiffness. Briefly, mouse and human breast cancer cells
encapsulated in the gel with approximate modulus of 5 kPa formed the largest and
highest density of tumorspheres with highest expression of breast CSC markers.The
highest number, diameter and CSC marker expression of HCT116 and AGS spheroids
were observed in 25 kPa where it occurred at an optimum modulus of 50 kPa for U-2 OS
vi
We have also shown that geometry and spatial properties of ECM can significantly affect
the proliferation rate and size of tumorspheres formed by MDA-MB-231 cells in PEGDA
micropatternedhydrogesl. Weintroduced a 3D culture system as a model that controls the
uniformity, size and proliferation of tumorspheres.
As thesecondary objective,we investigated the effect of ECM composition on CSCs
maintenance by using ECM-derived cell binding peptides active in malignancy. CD44
binding peptide (CD44bp), Integrin binding peptides (Ibps) and Heparin binding peptides
(Hbps) were conjugated to the gel or dissolved in polymer solution to study their effect
on the maintenance of CSCs.
We have shown that peptides derived from ECM proteins with different mechanisms of
action can influence the microenvironment and cancer cells functions by either promotion
or abolition of the spheroid forming ability in the inert 3D PEGDA hydrogel cell culture
system. Conjugation of CD44bp and Ibps to the gel inhibited tumorsphere formation in
vitro and in vivo where Hbps enhanced tumorsphere formation and CSCs marker
vii
T
ABLE OFC
ONTENTSDEDICATION ... iii
ACKNOWLEDGEMENTS ... iv
ABSTRACT ... v
LISTOF FIGURES ... viii
CHAPTER 1, INTRODUCTION ... 1
CHAPTER 2, MATERIALSAND METHODS ... 12
CHAPTER 3, RESULTSAND DISCUSSION ... 23
CHAPTER 4, CONCLUSION ... 85
viii
L
IST OFF
IGURESFigure 3.1 Evolution of tumorsphere formation in different number densities ... 27
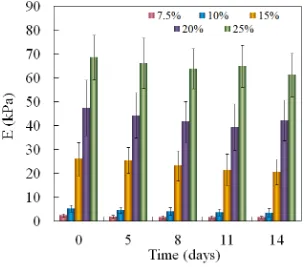
Figure 3.2 Effect of macromer concentration on elastic modulus of 4T1-cell-loaded PEGDA hydrogels with incubation time ... 28
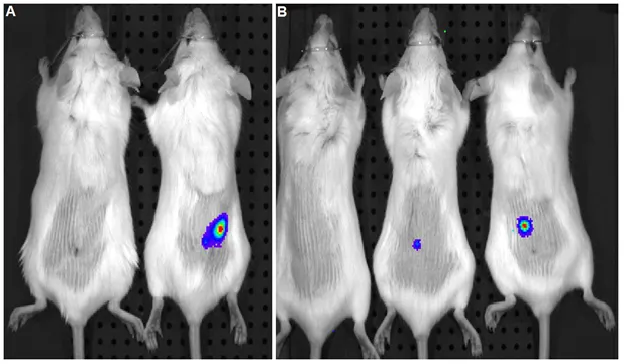
Figure 3.3 Comparing in vivo tumor formation of 4T1 cells from adhesion plates (A) with 4T1 cells from tumorspheres on ultralow-attachment plates (B)... 29
Figure 3.4 Live and dead image of 4T1 cells 2 days after encapsulation in PEGDA hydrogels with moduli of (A) 2 kPa, (B) 5 kPa, (C) 25kPa, and (D) 50 kPa ... 31
Figure 3.5 Evolution of tumorsphere formation by 4T1 tumor cells encapsulated in PEGDA hydrogels, as a function of incubation time. ... 32
Figure 3.6 Representative images of tumorsphere density for 4T1 cells encapsulated in PEGDA hydrogels with various elastic modulus after 8 days ... 34
Figure 3.7 Average tumorsphere size (A), tumorsphere size distribution (B), and cell count (C) for 4T1 tumor cells encapsulated in PEGDA hydrogels ... 35
Figure 3.8 BrdU staining of 4T1 tumorspheres formed in suspension culture on low-adhesion plates (A, C) and formed by encapsulation in PEGDA hydrogels (B, D). ... 38
Figure 3.9 Effect of gel elastic modulus on the relative mRNA expression levels of cancer stem cell markers of 4T1 cells in PEGDA hydrogels ... 39
Figure 3.10 Expression pattern of CD44 marker of 4T1 tumorspheres formed in suspension culture on low-adhesion plates and formed by encapsulation in PEGDA hydrogel ... 40
Figure 3.11 Evolution of tumorsphere formation by different tumor cell lines ... 41
Figure 3.12 Effect of gel elastic modulus on the relative mRNA expression levels ... 43
Figure 3.13 Effect of patterns size on tumorsphere formation ... 44
ix
Figure 3.15 Sphere formation and the effect of cell type encapsulated in PEGDA gel on the expression of CSC markers. .. ... 58
Figure 3.16 Viability of the cells encapsulated in PEGDA gel. ... 59
Figure 3.17 CSC population in the cells encapsulated in PEGDA gel. ... 60
Figure 3.18 Effect of CD44bp on tumorsphere formation and CSC marker expression..61
Figure 3.19 Effect of CD44bp conjugated to the gel on tumor formation in vivo. ... 64
Figure 3.20 Comparison of tumorsphere formation in PEGDA gels conjugated with CD44bp, Ibp, or FHbp ... 65
Figure 3.21 CSC population in cells encapsulated in PEGDA gel conjugated with CD44bp, Ibp, or FHbp. ... 66
Figure 3.22 Expression of the markers related to CSC maintenance in cells grown in the gel conjugated with CD44bp, Ibp, or FHbp……..……….…..67
Figure 3.23 Effect of CD44 binding peptide on tumorsphere formation by human tumor cell lines.……….…….…………..71
1
CHAPTER
1
1
1.1 BACKGROUND
Cancer is one of the main causes of death worldwide[1]. Itdevelops with
uncontrollablecell growth in a process, which may take several years. This process can
originate from any damage or mutation in genes.
Tumors are heterogeneous in their nature. It means that cells population in different
levels of differentiation and invasiveness coexists together.The resistance of high grade
tumors with none or poorly differentiated cancer cells to conventional cancer therapies
such as chemotherapy is the major challenge in cancer treatment. Cells in the high grade
tumors look abnormal, spread quickly and have high potential to relapse. Cancer stem
cells (CSCs) theory relates the aggression of high grade tumors to the high fraction of
CSCs with the ability of self-renewal and differentiation to all cell types in a tumor i.e.,
the triple negative breast cancer, one of the most aggressive types of breast cancer,
contains a high fraction of CSCs [2-4].
Cancer stem cells model relates this heterogeneity to the existence of Cancer Stem Cells
(CSCs) with the ability to give rise to all cell types in a tumor tissue and regenerating it.
Therefore, it is necessary to know the properties and mechanisms of action in CSCs to
find new ways in cancer treatment and prevention.
1.2 CANCER STEM CELLSMODEL
The body’s continuous cell turnover and tissue repair system is related to stem cells, a
small population of undifferentiated cells with unique potential of
1) Differentiation: the ability to give rise to different short-lived mature cell types of
2
2) Self-renewal: the ability to proliferate and make copies of themselves for long
periods of time
3) Homeostatic control: the ability to make a balance between differentiation and
self-renewal based on micro environmental stimuli and cues.
Stem cells categorizes in different groups based on their potential of differentiation. It
ranges from totipotent stem cells havingthe ability of differentiation to any cell type in an
organism to unipotent stem cells with the ability to differentiate to one cells type. Adult
Stem Cells have mostly defined as multipotent cells.They are able todevelop all cell types
of a specific organ. Stem cells can stay dormant and inactive for a long period. They start
their activity and division under certain physiological conditions. The fate of daughter
cells through cell division is strongly dependent on the microenvironmental signals and
cues. Daughter cells can keep their stemness properties and remain unspecialized or can
differentiate to specific cells with defined functions[5].
There is a specific microenvironment for stem cells of different tissues.This
microenvironment called stem cells niche consisting of neighboring cells and their
extracellular matrices helps stem cells to optimize their function and keep their unique
potential of self-renewal and differentiation. Various factors such as signals from proteins
and cytokines in extracellular matrix or physical interaction to surrounding stromal cells
cooperate to keep stem cells niche highly organized and inhibit the differentiation of stem
cells. Consequently, detachment of stem cells of their niche can cause stem cell to lose
their extraordinary potential. Outside their niche, they need sufficient intrinsic factors to
keep their stemness properties and avoid differentiation. Cancer can result from multiple
3
as the long-lived cells in many tissues can be good target for this transforming mutation.
Like normal tissues, tumors are composed of heterogeneous populations of cells in
different levels of differentiation.
Cancer cells in a tumor can be divided to different groups according to the expression of
specific surface markers. Being injected to appropriate host such as immune-deficient
mouse, tumorigenic capacity of each subset will be compared. Based on CSC model, only
a minority of cancer cells with specific surface markers (CSC subset) is able to form
tumors, whereas the majority of differentiated cells should not. Irrespective of the origin
of CSCs, they provide a hierarchical system with the unique potential to self-renew and
maintain tumor heterogeneity by giving rise to all different cell types of tumor. This
heterogeneity comes from the cancer stem cells ability of dividingasymmetrically and
giving rise to daughter cells which keepstemness properties of parental stem cellas well
as progenitor cells that lacks self-renewal property and have a tendency to differentiate to
other non-tumorigenic cancer cells forming the bulk of the tumor.
CSCs model has been verified in different tumor systems including breast and brain solid
tumors. The results showed that, in human breast cancers, only a small subsetof tumor
cells, defined as [CD44+ CD24−/low] comprising 11%–35% of total cancer cells has the
tumorigenicpotential to regenerate the whole tumor. In brain tumors, the stem cells
properties has been successfully applied to the specific subset of CD133+ cells which
usually include 5%–30% of total tumor cells. As expected this subset of CD133+ cells
was able to form the whole tumor tissue after injection [5]. It is not easy to isolate the
cancer stem cells in tumors. Recent progress in this way has introduced some new
4
normal stem cells. Implanting cells in immunedeficient mice at different cell doses can
assess the level of tumorigenicity of these isolated CSCs. Tumor initiating cells are
supposed to be able to develop tumors in low densities.
This hypothesis that cancer recurrence is related to the existence of cancer stem cells
(CSCs) with the ability of differentiation into multiple cell types and resistance to
conventional therapies comparing bulk tumor cells caused much effort to explore better
ways of treatment based on this subpopulation of tumor tissues.Although conventional
therapies such as chemotherapy or radiotherapy can kill differentiated,cancer cells but
they are not able to eradicate CSCs population. CSCs are slow in cell division and this
helps their resistance to chemotherapeutic drugs, which are more effective on rapidly
replicating differentiated cancer cells. They are also provided with some transmembrane
proteins such as ATP-binding cassette (ABC) transporters family known as drug
resistance proteins with the ability of pumping out the chemotherapeutic drugs and DNA
repairing agents. CSCs survive conventional therapies and cause relapse of tumor.
In regard of CSCs theory, tumor eradication will need specific agents to target CSCs
selectively without killing normal stem cells of the body. These agents and other similar
ways like enforcing CSCs to be differentiated to progenitor cells with more restricted
properties will ultimately result in CSCs elimination and tumor regression as well as
metastasis prevention. Some studies have focused on the possibility of identifying
specific markers that distinguish CSCs from the bulk of the tumor and normal stem cells
as well as specific agents that are able to discriminate between these markers and other
ones.One of these agents are inhibitory peptides which are short proteins used in clinical
5
comparison with novel developed toxic drugs and more efficient among different
methods of cancer therapy. Although peptides in comparison with proteins are more
specific, stable and bio-available in their nature, identifying effective peptide sequence
that can specifically target CSCs or induce their differentiation is still a main issue.
Among Bioactive peptides, only a few are therapeutically useful and show moderate
efficacy in cancer treatment. Using these peptides with conventional drugs reduce their
toxicity level and make them more selective for killing CSCs.
Direct interaction and inhibitory effect of some peptides on protein markers has drawn
more attention to knowing and isolating specific markers of CSCs in cancer research
including CD133, CD90, CD44, CD24, ABCG2, SCA1 and ALDH. Although these
markers are not exclusively expressed in cancer stem cells, but can be useful for isolation
the enriched subset of CSCs as a base for further studies including self-renewal assays.
CD44, a cell-surface glycoprotein has been recognized as one of the main markers to
identify CSCs in several tumor tissues i.e., CD44 positive CSC-like cells showed
enhanced ability for metastasis in different tumor cells [6-8]. For instance, this protein
has been widely expressed in breast cancer tumors that is used to enrich cells population
with stem-like characteristics [9, 10]. This marker binds to various ECM ligands mainly
HA and collagen to regulate many signaling pathways related to tumor invasion,
metastasis and growth [11, 12]. Extensive studies used the anti-CD44 antibodies as a
therapeutic agent to target CD44 [13-15].Therefore, identifying specific agents to target
CD44 is potentially a promising method for tumor suppression, especially in CD44
overexpressed tumors. Recently it has been reported that the laminin alpha5 synthetic
6
inhibits tumor cell migration, invasion, and angiogenesis of B16-F10 melanoma cells in a
dominant-negative manner and inhibits Cancer stem cells microenvironment [16].
CSCs with theproperties ofnormal stem cellsuse similar signaling pathways to maintain
their stemness. However, they may respond to the environmental cue differently. Under
normal conditions, stem cells keep the balance between proliferation and differentiation
but CSCs, due to mutations in the cell, are self-sufficient and involve unregulated cell
proliferation[17, 18]. It has been proposed that the stem cell niche is converted from
proliferation inhibitory to signals favoring cell proliferation in the case of CSCs. For
instance, the tumor stromais characterized by extracellular matrix (ECM) remodeling and
stiffening. The limited knowledge of the relation between ECM stiffening and tumor
progression has brought many questions into this field of study [19].
Two major factors make it difficult to study tumor microenvironment in vivo. First,
animal models may not adequately reproduce the features of human cancers in vivo. The
process of cancer development may take many years and immune-compromised animals
frequently used to study molecular pathways or drug response, in most cases cannot
provide a complete model for human tumor because of their short life span. Second, it is
difficult to study the effect of a specific factor in the microenvironment while keeping all
other factors unchanged. Therefore, there is a need to develop in vitro models to study the
molecular basis of tumorigenesis and progression.
Most in vitro studies use standard two-dimensional (2D) cell culture. However, cells
grown on 2D tissue culture lack proper cell–cell and cell–matrix interactions and behave
differently from those grown in 3D environment.Removing cells from their natural
7
changes all aspects of cell behavior from morphology to gene expression and
differentiation pattern [20, 21]. For example, it has been reported that culturing human
breast carcinoma cells on flat 2D culture plates changed their proliferation and
differentiation pattern and reduced their malignancy compared with those under in vivo
conditions [22]. Thus, developing 3D culture systems in which cells sustain their tissue
specific phenotype is critical. This helps cancer researchers to understand the
mechanisms by which CSCs maintain and progress.Most 3D models promote cell–cell
interaction, adhesion, migration, and in vivo–like morphogenesis.
Among existing in vitro culture methods, growing tumorspheres in suspension on
ultra-low-attachment plates is a commonly used traditional method to enrich CSCs in vitro but
cannot mimic the tissue specific chemical and mechanical properties of ECM for cells.
Various types of materials have been used to generate a 3D matrix. naturally-derived 3D
matrices used for immobilization of CSCs in vitro reduced difficulties of following
progression of these cells in vivo but still do not allow studying the effect of
environmental factors individually, due to their many ligand-receptor interactions. Type
1 collagen and Matrigel are the most widely used matrices [23] because they are
biocompatible and support adhesion and growth of many cell types [24, 25]. Alginate and
agarose gels are also used as a matrix to study the behavior of breast cancer cells under a
3D condition [26, 27].Several studies have used natural hydrogels to study the effect of
microenvironmental factors on cancer cells fate [28-31]. However, it is difficult to isolate
and study cell response to individual factors in the microenvironment with naturally
derived matrices that have many interactions with cell surface receptors [32]. Compared
8
to study the independent effect of ECM factors in vitro. These matrices allow precise
control of different factors such as conjugated bioactive peptides on CSCs behavior and
differentiation followed by studying targeted cancer therapy using antibodies or bioactive
peptides to bind to specific markers on the surface of tumor stem cells. . Among them,
polyethylene glycol (PEG) hydrogel has been extensively used as an engineered matrix
for cell encapsulation to elucidate the effect of factors in the microenvironment on cell
fate [33-36].
Recent advances in cancer research have highlighted the importance of CSCs interaction
with the microenvironment at cellular and molecular levels [37]. The maintenance of
CSCs is highly dependent on their interactions with ECM and surrounding cells i.e.,
proper intercellular interaction plays a critical role in cancer pathogenesis [38]. Epithelial
cells interact with surrounding cells through different mechanisms of adherens, gap and
tight junctions. Making changes in the pattern of interactions between adjacent cells may
affect the phenotype and functionality of cancer cells [39]. Growing evidence show that
major signaling pathways involved in maintenance of both normal and cancer stem cells
including Notch, Wnt and Hedgehog depend on the level of interactions with their
adjacent cells [40].
Several studies suggest that the role of ECM in self-renewal and differentiation of stem
cells is not limited to the matrix mediated chemical cues but the role of physical signaling
in cancer progression and stem cells functionality is indisputable [41-45]. ECM stiffness
will increase tension and change cells properties in regard of growth, survival, migration
and morphogenesis. Reducing this tension, malignant behavior of cancer cells will be
9
and growth factors which plays critical roles in cancer initiation, progression, and
metastasis [20]. Cells sense and respond to geometry of the microenvironment in various
levels. For example they respond the morphology of ECM and arrangement of
neighboring cells in microscale [46, 47].
In vivo, the stiffness of cells microenvironment is highly variable ranging from softer
(breast, gastric) to hard (bone, teeth) tissues. Cells have the ability to sense and respond
to matrix stiffness by synthesizing the appropriate extracellular matrix (ECM)
composition as the mechanical properties and composition of hard and soft tissues differ
significantly. In 3D culture systems, elastic modulus of the matrix can direct
differentiation of encapsulated stem cells and shift the balance of cell proliferation and
apoptosis [48-50]. Likewise, the proliferation, differentiation, migration, and apoptosis of
cancerous cells in the tumor tissue are regulated by matrix stiffness [38, 51, 52].
Therefore, cells need to respond appropriately to the environmental cues for survival [53]
and it is important to provide the appropriate range of stiffness in the local
microenvironment for cells to survive [54, 55].
Recent advances in studying the mechanical properties of ECM allow researchers to
investigate the higher aspects of ECM biomechanics and their key role in stem cells fate.
For example, microfabrication techniques have been recently used to control the size of
spheroids in substrates through the physical confinement of the micropatterned wells
[56-58]. Several studies have focused the effect of microenvironmental factors on the
maintenance of normal stem cells [59-61]. However, the individual role of mechanical
and chemical properties of ECM on CSCs in an inert matrix has not been investigated. In
10
formation using MDA-MB-231 encapsulated in the 5kPa PEGDA hydrogel. We show
that tumorsphere formation is highly dependent on the number density of encapsulated
cells and happens in a certain range of density. This study continued with the effect of
matrix elastic modulus on the formation, growth, and maintenance of CSCs using 4T1,
MCF7, MDA-MB-231 breast cancer cell lines with different level of malignancies,
HCT116, AGSand U-2 OS cancer cell lines encapsulated in a range of moduli of PEG
hydrogels, in the absence of attached ligands that interact with cell surface receptors.
MCF10a, a normal human breast epithelial cell line was used as control to be compared
with the cancer cell lines by their sphere formation ability. We showed that the formation
and maintenance of tumorspheroids in these cancer cell lines are modulated by the elastic
modulus of the PEG matrix.
For the purpose of comparison, we used the layer-by-layer micropatterning technique to
employ pre-defined zones of cell encapsulation in PEGDA hydrogels and control the size
of formed spheroids. We compared the CSCs properties of formed tumorspheroids in
micropatterns with the control group of non-patterned hydrogels and indicate that the
spatial limitation of micropatterns may control the size of formed spheroids and maintain
the CSCs properties.
Following the study ofmechanical properties, the inert PEGDA hydrogel, in certain range
of moduli, was used as a 3D cell culture model to investigate the role of cell binding
peptides in the maintenance of CSCs. More specifically, we investigated the effect of
A5G27 peptide on CD44 overexpressed breast, colon and bone CSCs. We also studied
the effect of additional ECM-derived cell binding peptides that are active in malignancy
11
We chose two peptides of fibronectin, the major components of ECM mediating
tumorigenicity, a well-known integrin binding RGD peptide (I1) and FC/HV a
fibronectin-derived heparin-binding peptide (H1). It has been shown in several studies
that laminin-111, one of 15 isoforms of laminin, plays a major role in tumor cells
adhesion, migration, growth and metastasis [62, 63]. We chose YIGSR (I3), a
well-studied laminin-derived active peptide located on the β l chain, and IKVAV (I2) another
peptide sequence on α chain of laminin-111 to study their effect on CSCs maintenance.
Col IV is the other structural protein that plays an important role in tumor progression
[64, 65]. In this study, we investigated the effect of two different heparin binding
peptides derived from Collagen IV, Hep I (H2) and Hep III (H3) on the tumorspheroid
formation and CSCs maintenance.
1.3 HYPOTHESIS
1.3.1 PEG based hydrogels with a wide range of mechanical properties and water
content as an inert engineered 3D matrix can provides a novel tool to control and
investigate the effect of microenvironmental factors on maintenance of CSCs in vitro.
1.3.2 Culturing cancer cells in confined areas of PEGDAmicropatterns may provide a
useful 3D in vitro culture system to mimic the spatial limitations of CSCs
microenvironment and controlsthe proliferation and size of tumorspheres.
1.3.3 CD44, Integrin and heparin binding peptides conjugated to the gel can affect the
12
CHAPTER
2
13
2.1 MACROMER SYNTHESIS AND CHARACTERIZATION
The PEG macromer was functionalized with acrylate groups to produce PEGDA by the
reaction of acryloyl chloride with hydroxyl end-groups of PEG. TEA was used as the
reaction catalyst. Prior to the reaction, PEG was dried by azeotropic distillation from
toluene to remove residual moisture. The polymer was dissolved in dried DCM in a
reaction flask and the flask was immersed in an ice bath to cool the solution. In a typical
reaction, 5.6 ml acryloyl chloride and 9.7 ml TEA, each dissolved in DCM, were added
drop-wise to the reaction with stirring. The reaction was allowed to proceed for 12 h
under nitrogen flow. After completion of the reaction, the solvent was removed by rotary
evaporation and the residue was dissolved in anhydrous ethyl acetate to precipitate the
by-product triethylamine hydrochloride salt. Next, ethyl acetate was removed by vacuum
distillation; the macromer was re-dissolved in DCM and precipitated twice in cold ethyl
ether. Then, the macromer was dissolved in Dimethyl sulfoxide (DMSO) and dialyzed
against distilled deionized (DI) water to remove the by-products. The PEGDA product
was freeze-dried and stored at -20ºC. A hydrolytically degradable version of the PEGDA
gel (dPEGDA) was synthesized with a similar procedure as described previously[36].
The chemical structure of the functionalized macromer was characterized by a Varian
Mercury-300 1H-NMR (Varian, Palo Alto, CA) at ambient conditions with a resolution
of 0.17 Hz. The sample was dissolved in deuterated chloroform at a concentration of 5
mg/ml and 1% v/v TMS was used as the internal standard.
2.2 HYDROGEL SYNTHESIS AND MEASUREMENT OF GEL MODULUS
The PEGDA macromerswere cross-linked in aqueous solution by ultraviolet
14
ketone (Irgacure 2959; CIBA, Tarrytown, NY) photoinitiator. 10 milligrams of initiator
were dissolved in 1mL PBS by vortexing and heating to 50°C. To prepare 2, 5, 25, 50,
and 70 kPa moduli ofPEGDA hydrogel precursor solutions, 5, 10, 15, 20, and 25 wt%of
PEGDA macromer were dissolvedinthe initiator solution, respectively. The hydrogel
precursor solutionswere degassed and transferred to a polytetrafluoroethylene (PTFE)
mold (5 cm × 3 cm× 750 m), covered with a transparent glass plate, fastened with clips,
and UV irradiated with a BLAK-RAY 100W mercury, long-wavelength (365 nm) UV
lamp (Model B100-AP; UVP, Upland,CA) for 10 min. Disk-shaped samples were cut
from the gel using an 8-mm cork borer and swollen in PBS for 24 h at 37°C. To measure
the elastic modulus of gels, samples were loaded on the Peltier plate of the rheometer
(TA Instruments, New Castle, DE) and subjected to a uniaxial compressive force at a
displacement rate of 7.5 mm/s. The slope of the linear fit to the stress–strain curve for
5%–10% strain wastaken as the elastic modulus (E) of the gels.
2.3 CSC CULTURE AND CHARACTERIZATION
4T1, MDA-MB-231, MCF7, HCT116 and AGS tumor cell lines were cultured in
RMPI-1640 medium supplemented with 10% FBS. U-2 OS cells were grown in DMEM
medium with 10% FBS where MCF10a were cultured in DMEM-F12 supplemented with
0.5 mg/ml Hydrocortisone, 10 μg/ml insulin, 100 ng/ml Cholera toxin, 20 ng/ml EGF
and, 5% horse serum. Cells were trypsinized after reaching 70% confluency. PEGDA
macromer was dissolved in PBS and sterilized by a 0.2 m filter. Next, 5 ×10⁵/ml cells
were added to the macromer solution with final PEGDA concentrations ranging 2–70kPa
and mixed gently with a pre-sterilized glass rod. The cell-suspended hydrogel precursor
15
gel was cut into disks and incubated in stem cell culture medium under 5% CO2. The
stem cell medium consisted of DMEM-F12 supplemented with 0.4% BSA, 5 mg/mL
insulin, 40 ng/mL bFGF, 20 ng/mL EGF, 5% horse serum, 100U/mL penicillin, and 100
mg/mL streptomycin [66]. For growing tumorspheres in suspension, trypsinized 4T1 cells
were cultured on ultra-low-attachment tissue culture plates with stem cell culture medium
under 5% CO2 at 37°C as described previously [66-68]. The gold standard for
characterization of CSC tumorspheres for stemness is by the ability to form tumor in
vivo[69, 70]. To test for tumor formation, a stable 4T1 cell line that expressed luciferase
(4T1-Luc)was established as described. Luciferase expression vector pGL4.50
[Luc2/CMV/Hygro] (Promega, Madison, WI) was transfected into 4T1 cells by
Lipofectamine 2000 (Invitrogen), according to the manufacturer’s instructions, to
generate a cell line expressing luciferase as a reporter [71]. After 24 h, cells were
trypsinized and cultured in RPMI-1640 medium with 400 mg/mL of hygromycin for 3
weeks to generate 4T1-Luc cells. 4T1-Luc cells were cultured on adhesion plates
withregular RPMI-1640 culture medium or on ultra-low-attachment plates with stem cell
culture medium as described previously.After one week, cells were trypsinized and
counted. Different number of cells (5000 and 50,000 cells from adhesion plates or 500,
1000, and 5000 tumorsphere cells from ultra-lowattachment plates) was injected
subcutaneously in syngeneic Balb/c mice (6 mice/group). One week after inoculation,
100 mL of D-Luciferin (30mg/mL; Caliper, Hopkinton, MA) was injected
subcutaneously and mice were imaged 10 minafter Luciferin injection by Caliper’s IVIS
16
2.4 CELL IMAGING AND DETERMINATION OF CELL NUMBER
To determine cell viability, gels were stained with cAM/EthD live/dead dyes 2 days after
encapsulation to image liveand dead cells, respectively. Stained samples were
imagedwith an inverted fluorescent microscope (Nikon Eclipse Ti-e;Nikon, Melville,
NY). Cell viability was quantified by dividingthe image into smaller squares and
counting the number of live and dead cells. At each time point, the gel samples were
removed from the culture media and stained for imaging. Samples were rinsed twice with
PBS and fixed with 4% paraformaldehyde for 3h. After fixation, cells were permeabilized
using PBS containing 0.1% Triton X-100 for 5min. After rinsing, cells were incubated
with Alexa 488 phalloidin (1:200 dilution) and DAPI (1:5000 dilution) to stain actin
filaments of the cell cytoskeleton and cell nuclei, respectively.
Stained samples were imaged with a Nikon Eclipse Ti-e inverted fluorescent microscope.
For visualization of cell uniformity, a confocal fluorescent microscope (Zeiss
LSM-510META Axiovert; Carl Zeiss, Germany) was used to obtain 2D images (90-mm-thick
layers) of the stained gels in the direction of thickness, as described [72]. For
determination of cell number the gel samples were homogenized, cells were lysed, and
aliquots were used to measure the dsDNA content using a Quant-it PicoGreen assay as
described[73]. Briefly, an aliquot (100 L) of the working solution was added to 100 L
of thecell lysate and incubated for 4 min at ambient conditions. The fluorescence of the
solution was measured with a plate reader (Synergy HT; Bio-Tek, Winooski, VT) at
emission and excitation wavelengths of 485 and 528nm, respectively.
Measuredfluorescent intensities were correlated to cell numbers using a calibration curve
17
2.5 BRDU RETENTION ASSAY AND IMMUNOFLUORESCENT IMAGING
BrdU label retention was used to identify mammary CSCs as described [74, 75].
Nonconfluent 4T1 cells were incubated with 10 mM of BrdU for 10 days to label the
DNA by incorporating BrdU into replicating DNA in place of thymidine. Next,
theBrdU-labeled cells were encapsulated in the gel and incubated in stem cell culture medium to
form tumorspheres as described previously. At each time point, the retention of BrdU in
the encapsulated cells was imaged by immunofluorescent staining with
anti-BrdUantibodies as described [75]. At each time point, tumorspheres encapsulated in the
gel samples were processed and stained for immunofluorescent imaging of BrdU-labeled
cells or CD44 marker as described [76]. Gel samples were fixed and permeabilized for 3
h at 4°C in PBScontaining 4% paraformaldehyde and 1% Triton X-100, followedby
rinsing with PBS (3×10 min). Tumor spheroidswere then dehydrated in an ascending
series of methanol at4°C in PBS (25%, 50%, 75%, and 95% for 30 min each and 100%
for 5 h) and rehydrated in the same descending series andwashed in PBS
(3×10 min). Next, samples were blocked withPBS containing 0.1% Triton X-100
(PBST) and 3% BSA overnightat 4°C and washed with PBS (2 × 15 min). Then,
sampleswere incubated with primary antibodies (anti-CD44 antibodyor anti-BrdU
antibody) diluted in PBST on a gently rockingrotator at 4°C overnight followed by
rinsing with PBST(4 × 30 min). Samples were then incubated with Alexa Fluor–
conjugated secondary antibodies for 2 h and rinsed with PBST
(4× 10 min). The cell nuclei were counterstained with DAPI(1:5000 dilution in PBS) and
18
2.6 RNA ANALYSIS
Total cellular RNA of the gel samples was isolated using TRIzol (Invitrogen) as
described [73]. About 250 ng of the extracted purified RNA was reverse transcribed to
cDNA by SuperScript II Reverse Transcriptase (Invitrogen) with the random primers.
The obtained cDNA was subjected to realtime quantitative polymerase chain reaction
(RT-qPCR) amplification with appropriate gene-specific primers. RT-qPCR was
performed to analyze the differential expression of CSC markersgenes with SYBR green
RealMasterMix (Eppendorf, Hamburg, Germany) using Bio-Rad iCycler PCR system
(Bio-Rad, Hercules, CA). The expression level of GAPDH gene was used as an internal
control. The primers for RT-PCR were designed by Primer 3 software
(http://frodo.wi.mit.edu). The forward and reverse primer sequences, listed in Table
2.1.The relative gene expression levels were quantified by the 2–DDCT method as
described [77, 78]. The relative gene expression was expressed asfold difference
compared with that at time zero.
2.7 MICROPATTERN FABRICATION
Briefly, 40 µL of the gel precursor solution (without cells and peptides) was transferred
onto a glass base between two tape spacers (separated by 2 cm) and covered with a glass
slide. Upon hydrogel crosslinking under UV irradiation for 8 minutes, the cover was
removed and the gel was washed with PBS five times to remove the unreacted
macromers. The second layer was fabricated by thickening the spacer with placing
another tape layer, transferring 40 µL of the gel precursor solution on top of the first
19
were designed using Autocad software and printed on a transparent paper. MDA-MB-231
cells were suspended in gel precursor solution and transferred on the gel layer.
Table 2.1 The forward and reverse primer sequences
PCR Primer Forward Sequence Reverse Sequence
mGAPDH hGAPDH
CATGGCCTTCCGTGTTCCTA´ GAGTCAACGGATTTG GTCGT
CCTGCT TCACCA CCT TCTTGA´ TTGATTTTGGAGGGATCTCG mCD44 mABCG2 mSCA1 mCD24 hCD44 GAATGTAACCTGCCGCTACG´ AGCAGCAAGGAAAGATCCAA´ TGGACACTTCTCACACTA-CTTCTGGCACTGCTCCTACC GGCTTTCAATAGCACCTTGC
GGAGGT GTT GGA CGT GAC´ GGAATACCGAGGCTGATGAA´ CAGAGCAAGAGGGTCTGCAGGAG
GAG AGAGAG CCAGGAGACCA´ ACACCCCTGTGTTGTTTGCT hABCG2 CACCTTATTGGCCTCAGGAA CCTGCTTGGAAGGCTCTATG’
hCD133 GCATTGGCATCTTCTATGGTT’ CGCCTTGTCCTTGGTAGTGT h Oct4 CGCCGTATGAGTTCTGTG’ GGTGATCCTCTTCTGCTTC’ hTGFb CCGGAGGTGATTTCCATCTA’ CTCCATTGCTGAGACGTCAA’ hEGFR CAGCGCTACCTTGTCATTCA TGCACTCAGAGAGCTCAGGA’
The spacers were thickened and the mask was placed on top of the spacers and was
pressed flat by a glass slide. After 5 minutes UV crosslinking of the sample, the mask
was removed; the gel was washed three times and was cured for 3 minutes under UV.
The patterned gel was then washed three times with PBS, removed from the glass base
and transferred to the media.
2.8 PEPTIDE SYNTHESIS AND CHARACTERIZATION
CD44 binding peptide (CD44bp), integrin-binding peptides (Ibps), and heparin-binding
peptide (Hbps) as well as their mutants, selected according to previous reports [79-81],
20
previously described procedure [82]. The sequences of these peptides and their mutants
are listed in Table 2.2.
Table 2.2 Peptides sequence and the origin
Peptide Name Sequence Protein of Origin
FC/HV WQPPRARI-Ac Fibronectin
HepI TAGSCLRKFSTMY-Ac Collagen IV
HepIII GEFYFDLRLKGDKY-Ac Collagen IV
I1 GRGDS-Ac Fibronectin
I2 IKVAV-Ac Laminin
I3 YIGSR-Ac Laminin
Briefly, the Fmoc-protected amino acid (6 eq.), DIC (6.6 eq.), and HOBt (12 eq.) were
added to 100 mg resin and swelled in DMF (3 mL). Next, 0.2 mL of 0.05 M DMAP was
added to the mixture and the coupling reaction was allowed to proceed for 4-6 h at 30°C
with orbital shaking. The resin was tested for the presence of unreacted amines using the
Kaiser reagent [82]. If the test was positive, the coupling reaction was repeated.
Otherwise, the resin was treated with 20% piperidine in DMF (2×15 min) and the next
Fmoc-protected amino acid was coupled using the same procedure. After coupling the
last amino acid, the peptides were functionalized with an acrylamide group directly on
the peptidyl resin by coupling acrylic acid to the N-terminal amine group under
conditions used for the amino acid coupling reaction [82]. The acrylamide-terminated
peptide was cleaved from the resin by treating with 95% TFA/ 2.5% TIPS/ 2.5% water
and precipitated in cold ether. The acrylamide-terminated (Ac) peptides were further
purified by preparative HPLC on a 250 x 10 mm, 10 µm Xterra Prep RP18 column
(Waters, Milford, MA) with a flow rate of 2 mL/min using a gradient 5–95% MeCN in
21
lyophilized and the product was characterized with a Finnigan 4500 Electro Spray
Ionization (ESI) spectrometer (Thermo Electron, Waltham, MA).
2.9 FLOW CYTOMETRY ANALYSIS
Cells encapsulated in the gel were fixed with 4% paraformaldehyde for 30 min followed
by washing with PBS. Next, the gel was incubated in oxidative degradation solution
(0.1M CoCl in 20% hydrogen peroxide) [83]. After the gel was degraded, cells were
washed three times with cold PBS containing 5% BSA. MCF7 cells were incubated with
phycoerythrin (PE) mouse anti-human CD24 and fluorescein isothiocyanate (FITC)
mouse anti-human CD44 (BD Biosciences, Franklin Lakes, NJ), and 4T1 cells were
incubated with PE-anti-mouse CD24 and FITC-anti-mouse CD44 (eBioscience, San
Diego, CA) in 100 µl PBS with 5% BSA for 45 min on ice in dark. Cells were then
washed with cold PBS with 5% BSA three times and analyzed by a flow cytometer
(FC500, Beckman Coulter, Brea, CA). Flow cytometry was done multiple times on each
sample to ascertain reproducibility of the results.
2.10 WESTERN BLOT
The cell encapsulated gel was washed with PBS and homogenized in RIPA buffer (1%
NP40, 1% SDS, 150mM NaCl, 20mM Tris-Cl pH7.4, 1mM EDTA protease inhibitors) to
extract the proteins. The homogenized sample was centrifuged for 5 min to isolate total
proteins. Next, proteins were separated by standard SDS-PAGE using Mini-gel system
(Bio-Rad) and transferred to a nitrocellulose membrane by the semi-dry transfer
apparatus (Bio-Rad). Membranes were incubated in the blocking buffer (5% fat-free dry
22
antibodies (1:200-1:2000) overnight at 4oC. After washing, the membrane was incubated
with HRP-conjugated secondary antibodies for 1 h at ambient conditions. After extensive
washing with TBST, the membrane was incubated with ECL detection reagents and
exposed to an X-ray film. The intensity of the band was quantified with the Image-J
software (National Institutes of Health, Bethesda, MD).
2.11 STATISTICAL ANALYSIS
Data are expressed as mean +/- standard deviation. All experiments were done in
triplicate. Significant differences between groups were evaluated using a two-way
analysis of variance (ANOVA) with replication test followed by a two tailed Student’s
23
CHAPTER 3
24
3.1 EFFECT OF CELLS NUMBER DENSITIES ON TUMORSPHERES
FORMATION IN HYDROGEL
MDA-MB-231 tumor cells with initial number densities of 0.3, 0.6, 1, 1.5 and, 2 (106 /ml)
were encapsulated in 5kPa PEGDA hydrogels and cultured in stem cell medium for 9
days.Fluorescent images in Figure 3.1 show the extent of cell aggregation and spheroid
formation after 9 days (column 2) for MDA-MB-231 encapsulated cells with initial
number densities (column 1) of 0.3 (Fig 3.1, row 1), 0.6 (Fig 3.1, row 2), 1 (Fig 3.1, row
3), 1.5 (Fig 3.1, row 4) and 2 (Fig 3.1, row 5) (106 /ml). Spheroid formation was
observed in two initial number densities of 0.6 and 1 (106/ml). While cells with low
initial density of 0.3 (106/ml) did not change significantly in morphology, densities of 1.5
and, 2 (106/ml) showed significant increase in the number and shape of cells aggregates
during 9 days.
The number density of viable cells is shown in Figure 3.1B. Although, the cell count did
not increase in the group with 0.3 (106/ml) of cells, it increased with time for the other
groups after 9 days. This change was bimodal that the cell count initially increased about
4 and 5 times in the groups with densities of 0.6 and 1 (106/ml) respectively and then
decreased to 3 times for cells with initial densities of 1.5 and 2 (106/ml) suggesting that
the highest potential for growth was observed in the groups with the ability of
tumorspheroids formation.
The expression of breast CSC markers for tumorspheres and cell aggregates grown in
PEGDA gels with different cell number densities is shown in Figure 3.1 C–E. Cells with
0.6 and 1 (106 /ml) initial number density had the highest expression of all markers
25
CD44 expression initially increased and reached a maximum at the cell number density
of 1 (106 /ml) then decreased sharply for higher densities at both timepoints of 6 and 9
days. The highest expression of ABCG2 and EGFR markers were observed in the group
with 0.6 (106 /ml) density which formed larger sizes of tumorspheroids compared to the
group with 1 (106 /ml) density. Aggregates in the groups with high cell number densities
showed very low fold expression of these two markers at both timepoints. Therefore, the
biphasic behavior was also observed for these two markers that the fold expression of
markers had a decreasing trend for the cell densities higher than 0.6 (106 /ml). The CSC
expression in the group with low cells density of 0.3 (106 /ml) did not increase
significantly in 9 days of incubation and remained in a very low level.
Increasing the cell number density will directly affects the quantity and level of cell-cell
interaction and may affect the fate of encapsulated cancer cells. Although normal and
cancer stem cells regulate similar signaling pathways to keep their stemness, their degree
of dependency to the environmental cues including neighboring cells is totally different.
Under normal conditions, the microenvironment provides transient signals for both
proliferation and differentiation of stem cells and plays a critical role to maintain their
stemness. On the other hand, CSCs due to the mutations, are self-sufficient with respect
to proliferation [37, 38]. CSCs do not need to be in tight junctions with their surrounding
cells to grow and form tumorspheroids in vitro. Encapsulation of epithelial cancer cells
harvested from 2D culture plates in form of aggregates eliminates the chance of spheroid
formation. This may be explained by the fact that cells in form of aggregates with apical
and basal surfaces remain polarized after being cultured in PEG hydrogels. However,
26
lose their polarity and ECM adhesion tendency resulting in development of CSCs-like
properties accompanied with sphere formation. This loss of polarity inhibits the growth
of polar non-CSCs. Consistent with this notion, Epithelial to Mesenchymal Transition
(EMT), one of the main biological events involved in tumor spheroids formation needs
cells to lose their polarity. [39-41]. Besides, the direct cell-cell contact between cells act
as a barrier to the diffusion of small signaling molecules vital for induction of CSC-like
properties through the intercellular space [16].
Signaling pathway involved in CSCs progression, may not need the tight junction of cells
to be regulated but still need close communication of cells together i.e., culturing cells at
a very low number density of 0.3 (106 /ml), prevents cells to receive the signals of
adjacent cells.
High expression of CD44 as the most important marker for breast CSCs identification
correlates to formed tumorspheroids with higher population of CSCs compared to groups
with single cells or aggregates. The larger diameters of spheroids in groups with 0.6 (106
/ml) cells showed higher expression of EGFR and ABCG2 markers which may be related
the higher level of cell-cell interaction in larger spheroids.
3.2 EFFECT OF MATRIX MODULUS AND TOPOGRAPHY ON STEM CELLS
AND TUMORSPHERE FORMATION
3.2.1 HYDROGEL MODULUS
Disk-shaped hydrogels with 8mm diameter and 750mm thickness were fabricated for
determination of elastic modulus and cell encapsulation. The effect of macromer
27
in Figure 3.2. Macromer concentration in the precursor solution affected the elastic
modulus of the hydrogel. The elastic modulus increased from 2 to 70 kPa as the
28
macromer concentration was increased from 5% to 10%, 15%, 20%, and 25%,
respectively.
Figure 3.2 Effect of macromer concentration on elastic modulus of PEGDA gels with time
3.2.2 TUMORSPHERE CHARACTERIZATION
Tumorsphere formation on ultra-low-attachment plates is a commonly used method to
enrich CSCs in vitro, while the gold standard for characterization of CSC tumorspheres is
by the ability to form tumor in vivo [69, 70]. 4T1-Luc cells were cultured on regular
adhesion plates or ultra-low-attachment plates. After one week, cells in monolayers
(adhesion plates) and in spheres (ultra-low-attachment plates) were collected and
subcutaneously inoculated in syngeneic Balb/c mice.
Tumor formation in mice was determined by imaging the expression of luciferase one
29
(Fig 3.3 A) and cells from tumorspheres on ultra-low-attachment plates (Fig 3.2 B). The
left and right images in Figure 3.3 A are for 5000 and 50,000 4T1-Luc cells on adhesion
plates. The left, center, and right images in Figure 3.3 B are for 500, 1000, and 5000
4T1-Luc cells
Figure 3.3 Comparing in vivo tumor formation of 4T1 cells from adhesion plates (A) with 4T1 cells from tumorspheres on ultralow-attachment plates (B). The left and right images in (A) show tumor formation by inoculation of 5000 and 50,000 4T1-Luc cells, respectively. The left, center, and right images in (B) show tumor formation by inoculation of 500, 1000, and 5000 4T1-Luc cells from tumorspheres. 4T1-Luc cells were inoculated subcutaneously in Balb/c mice. After one week, the expression of luciferase in tumors was imaged. The light blue, dark blue and red color images correspond to low, medium, and high luciferase intensity, proportional to the size of the tumor formed.
from tumorspheres on ultra-low-attachment plates. According to the images in Figure 3.3,
1000 tumorsphere cells were sufficient to form a tumor in vivowhile it required 50,000
regular tumor cells to form a tumor. These results demonstrate that tumorspheres formed
by 4T1cells in vitro had enriched CSC subpopulation.
3.2.3TUMORSPHERE FORMATION IN HYDROGEL
In modulus study, we have focused on encapsulation of 4T1 mouse breast cancer cell line
and human carcinoma cells including MCF7, MDA-MB-23 (Breast), HCT116 (Colon),
30
medium up to 14 days at different PEGDA hydrogels moduli ranging from 2 to 70 kPa.
MCF10a, a normal human breast epithelial cell line was encapsulated in 5 kPa modulus
gel and used as control to be compared with the cancer cell lines by their sphere
formation ability. Tumor spheroids are a 3D representative of the CSCs population and a
level of malignancy of cancer cells, in vitro[84].4T1 tumor cells were encapsulated in
PEGDA hydrogels with elastic moduli ranging from 2 to 70 kPa and cultured in stem cell
medium for 2 weeks. Images of live and dead cells 2 days after encapsulation in PEGDA
gels with moduli of 2, 5, 25, and 50 kPa are shown in Figure 3.4 A through 3D,
respectively. Based on image analysis, the percent viable cells for 2, 5, 25, 50, and 70kPa
gels were 94±4, 91±3, 92±3,90±4, and 89±4, respectively. These results show that the gel
modulus did not have a significant effect on viability of 4T1 cells after encapsulation. To
determine cell uniformity and viability, a confocal microscope was used to image cells in
the direction of thickness and the results are shown in Figure 3.5 E1±E8. Images in
Figure 3.4 E show uniform cell seeding and cell viability within the gel in the thickness
direction.
Fluorescent images in Figure 3.5 show the extent of cell aggregation and spheroid
formation with incubation time for 4T1 gels with modulus of 2 kPa (Fig 3.4, column 1), 5
kPa (Fig 3.4, column 2), 50 kPa (Fig 3.4, column 3).Rows 1, 2 and 3 in Figure 3.5
correspond to incubation times of 5, 8, 11, and 14 days, respectively. Spheroid formation
was observed in soft gels with moduli of 2 and 5 kPa as early as day 5 (columns 1, 2 in
Fig 3.4) while cells in the more stiff gels with modulus of 50 kPa and higher remained as
single cells or small cell aggregates (< 25 µm). At any time point, size of the
31
Figure 3.4 Live (green) and dead (red) image of 4T1 cells 2 days after encapsulation in PEGDA hydrogels with moduli of (A) 2 kPa, (B) 5 kPa, (C) 25 kPa, and (D) 50 kPa. The scale bar in images (A–D) is 200 mm. Based on image analysis, the percent viable cells for 2, 5, 25, 50, and 70 kPa gels was 94 ± 4, 91 ±3, 92 ± 3, 90 ± 4, and 89 ± 4, respectively. Images (E1– E8) on the right show the uniformity of cell seeding and cell viability in successive 90 mm layers in the direction of thickness for 5.3 kPa gel obtained with a confocal fluorescent microscope. The scale bar in images (E1–E8) is 200 μm.
Lower magnification images showing the number density of 4T1 (Fig 3.5, column 1) and
MCF7 (Fig 3.5, column 2) tumorspheres in PEGDA gels with elastic moduli of 2 kPa
(Fig 3.5, row 1), 5 kPa (Fig 3.5, row 2), 25 kPa (Fig 3.5, row 3), and 50 kPa (Fig 3.5,
row 4) after 8 days of incubation are shown in Figure 3.6, respectively.According to
Figure 3.6, the tumorsphere size and number density initially increased with increasing
matrix modulus from 2 to 5 kPa and then decreased when modulus was increased to 25
and 50 kPa. Tumorspheres with diameter >100µm were observed only in the gels with
modulus of 2 and 5 kPa but the fraction of large tumorspheres (> 100 µm) was
32
Figure 3.5 Evolution of tumorsphere formation by 4T1 tumor cells encapsulated in PEGDA hydrogels with elastic modulus of 2 kPa (left column), 5 kPa (center left column), and 50 kPa (right column) as a function of incubation time. Rows 1, 2, 3, and 4 correspond to incubation times of 5, 8, 11, and 14 days, respectively. At each time point, encapsulated cells were stained with Phalloidin for cytoskeleton (red) and DAPI for nucleus (blue), and imaged with an inverted fluorescent microscope.
It should be noted that the size of MCF7 spheroids in the gels was less than that of 4T1.
The evolution of tumorsphere for human cell lines is presented in Figure 3.11.
Fluorescent images in Figure 3.11 A show the optimum modulus for spheroid formation
of each cell line as a function of time. The optimum moduli in columns 1 to 6 correspond
to 5, 5, 5, 25, 50 and, 25 kPa, respectively. At these moduli the single-cells fraction of
33
from optimum stiffness led to reduction of the size and number of the formed
tumorspheres in each cell line (Fig 3.11 C, D). For example MCF7 and MDA-MB-231
cell lines formed the largest and most number of spheroids in their optimum modulus of 5
kPa at each time pointwhich is similar to the moduli of breast tumor tissues reported in
the literature [85]. Tumorspheres formed in the softer gels (with modulus of 2 kPa) were
smaller in size and
number and cells in the stiffer gels (25 kPa and higher) did not form spheres and
remained as single cells or small colonies (< 25 µm). The highest number and diameter of
spheroids in HCT116 and AGS cancer cell lines was observed in 25 kPa. In the case of
U-2 OS cell line the spheroid formation maximized at 50 kPa. As illustrated in Figure
3.11 D, for HCT116 and AGS cell lines increasing the matrix modulus up to 25 kPa
increased the number of formed spheres 6 and 4 times, respectively . However, further
increase of matrix modulus reduced the number and the size of spheres. Similarly, the
highest number and size of formed spheroids for U-2 OS cell line observed at an
optimum modulus of 50 kPa.
The effect of hydrogel modulus on average tumorsphere diameter and size distribution
with incubation time is shown in Figure 3.7 A and B for 4T1 cells, respectively. The
average 4T1 tumorsphere diameter increased from 10 μm at day zero to 80, 140, 30, 15,
and 10 μm after 14 days as the gel modulus increased from 2 kPa to 5,25, 50 and
70 kPa respectively. For 4T1 cells in the softest gel (2 kPa modulus), 25% of the cell
aggregates at day 8 had <20 µm size (single-cell fraction) while there was no single-cell
subpopulation in the gel with 5 kPa modulus. Further, for the gel with 5 kPa modulus,
34
35 3.2.4TUMORSPHERE SIZE AND NUMBER DENSITY
Figure 3.7 Average tumorsphere size (A), tumorsphere size distribution (B), and cell count (C) for 4T1 tumor cells encapsulated in PEGDA hydrogels with different elastic moduli and incubated for up to 14 days. The symbol asterisk indicates statistically significant difference between the test group and all other groups at the same time point
respectively. The fraction of tumorspheres with 0–20μm diameter (single-cell fraction)
increased with increasing gel modulus for 4T1 cells and all of the cells in the highest
modulus gel (70 kPa) remained as single cells.
The number density of viable 4T1 cells in PEGDA gels with different moduli is shown in
Figure 3.7 C. The cell count increased with time for all groups but the gels with moduli
of 2 and 5kPa had the highest cell count at all-time points. At each time point, the change
in cell count with gel modulus was bimodal; that is, the cell count initially increased for
moduli of 2 and 5 kPa and then decreased for gels with moduli > 25 kPa. At day 14, the 5
kPa gel had 3-fold higher 4T1 cells than the 2 kPa gel; the 5 kPa gel had 10-fold higher
4T1 than those gels with > 25 kPa modulus. In general, the gel modulus has similar
effects on 4T1 cells. These results demonstrated that the gel with modulus of 5 kPa had
the highest potential for tumorsphere formation in the absence of ligand–receptor
36
The human cell number density at different moduli is shown in Figure 3.11 B. Although
the cell count in all groups increased after 9 days, the highest increase was observed in
the optimum modulus of each cell line. This caused a bimodal behavior in cell number
density of all cell lines i.e. the cell count increased up to the optimum modulus and
decreased with further modulus increase. This is notable in MDA, MCF7 and HCT116
cell lines.
The malignancy level of cancer cell lines can affect the density and size of tumorspheres.
For example, it has been shown that nonmalignant MCF10a epithelial cells are relatively
insensitive to the matrix stiffness within a wide range of stiffness while cancer cell lines
are sufficiently sensitive [86]. The size distribution of spheroids after 9 days shown in
Figure 3.11 E confirms this finding. MCF10a cells were almost non-sensitive to matrix
stiffness in the range of 2-70 kPa and 100% of cells had an average diameter less than 20
μm. On the other hand, MDA-MB-231 a triple negative breast cancer cell line, showed
the highest potential in cells aggregation and spheroids growth. No single-cell
subpopulation (less than 20 μm) of MDA-MB-231 cells was observed in the optimum
modulus of 5 kPa. Near 75% of the cells population were in the range of 60 to 80 μm for
this cell line whereas in MCF7 with a modest level of malignancy, only 20% of the cells
were in this range and about 60% of them were in the range of 40-60 μm.
In the optimized modulus of 25 kPa for HCT116 more than 70% of the spheroids were in
the range of 40 to 60 μm and about 5% of them were in range 60 to 80 μm. The single-
cell fraction increased with increasing the optimum gel modulus. About 50% of spheroids
formed in AGS cell line were in the range of 20-40 μm. For U-2 OS about 60% of the
37 diameters less than 22 μm (Fig 3.11 E).
One of the unique properties of CSCs is asymmetrical division and retention of DNA
labeling [70]. Based on this feature, BrdU retention is a commonly used method to
characterize CSCs. 4T1 cells were labeled with BrdU before encapsulation in the
PEGDA gel with 5 kPa modulus and the intensity of BrdU staining was compared with
those cells cultured on ultra-low-attachment plates. Figure 3.8 compares BrdU staining of
4T1 cells in suspension culture on ultra-low attachment plates (Fig 3.8 A, C) with those
encapsulated in PEGDA hydrogels (Fig 3.7 B, D). Images A and B in Figure 3.8 are after
8 days of culture while images C and D are after 14 days. After 8 and 14 days, cells
encapsulated in the gel displayed higher level of BrdU retention than those in suspension
cultures, suggesting that the encapsulated tumorspheres had higher fraction of CSCs.The
expression of breast CSC markers for tumorspheres grown in PEGDA gels with different
moduli is shown in Figure 3.9. Figure 3.9A–D shows the expression of CD44, CD24,
ABCG2, and SCA1 for 4T1 cells. ABCG2 of ABC transporter proteins is responsible for
CSC drug resistance and SCA1 (stem cell antigen-1) is a cell surface protein known to be
associated with breast CSCs [87-89]. CD44 and ABCG2 are well-studied markers in both
mouse and human breast CSCs [90, 91]. Although CD24 - is also a marker often used as
a breast CSC marker, recent studies indicate that both CD44 + /CD24 - and CD44 +
/CD24 + cells display CSC phenotypes in breast cancer cells [92]. 4T1 cells in the gel
with elastic modulus of 5 kPa had the highest CD44 expression and lowest CD24
expression for all time points. CD44 expression of 4T1 cells initially increased and
reached a maximum at day 8 for 2 and 5 kPa gels and at day 11 for 25 kPa gels. CD44
38 3.2.5 Tumorsphere marker expression
Figure 3.8 BrdU staining of 4T1 tumorspheres formed in suspension culture on low-adhesion plates (A, C) and formed by encapsulation in PEGDA hydrogels (B, D). Images (A) and (B) are after 8 days of incubation while images (C) and (D) are after 14 days. The presence of BrdU in the cells was confirmed by immunofluorescentstaining (green). The cell nuclei were stained with DAPI (blue).
moduli of 50 and 70 kPa did not show an increase in CD44 expression in 14 days. At day
8, CD44 and ABCG2 expression of 4T1 cells increased by 2.2 and 1.8 fold with increase
in gel modulus from 2 to 5 kPa, respectively. Figure 3.12 illustrates the effect of modulus
on the expression of two of these CSC markers for human cancer cell lines in time. CD44
has been extensively used in CSC identification and characterization for different human
cell lines [93-96].Figure 3.12 demonstrates the expression of CD44 and ABCG2 –an
ABC transporter protein that is responsible for breast CSCs drug resistance– in MCF7
39
Figure 3.9 Effect of gel elastic modulus on the relative mRNA expression levels of CD44 (A), CD24 (B), ABCG2 (C), and SCA1 (D) markers of 4T1 cells encapsulated in PEGDA hydrogels with incubation time. The mRNA expression levels of the markers for 4T1 cells before encapsulation were used as reference (set equal to one).
MCF7 cells encapsulated in the gel with elastic modulus of 5 kPa expressed the highest
level of CD44 and ABCG2 proteins at both time points of 6 and 9 days. The expression
for these markers maximized in 5 kPa gels and then decreased sharply at stiffer gels. This
biphasic behavior was also observed in MDA-MB-231 breast cancer cell line. Cells had
the highest expression of CD44 and EGFR –a cell surface protein associated with CSCs
population– at 5 kPa and significantly lower expression in other moduli.