1038 Patients queue In physician Service End Queue
Figure 1 : Basic Queuing Representation
Optimized Server Utilization In Multi Speciality
Hospital By Using The Queuing Model Through
Iot
K.Thiyagarajan, Dr.K.Mohan Kumar
Abstract: In modern multi-speciality hospital the need for sorting out patients in a queue and optimising the time in the entry stage is an essential activity. This activity can do quick and effective treatment to the patients. At present, the queuing system found in the hospital is chaotic and disorganised. This includes increased waiting time in queues, time delay for the patients and queue cutting by individuals due to unorganised queuing systems. This research work gives a solution to these problems by creating an Internet of Things (IoT) based environment in a multi-speciality hospital for initial data entry. IoT environment performs initial data entry of patients, functions of sorting out patient‘s queue and sends them to general physicians for treatment and diagnosis in a neat manner. The use of IoT and machine learning devices help to streamline the current system by the use of a Cloud based medical History (CBMH) database. This helps to access error free data quickly and also eliminate the usage of phony data given by the individuals. Here the queue sorting is done by the IoT devices through the optimized study of different types of queuing methods such as the single server queue, multi-server parallel queue and On Demand queue. The various performance parameters like queue length, number of servers and service rate are analysed for the different queuing systems and the most efficient queuing method is selected for the current situation.
Keywords : Cloud Based Medical History (CBMH),Internet of Things (IoT),Mechine Learning ,Multi Speciality Hospital, On Demand Queue, Queuing Model, Server Utilization
—————————— ——————————
1.
INTRODUCTION
In the modern age, people do most of the interactions via computer systems and other machines. In this form the machine-human interaction is involved. So, this form of communication is known as machine-to-human communication. But in future, the need of humans to interpret and reinstate the data will be avoided by use of machine-to machine interaction. This reduces the time delay caused by human intervention. In the near future the result of advanced developments in artificial intelligence will remove the human intervention and thus the man made errors and allow the machines to interpret the data and cause machine- machine learning. This is called Internet of Things (IoT). The term ―Internet of Things‖ was coined by Kevin Ashton in 1999.The aim of IoT is to create a smarter world for efficient and faster data transfer using a common infrastructure to conjugate everything in the world. This will make it easier for data transmission and help to optimize the time delay. The Internet of Things is the interconnection of uniquely identifiable embedded computing devices within the existing Internet infrastructure. In IoT the semantic origin of the expression is composed by two words ―Internet‖ and ―Thing‖, where ―Internet‖ can be defined as ―The world-wide network of interconnected computer networks, based on a standard communication protocol, while ―Thing‖ is ―an object not precisely identifiable Therefore, semantically, IoT means
―a world-wide network of interconnected objects uniquely addressable, based on standard communication protocols‖ (Infso D.4 Networked Enterprise & RFID Infso G.2 Micro &
Nanosystems ). The connection of real world objects into
machine understandable form is done via the use of an RFID tag and many other sensors. This eliminates the need to enter the data and monitoring activity. These smart devices can interact with each other and to retrieve data without the need of human intervention. (Chad Brooks)
Queuing Representation
The basic idea of a queue is to provide a systematic and structured approach to sort people based on the precedence of their respective time of arrival. Queue occurs when the service time of a node is greater than the arrival rate, causing a queue waiting time for the individuals. Therefore, a queue offers a structured approach to assign preference to nodes; this eliminates chaos in the service operation. Real world queues follows a FIFO (First in First out) approach, the first node to come in is serviced first and the node to come in latest is added to the end of the queue. In computer analogy and certain industry based requirements offers different type of techniques such as LIFO (Last in First out), priority first and random queue. Queuing representation is the mathematical representation of the queue that is present according to the nature of the problem, and various performance factors which are calculated. The queuing systems are of various types. The nature of a queuing system depends on the following factors:
* Entry rate * Service rate * Number of servers
* Maximum number of nodes * Algorithm of queue
Entry rate: There are different types of entry patterns that exist in the world. Based on the nature of the problem, the entry may be at a constant rate, exponential or random in nature. In real world problems as in those of banks, shops and hospitals ————————————————
Mr. K.Thiyagarajan is currently pursuing Ph.D as a full time research scholar in PG and Research Department of Computer Science, Rajah Serfoji Government College, Thanjavur, Bharathidasan University, T.N, India. PH-6381330329. E-mail: [email protected]
Dr.K.Mohan Kumar, Research Advisor and Head, PG and Research Department of Computer Science, Rajah Serfoji Government College, Thanjavur, PH-. 9443805042. E-mail:
1039 the arrival rate is random, but in order to provide a
mathematical modeling of the problem the random rate is averaged over time and treated as constant. It is denoted by the Greek symbol λ . Service rate: The service time of a product may also be different based on various parameters. The service rate may be constant or variable in nature. There are different approximations of various service rates. It is denoted by the Greek symbol μ. Number of servers: The number of servers that are present in the end of the queue may be 1 or more than 1. Maximum number of nodes: In certain queues the maximum number of the queue length is fixed and it cannot be changed. Most of the queues in real world problems allow infinity capacity of the queue. Algorithm: The Queue structure may follow different approaches such as the FIFO and LIFO approach and this decides the nature of the queue.
II. LITERATURE SURVEY
Vladimir V. Mazalov (Petrozavodsk) Andrei Gurtov (Espoo) proposed a queuing system where the number of active servers is dynamically adjusted based on the queue length. The authors analyzed the system using the Kolmogorov differential equations and obtained upper bounds on the average waiting time, queue length and number of active servers. Vladimir V. Mazalov (Petrozavodsk) Andrei Gurtov (Espoo) proposed system can model the security check procedure at airports. The simulation model shows a close match with analytic results using real world data from Dallas – Fort Worth International Airport. Using our model permits costs savings by limiting the number of active servers (security checkpoints) while providing an acceptable waiting time for the customers with high probability. Mohammed Ghazal, Rania Hamouda and Samr Ali proposed a smart queue management system for delivering real-time service request updates to clients‘ smartphones in the form of audio and visual feedback. The system aims at reducing the dissatisfaction with services with medium to long waiting times. To this end, the system allows carriers of digital ticket to leave the waiting areas and return in time for their turn to receive service. The system also improves the waiting experience of clients choosing to stay in the waiting area by connecting them to the audio signal of the often muted television sets running entertainment programs, advertisement of services, or news. The system is a web of things including connected units for registering and verifying tickets, units for capturing and streaming audio and queue management, and participating client units in the form of Smartphone applications. The system implemented the proposed system and verified its functionality and report on our findings and areas of improvements
III. METHODOLOGY
This research paper analyzes a way to optimize the hospital management system by fine tuning the initial data entry stage. The initial data entry stage of the hospital refers to the stage where the personal details of the patients are entered in a form. This stage can be done by IoT devices and thus won‘t allow the system to create the redundant data. This is done by storing the patient‘s data in a database by using an RFID tag or via the patient‘s thumbprint. This process not only eliminates the time taken for initial data entry, also provide a channel to store the data into cloud based medical history (CBMH) of the patient and retrieve the data from CBMH for subsequent use. The RFID tag links into the server to retrieve
the patient‘s personal information with medical history and given to the physician. These files are stored in encrypted form because of its sensitivity. So, the information can only be opened by authenticated medical licensor. This contains the patient‘s latest medical information such as the patient‘s allergies, present medications taken and blood group details which are used to help the doctor to further understand and study the physical condition of the patient and provide a ample treatment. The RFID tag is read automatically at the entry by a scanner or the patient‘s thumbprint can be acquired at multiple access points within the hospital premises to automatically enter the patient in to the virtual queue for general checking. It is not necessary for the patient to be physically present in the queue if the estimated waiting time is more than 5 minutes. This time can be used by the patient for recreational activities within a certain range of the hospital and avoid time wasting and rather annoying concept of waiting in a queue. Once the patient‘s entry data is obtained by the system and enrolled in the queue, the machine uses a virtual queuing system which is mathematically modeled to provide the patient's estimated waiting time and also has the responsibility of informing the hospital management to increase the number of servers in case of an higher estimated waiting time. The server starts by using a single server queue, but when the number of patients exceeds a certain limit, the IoT devices start to request the management for an extra server by intimating them the extra waiting time. This causes the management to increase the server and therefore the device can improve both the quality of medication and satisfaction of the patient. By using the data from the previous history the system can also predicts the number of patients to come in a particular timeframe and keeps the hospital notified for availing an extra server. This is done based on Kendall‘s theory of notations and is carried out in the system. That is the increase on number on servers based on the queue length. This can be solved by the Queuing model. A Queue with Poisson arrival, exponential service time , single server and FIFO (First in First Out queue discipline.
ρ = λ/µ is called the utilization factor
Here , λ = mean rate of arrival, It is equal to 1/E[Inter-arrival-Time] where E[.] denotes the expectation operator
1040 of servers in a hospital based on the time and cost analysis.
Data CollectionThe sample data is collected from Thanjavur medical centre in Thanjavur, Tamil Nadu, India. The following Table 1 is the average number of patients visiting the hospital in the past three weeks. A Table 1 is constructed for the average number of patients each hour in each day of the week.
Table 1: Average Number of Patients arrival in Queue
Time
Average number of patients in last 3 weeks
Mon Tue Wed Thu Fri Sat Sun
7-8 am 12 13 11 9 13 11 11
8-9 am 11 11 12 11 13 13 11
3-4 pm 11 11 12 10 11 13 13
4-5 pm 12 11 11 10 11 14 11
5-6 pm 14 15 14 13 14 13 13
6-7 pm 18 17 18 19 19 19 19
7-8 pm 20 19 21 25 21 21 19
8-9 pm 19 18 17 13 17 18 19
9-10 pm 15 15 13 10 14 21 16
By using the above data set in Table 1, different queuing models performances are calculated. The time chart is drawn by assuming the arrival rate to follow a Poisson‘s relationship and the service rate to be constant, so that it forms an exponential relationship. Since the given case is for the general treatment division of a multi-speciality hospital these assumptions can be justified and the data sets are calculated. Another assumption is, in the following data sets the service is continuous, that is there is no idle time between the services of two patients. Using these datasets for the different models, their characteristic parameters such as Utilization, Server Idle time and Patient waiting time are calculated to give an optimal solution which is benefit for both the patients as well as the hospital system. Proposed On Demand Queuing Model through IoTThe following Figure 2 shows the real time use of the hospital management system prescribed by this paper. The first step in the hospital management system is the access of the RFID tag by the receiver or the acquisition of the patient‘s thumbprint by the access point. This accesses the Cloud based medical history of the patient which is present in an online database. Once this data is retrieved it is stored in the doctor‘s monitor, so that it can be viewed by the doctor doing diagnosis of the patient. The data that is retrieved from the database is protected and can only be opened by a registered medical practitioner. If the data is properly entered, the database allows the physician to view and further add details to the medical database for future reference. This provides an updated and safe medical record for the patient. Since the patient can be someone who isn‘t aware of medical knowledge and unable to communicate the past treatment history , this allows an efficient way of information transfer. The patient is enrolled in a queue and is given a notification via RFID card or phone intimating that the patient is registered for treatment at the clinic. The patient has the option of cancelling the treatment or decline enrolment in the queue at any point of time and will be automatically removed from the process by fails to present in the allocated time. Once the queue is setup , the estimated waiting time of the patient is further updated and also notified to be physically present within 10 minutes before the waiting time. After the patient is enrolled in a queue the IoT device checks for the number of patients and
calculates the parameter λ. When the numbers of persons in the queue reach past the capacity of the server an extra server is added, hence it is an On Demand Queue. The numbers of servers increase accordingly with the number of patients and this allows smooth and flexible flow of the hospital management system.
Patient‘s Queue IN
QL <=6 QL>6
Queue Out
Figure 2: Flow of Dynamic server selection Through IoT
IV. RESULT AND DISCUSSION
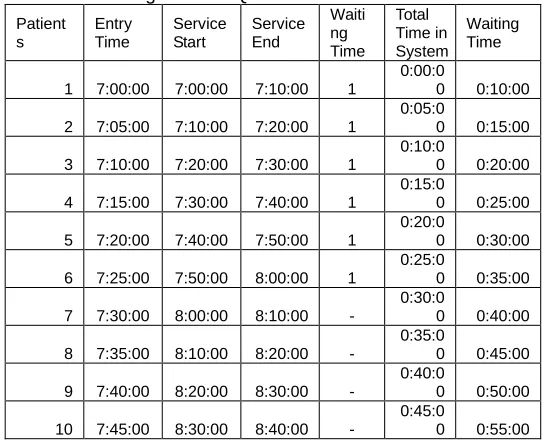
Single server queueThis type of queuing system take under consideration is the single server queuing system, where the patients in the queue are treated by a single general physician. This makes the patient stand in the queue and gives an estimated waiting time based on the parameters. As per the rules of queuing systems when the arrival rate is greater than the service rate and there is only one server, the queue tends to infinite.
Table 2: single server Queue of Patients arrival
Patient s
Entry Time
Service Start
Service End
Waiti ng Time
Total Time in System
Waiting Time
1 7:00:00 7:00:00 7:10:00 1
0:00:0
0 0:10:00
2 7:05:00 7:10:00 7:20:00 1
0:05:0
0 0:15:00
3 7:10:00 7:20:00 7:30:00 1
0:10:0
0 0:20:00
4 7:15:00 7:30:00 7:40:00 1
0:15:0
0 0:25:00
5 7:20:00 7:40:00 7:50:00 1
0:20:0
0 0:30:00
6 7:25:00 7:50:00 8:00:00 1
0:25:0
0 0:35:00
7 7:30:00 8:00:00 8:10:00 -
0:30:0
0 0:40:00
8 7:35:00 8:10:00 8:20:00 -
0:35:0
0 0:45:00
9 7:40:00 8:20:00 8:30:00 -
0:40:0
0 0:50:00
10 7:45:00 8:30:00 8:40:00 -
0:45:0
0 0:55:00 Single
Sever Queue
CBMH
IoT Controller
Find
QL (λ)
1041 11 7:50:00 8:40:00 8:50:00 -
0:50:0
0 1:00:00
12 7:55:00 8:50:00 9:00:00 -
0:55:0
0 1:05:00
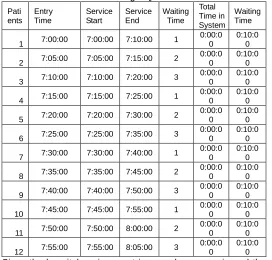
This is further proved by above Table 2 dataset. This Queue system can see that the waiting time exceeds 55 minutes for the last patient and that the physician is unable to look after more than 5 patients in the stipulated time. Therefore this method is useless due to the obvious disadvantage of this method of treating bulk quantities.Multi server parallel queueIn a multi-server queue there are ‗n‘ servers from the start of time. The number of servers that are required is calculated from the estimated number of patients in the given hour. The following Table 3 presents the single Queue multi server model data. This is obtained from the IoT device which stores the past details and estimates the expected attendance. The number of servers that are needed are pre calculated by the server and therefore the system can see that the waiting time is considerably reduced compared to the previous case. The problem with this type of queue is it‘s inability to handle varying strengths.
Table 3: Patients arrival in single Queue multi server model
Pati ents Entry Time Service Start Service End Waiting Time Total Time in System Waiting Time
1 7:00:00 7:00:00 7:10:00 1
0:00:0 0
0:10:0 0
2 7:05:00 7:05:00 7:15:00 2
0:00:0 0
0:10:0 0
3 7:10:00 7:10:00 7:20:00 3
0:00:0 0
0:10:0 0
4 7:15:00 7:15:00 7:25:00 1
0:00:0 0
0:10:0 0
5 7:20:00 7:20:00 7:30:00 2
0:00:0 0
0:10:0 0
6 7:25:00 7:25:00 7:35:00 3
0:00:0 0
0:10:0 0
7 7:30:00 7:30:00 7:40:00 1
0:00:0 0
0:10:0 0
8 7:35:00 7:35:00 7:45:00 2
0:00:0 0
0:10:0 0
9 7:40:00 7:40:00 7:50:00 3
0:00:0 0
0:10:0 0
10 7:45:00 7:45:00 7:55:00 1
0:00:0 0
0:10:0 0
11 7:50:00 7:50:00 8:00:00 2
0:00:0 0
0:10:0 0
12 7:55:00 7:55:00 8:05:00 3
0:00:0 0
0:10:0 0 Since the hospital environment is a random scenario and the number of patients visiting on a particular day depends on various factors, it is not advised to believe such assumptions. If the numbers of persons that arrive are less than the expected number, most of the servers get wasted (idle). Even though this means that there is the same waiting time, it is a waste in the usage of resources. There is also a loss of server utility as it has high server idle time. It results in higher losses to the hospital.
Demand Queue
Multi Server on Demand Queue using this form of queuing, an extra queue is added every time there is an excess waiting time or increase in the number of patients. The following Table 4 represent the On Demand Server depending on Queue arrival rate . Since the arrival rate λ is greater than 5 times of the service rate, there is an addition of an extra server only after there are 5 patients in the queue. This helps to have
efficient usage of the doctor‘s time, and also helps to maintain the waiting time to less than 10 minutes. This type of queuing system also has lesser dependence on previous data as it adds servers on demand, this enables us to have a more flexible system. It has a reasonable waiting time with more efficient uses of resources. It can help in handling varying loads and also has high utilization of server time. It also costs less as the server has 2 has worked for only 45 minutes, rather than an hour which reduces the cost of the server. This reduces cost and also makes it possible to provide medication to people at a lower cost with same profit margin.
Table 4 : On Demand Server depending on Queue Arrival rate
Pati ents Entry Time Service Start Service End Waiting Time Total Time in System Waiting Time
1 7:00:00 7:00:00 7:10:00 1
0:00:0 0
0:10:0 0
2 7:05:00 7:10:00 7:20:00 1
0:05:0 0
0:15:0 0
3 7:10:00 7:20:00 7:30:00 1
0:10:0 0
0:20:0 0
4 7:15:00 7:25:00 7:35:00 2
0:10:0 0
0:20:0 0
5 7:20:00 7:30:00 7:40:00 1
0:10:0 0
0:20:0 0
6 7:25:00 7:35:00 7:45:00 2
0:10:0 0
0:20:0 0
7 7:30:00 7:40:00 7:50:00 1
0:10:0 0
0:20:0 0
8 7:35:00 7:45:00 7:55:00 2
0:10:0 0
0:20:0 0
9 7:40:00 7:50:00 8:00:00 1
0:10:0 0
0:20:0 0
10 7:45:00 7:50:00 8:00:00 3
0:05:0 0
0:15:0 0
11 7:50:00 7:55:00 8:05:00 2
0:05:0 0
0:15:0 0
12 7:55:00 8:00:00 8:10:00 1
0:05:0 0
0:15:0 0
The following Table 5 compares the waiting time of patients in the three different types of queue model. The Table 5 views that in a single server queue, the waiting time is very high and the service is not optimal for more than 5 patients. The Figure 3 shows the graphical representation of Table 5.
Table 5 : Comparisons of the Patient‘s Waiting Time
Patients Multi Server on Demand Queue Multi server queue Single server queue
1 10 10 10
2 15 10 15
3 20 10 20
4 20 10 25
5 20 10 30
6 20 10 35
7 20 10 40
8 20 10 45
9 20 10 50
10 15 10 55
11 15 10 60
12 15 10 65
Figure 3 :Patient’s Waiting time
1042 constant, most of the servers are free at most of the time. This
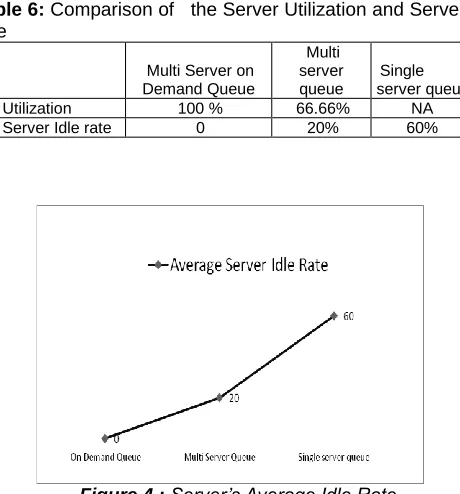
causes higher losses to the hospital because of higher server idle time. This increases the cost of the hospital functioning which thereby affects the overall cost of medication. This is also an important fact that must be taken under consideration while implementing the queuing model. This is proved by using the comparison Table 6 and Figure 4 below.
Table 6: Comparison of the Server Utilization and Server Idle rate
Multi Server on Demand Queue
Multi server queue
Single server queue
Utilization 100 % 66.66% NA
Server Idle rate 0 20% 60%
Figure 4 : Server’s Average Idle Rate
The above Figure 4 shows that the on demand multi server queue model is the best model for long queue because it provides cent percentage server utilization and zero idle rate.
V. CONCLUSION
In the queuing model , the single server queue waiting time is very high and the service is not optimal for more than 5 patients. While treating the multi-server queue it is seen that the waiting time is constant, but it is seen that most of the servers are free at most of the time. This causes higher losses to the hospital because of higher server idle time. This increases the cost of the hospital functioning which thereby affects the overall cost of medication. This is also a fact that must be taken under consideration during the implementation of queuing model. It is seen that the On Demand queue offers a trade-off between both the methods as it is seen that it has higher server utilization and also finds a way to keep the waiting time of a patient under control. This results in reduced costs, quicker and cheaper treatment of individuals where the method is used. Therefore the IoT device calculates the number of persons in the queue and notifies the hospital management when to add a new server and offers an optimal solution to the queuing system.
REFERENCES
[1] T. Lu and W. Neng, "Future internet: The Internet of Things," in Advanced Computer Theory and Engineering (ICACTE), 2010 3rd International Conference on, 2010, pp. V5-376-V5-380. [2] Chad Brooks "The Internet of Things: A Seamless Network of
Everyday Objects" Live Science Contributor ,July 31, 2013. [3] Infso D.4 Networked Enterprise & RFID Infso G.2 Micro &
Nanosystems "Internet of Things in 2020 - Roadmap for the future" Version 1.1 - 27 May, 2008
[4] Vladimir V. Mazalov and Andrei Gurtov "Queuing System with On-Demand Number of Servers" MATEMATYKA STOSOWANA [MATHEMATICA APPLICANDA 40 (2)] Vol. 15/56 p. 1–12 (2012),
[5] S. R. Chakravarthy A multi-server queueing model with Markovian arrivals and multiple thresholds. Asia Pac. J. Oper. Res., 24(2):223–243, (2007).
[6] E. Altman and P. Nain. Optimality of a threshold policy in the m/m/1 queue with repeated vacations. Mathematical Methods of Operations Research, 44:75–96, 1996.