Economic Evaluation of Large-Scale Biorefinery
Deployment: A Framework Integrating Dynamic
Biomass Market and Techno-Economic Models
Jonas Zetterholm1,∗ , Elina Bryngemark2 , Johan Ahlström3 , Patrik Söderholm2 , Simon Harvey3 and Elisabeth Wetterlund1,4
1 Luleå University of Technology, Department of Energy Engineering, Division of Energy Science, SE-971 87 Luleå, Sweden
2 Economics, Department of Business Administration, Technology and Social Sciences, Luleå University of Technology, Sweden
3 Chalmers University of Technology, Department of Space. Earth and Environment, Division of Energy Technology, SE-412 96 Gothenburg, Sweden
4 International Institute for Applied Systems Analysis (IIASA), Schlossplatz 1, A-2361 Laxenburg, Austria * Correspondence: [email protected]
Abstract:Biofuels and biochemicals play significant roles in the transition towards a fossil-free society. However, large-scale biorefineries are not yet cost-competitive with their fossil-fuel counterparts, and it is important to identify biorefinery concepts with high economic performance. For evaluating early-stage biorefinery concepts, one needs to consider not only the technical performance and process costs but also the economic performance of the full supply chain and the impacts on feedstock and product markets. This article presents and demonstrates a conceptual interdisciplinary framework that can constitute the basis for evaluations of the full supply-chain performance of biorefinery concepts. This framework considers the competition for biomass across sectors, assumes exogenous end-use product demand, and incorporates various geographical and technical constraints. The framework is demonstrated empirically through a case study of a sawmill-integrated biorefinery producing liquefied biomethane from forestry and forest industry residues. The case study results illustrate that acknowledging biomass market effects in the supply chain evaluation implies changes in both biomass prices and the allocation of biomass across sectors. The proposed framework should facilitate the identification of biorefinery concepts with a high economic performance which are robust to feedstock price changes caused by the increase in biomass demand.
Keywords:supply chain; partial equilibrium; biofuel; soft-linking; dynamic prices
1. Introduction
Lignocellulosic biorefineries producing biofuels and biochemicals are likely to play a significant role in the transition towards a fossil-free society, especially in forest-rich countries such as Sweden, Finland, and Canada [1,2]. Since sustainable biomass is a limited resource, it is important to optimize the environmental and economic performance of biorefineries [3]. Furthermore, large-scale biorefineries are not yet cost-competitive with their fossil-fuel counterparts, and early-stage evaluations are therefore needed to identify promising low-cost biorefinery concepts. This article proposes – and demonstrates – an interdisciplinary framework for conducting such evaluations.
A variety of design variables affect the economic performance of a biorefinery, such as choice of location, feedstock, conversion technology, and final product(s). These aspects are commonly included in assessments conducted using supply chain optimization models [4,5], which minimize the system costs for a given set of constraints. Typically, feedstock and product transport costs are determined endogenously, whereas biomass-to-product yields and feedstock prices are included exogenously. However, some supply chain modeling frameworks have also included selection of key process design variables [6,7]. While all main design decision variables are considered in these cases, the output may nevertheless be misleading since market price interactions are typically not acknowledged.
Firstly, the implementation of large-capacity biorefineries will affect a variety of feedstock prices due to the increased demand for the specific feedstocks used in the process. Secondly, the price signal from increased competition for a given feedstock will lead to a re-allocation of other feedstocks in the biomass market. This will result in complex price formation mechanisms for the feedstocks included in the model, which in turn means that the feedstock prices assumed in the supply chain evaluation model may no longer be valid when the concept is assumed to be deployed in large scale. Since biomass feedstock costs generally constitute a large fraction of a biorefinery’s total production costs [8,9], unrealistic assumptions regarding cheap and abundant feedstocks risk giving rise to misleading results [10]. Previous research has also highlighted that to fully assess the future environmental performance of emerging technologies, the system in which these will be implemented needs to be considered in full [11], this reasoning is extended to the economic performance in this work.
Uncertain price developments, if accounted for, are usually managed in supply chain modeling approaches of biorefineries or bioenergy projects through the use of various price and demand scenarios [6,12,13], or stochastic price processes to simulate future prices [14]. Relatedly, previous research has combined market analysis with techno-economic analysis [15], and vice versa [16]. However, these approaches do not consider the price dynamics caused by the change under evaluation, e.g., impacts on biomass feedstock prices resulting from the introduction of large-scale forest-based biofuel production, and/or the effects on other users. This has been acknowledged by Mustapha et al. [17], who combined economic modeling with energy system modeling to analyze the effects on the Nordic heat and power sector of large-scale forest-based biofuel production. The results showed significant impacts on the use of biomass for heat and power production, and the authors stressed the importance of accounting for the competition for biomass when evaluating large-scale introduction of bioenergy conversion technologies.
There is a current need for increased interdisciplinary efforts when assessing the performance of emerging biorefinery concepts [18], and disciplinary boundaries that limit the scope of analysis have been identified as a key challenge for sustainability assessments of biorefineries [19]. While there is a significant body of knowledge related to biomass-to-product yield estimations, supply chain evaluations, and biomass feedstock markets, there is, to the best of the authors’ knowledge, a lack of studies that combine knowledge from all three domains into a coherent analytical framework that can be used to evaluate the performance of biorefinery concepts.
integration of biorefinery concepts with different host industries can offer benefits regarding overall efficiency and economic performance [3,20–22]. In this context, existing forest industries are of particular interest due to the potential availability of biomass-derived by-products that can be used as feedstock, as well as significant experience in operating large-scale biomass supply chains. Therefore, we consider the possibility for the biorefinery to be co-located at existing industrial sites, including the need for appropriate descriptions of the integration synergy gains. The case study aims to explicate the differences in the economic performance of the biorefinery supply chain when considering endogenous instead of exogenous biomass prices.
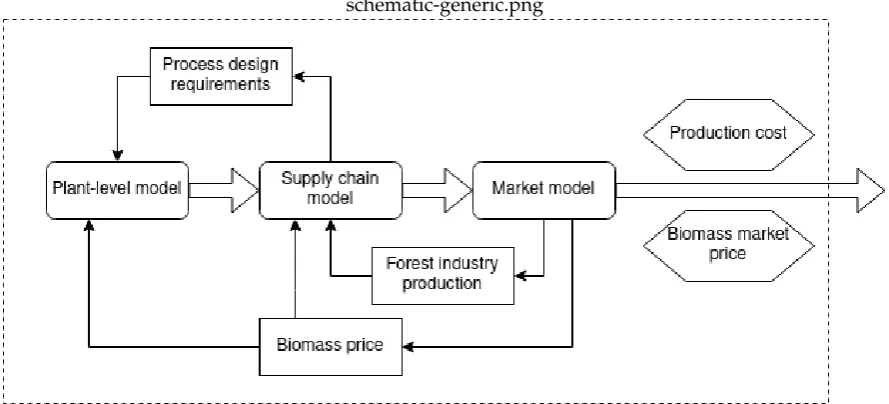
Figure1provides a general overview of the proposed modeling framework including the data flows between three generic models; a plant-level model for process evaluation (left), a supply chain model (in the middle), and a market model (right). The supply chain model feeds techno-economic data to the market model, which in turn provides market-based feedstock price data back to the supply chain model and to the plant-level model, for which new data is generated to the market model. After a sufficient number of iterations, the market model will generate new biomass equilibrium price. The economic performance can be assessed by testing different combinations of technologies and biomass feedstocks in an iterative process, as well as price changes in the forest and bioenergy sectors.
schematic-generic.png
Figure 1.Overview of the proposed modeling framework.
2. Evaluating biorefinery concepts: lessons from the literature
This section introduces the main perspectives used for evaluating the economic performance of integrated biorefineries. These perspectives include: 1) detailed plant-level process evaluation for identifying integration benefits, biomass-to-product yields and process costs, 2) supply chain considerations for identifying economically beneficial localizations and supply chain configurations, and 3) economic market modeling for identifying the biomass market impacts in terms of biomass prices. We also give a brief overview of examples of combined or integrated assessment approaches from the literature.
2.1. Techno-economic aspects
The full techno-economic system performance of a biorefinery concept depends on several decisions related to the supply chain configuration – from the supply side concerning the biomass feedstock to the final product. We differentiate between the methods needed to determine the plant-level performance, which relates to the choices of equipment and process parameters at each site, and the methods needed to quantify the supply chain performance. The latter includes plant-level performance but also decisions concerning, for instance, harvesting site, modes of transport, and localization of the facilities.
2.1.1. Plant-level aspects
A biorefinery generally includes biomass handling and pre-treatment units, followed by the main processing unit or units, which can be based on thermochemical or biochemical conversion. Thereafter, unwanted by-products are removed and the remaining components are converted to the desired end-product(s). The performance of the biorefinery will depend on the equipment and the chosen operating parameters, which determine the biomass-to-product yield and the plant’s energy and mass balances. It is also important to apprehend the plant’s investment cost as well as costs for integrating the plant at the host site.
Techno-economic evaluations are needed to assess the biomass-to-product yield, energy efficiency, and production cost [23–25]. Such studies typically investigate and/or optimize the production costs of a biorefinery process in a bottom-up model that includes detailed descriptions of process equipment and material and energy flows. The system boundaries are often limited to the process, thus ignoring both the supply-chain perspective and the biomass feedstock market impacts. This implies that, e.g., emissions and their related costs, and feedstock re-allocation and relative price changes that can be derived from an altered feedstock demand, are effectively excluded.
Plant-level models can be used for estimating the process capital costs (CAPEX) and operating costs (OPEX) including feedstock, utilities, operation and maintenance, and revenues from process by-products. The capital costs include the direct equipment purchase cost of each process unit as well as indirect costs such as costs for start-up, contingency, and installation. Biorefineries typically benefit from economies of scale, i.e. specific CAPEX costs decrease with plant size [31,32].
2.1.2. Supply chain aspects
The techno-economic performance of a biorefinery concept can be significantly affected by plant location. Plant-level evaluations commonly take into consideration detailed site-specific characteristics. However, these characteristics can vary significantly between different sites, e.g., in terms of feedstock availability, regional characteristics, modes of transport, localization of potential host industries for integration (and their characteristics), and the prevalence of competing biomass users, which can impact the total supply chain costs [33–35]. These variables affect transport costs which can constitute a significant part of the total cost of the supply chain configuration [36,37]. It is therefore important to include the decision variables affecting the biomass transport cost when evaluating the total biorefinery supply chain cost.
The configuration of the supply chain considering these decision variables can be analyzed using supply chain optimization models. These models can include a variety of components, e.g. supply chain design, planning and operation, technology selection, and different environmental sustainability metrics [35]. The aim is to capture larger fractions of the costs and emissions that occur for a biorefinery concept, and that is typically not addressed in plant-level evaluations.
The supply chain optimization models that investigate facility localization problem have mostly been implemented as mixed integer linear problems (MILP), where binary variables are used to represent the establishment of a facility at a given site, and the continuous variables represent the material flows in the studied system [38]. The MILP implementation is suitable both because it facilitates the representation of large-scale problems, and since it can be used to describe a large number of variations of the supply chain problem, including social and ecological objectives [39], as well as strategic, tactical and operational perspectives [40,41]. However, this approach requires a large number of decision variables to describe complex problems, and can, therefore, lead to long computational times [40,42]. MILP problems also have difficulties in incorporating supply chain uncertainties, such as demand fluctuations, biomass supply variations, and biomass price changes [41]. Moreover, due to the linear nature of the modeling approach, it is difficult to account for non-linear behavior, such as fully capturing the costs for increases in production capacity (economies-of-scale). This can be mitigated by using discrete capacity steps as inputs to the model; alternatively, the facility capacities can be determined outside the optimization procedure.
When using a supply chain model that includes not only the characteristics of potential localizations but also other industrial sites that compete for the same feedstock, it is possible to capture the changes in costs for transportation in the entire studied system [22,43,44]. Generally, such models rely on plant-level evaluations to determine the biomass-to-product yield and the investment costs (or investment cost function), which are used as exogenous input data. These types of studies typically minimize total system cost to identify economically viable biorefinery concepts.
2.2. Market aspects
Furthermore, the nature of the products sold in the biomass market differs. For our purposes, it is useful to distinguish between two main categories: main products and by-products. The main product alone determines the economic viability of a given plant; the by-product is instead produced in association with the main product (e.g., sawdust generated at a sawmill), and its price will not influence output decisions at the plant. This distinction is important for understanding supply behavior in the market. In particular, production of by-products is often comparatively inexpensive (since no joint costs are incurred), but since the supply is constrained by the output of the main product, the own-price elasticity of supply could be very low. For this reason, the by-product market price will increase significantly if the demand for the goods which use the by-products as inputs increases [45]. Two key points can be made concerning the competition for feedstock in the context of novel biorefinery concepts [46]. Firstly, to be economically attractive for the production of new end products, the biomass feedstock must be priced low enough so that it can compete financially with, most notably, fossil fuels as feedstock (e.g., in the transport sector). Secondly, the financial returns on biomass feedstock production must be high enough to allow the suppliers of the processed biomass-based products to compete with alternative users for the required biomass resources. In other words, if a by-product is to be allocated to the production of, e.g., liquefied biomethane (see Section4), this sector’s willingness to pay for the by-product must be higher than the corresponding willingness to pay of actors that manufacture other products (e.g., particleboard) using the same feedstock. A high willingness to pay in one sector thus implies higher costs for these other producers, and in the case of by-products, this price increase can be significant, as discussed above.
To analyze how the introduction of new biorefinery concepts will affect prices and resource allocation patterns in biomass markets, it is necessary to adopt an economic model that addresses the demand and supply conditions for all feedstocks and products in these markets. For this purpose, the partial equilibrium (PE) modeling approach can be adopted, which has been used extensively for the analysis of forest product markets [47–53]. In PE modeling, market behavior is often described using supply and demand functions with some pre-defined behavioral parameters, e.g., price elasticities. By maximizing the sum of producer and consumer surplus under certain restrictions (e.g., biomass feedstock constraints), the model is solved and endogenous feedstock prices and resource allocation patterns are generated. A common approach is the so-called activity analysis in which input-output (IO) coefficients define the inputs used to produce one unit of output [54]. A PE model can contain many IO coefficients for many combinations of feedstocks and end-use products, including also various locations.
While PE models typically address the interactions between a selection of economic sectors, so-called Computable General Equilibrium (CGE) models provide a consistent description of how all sectors of the economy interact following changes in relative prices. Such models also include the public sector and address the impacts on the national budget. CGE models can, therefore, be particularly useful when analyzing the effects of changes in economy-wide policy instruments, such as carbon and energy taxes. Thus, in studies focusing less on the specific behavior of the biomass market and more on the domestic effects of biofuel policies, CGE models are often used [55–57]. However, the ability to describe all feedback mechanisms in the overall economy is often associated with less-detailed representations of the key sectors of interest. For our purposes, it is important to as far as possible avoid the latter, and for this reason, the PE modeling approach will constitute one component of the proposed framework.
2.3. Integrated assessments
as a suitable approach to assess the overall sustainability of biorefinery and bioenergy processes and systems; it enables the simultaneous inclusion of biophysical, economic, and social factors [61]. Multi-objective optimization approaches can be used to analyze trade-offs between different objectives in biorefinery supply chains [62,63].
However, the price dynamics of the biomass feedstock and the associated by-products, as triggered by the introduction of large-scale biorefinery production, have largely been excluded in previous research. The importance of accounting for such price dynamics when evaluating forest biomass systems was demonstrated by Mustapha et al. [17], who hard-linked a PE forest sector model with a PE energy model to analyze the effects on the heat and power sector following large-scale forest-based biofuel production. The results indicated that disregarding the competition for the biomass feedstock might lead to an over-estimation of future bioenergy production levels.
When hard-linking models (“formal linking”), the models are fully integrated and used to solve a simultaneous optimization problem, i.e., the constituent models are merged into a single model with a single objective function (compare multi-objective optimization). An alternative to this approach is so-called soft-linking (“informal linking”), which is characterized by an iterative process where the models are optimized or solved separately and data are then exchanged between the models. According to [64], the main advantages of soft-linking are practicality, transparency, and learning, and those of hard-linking are productivity, uniqueness, and control. Hard-linking often implies a simplified description of one or both of the sub-models, whereas soft-linking enables the complexities of even relatively large sub-models to be kept more or less intact [65,66]. Furthermore, soft-linking provides flexibility regarding the choice of interacting models and has been shown to work successfully for the linking of marked-based (PE or CGE) models with techno-economic energy system models [67–69]. Soft-linking thus offers the potential to combine the respective strengths of a detailed technology representation in energy system models, with the market price formation in PE models.
3. An inter-disciplinary modeling framework: a proposal
Our proposed interdisciplinary modeling framework combines techno-economic approaches and a market approach to evaluate biorefinery concepts accounting for endogenous feedstock price formation. To illustrate key theoretical aspects in techno-economic and market evaluations, respectively, we first present three schematic modeling approaches and describe the iteration of models with different modeling structures and objective functions. While our framework and the case study focus on the evaluation of forest-based biorefineries based on thermochemical conversion pathways, other biorefinery routes could also be evaluated by adapting the included models and input data.
The framework is constructed with three central key performance indicator (KPI) categories in mind: (i) biomass feedstock prices, (ii) biomass feedstock allocation and production levels among sectors and industries, (iii) and production costs for the biorefinery products. These are chosen to provide insight into the market effects related to implementing biorefinery concepts, as well as to gain information regarding the production cost of the end-use products of interest. However, the KPIs may be exchanged depending on the purpose of the application of the framework.
3.1. Plant-level and supply chain modeling: techno-economic performance
The first step to identify the full techno-economic performance is the evaluation of the plant-level process configuration, which is needed to determine both the mass and energy balances and the required capital investment. This can be challenging when evaluating emerging biorefinery technologies and concepts, where reliable data can be difficult or impossible to obtain [70]. If sufficient information about the process is available, we advocate the application of process heat integration methods (e.g., pinch analysis) to estimate the minimum net energy that needs to be added to the process [71]. This is recommended when designing integrated production systems, where special emphasis shall be put on the efficient use of energy and minimization of environmental impacts [72]. The proposed modeling framework includes the capability to account for the exchange of heat between the biorefinery process and the host industrial site. Process integration methods and tools can also be used to guide modifications to the energy system of the host process. Heat integration of a biorefinery plant at the host site can often result in a combined primary energy usage that is lower compared to stand-alone operations of the two process plants. Furthermore, some types of biorefinery may have a total heat surplus that is large enough and at a sufficiently high temperature to enable electricity generation in a high-efficiency steam turbine cycle.
Figure 2. Overview of the plant-level process model of a generic forest biomass-based biorefinery integrated with a host industrial process plant. For a stand-alone application of the plant-level model, see [20].
The output data from the plant-level process model includes biomass conversion yield, i.e., the quantity of biorefinery product(s) produced per quantity of biomass input, together with the net energy balances. Together with capital cost data and the running costs of the process, this constitutes the input data to the market and supply chain models, respectively.
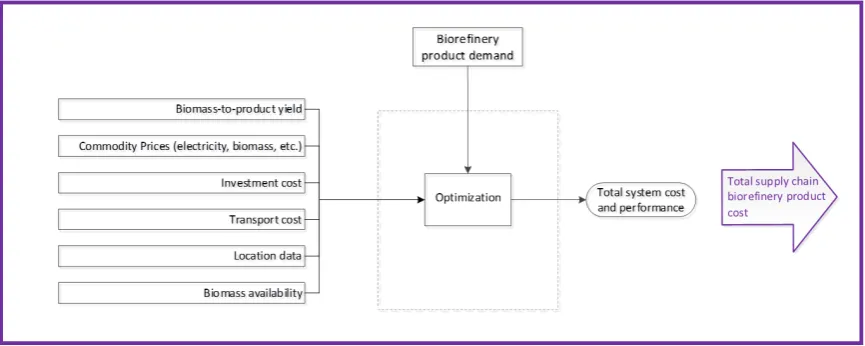
The next step is to apply a supply chain optimization model, which also considers procurement of the biomass feedstock, including transport, as well as changes in supply for other industries due to the new biomass demand of the biorefinery. We propose the use of a geographically explicit MILP model for the analysis of the localization of biorefineries, given that the model must be able to handle both geographical aspects, such as the spatial distribution of biomass supply and demand and the potential locations and plant configurations that were determined in the plant-level model. The system performance can thus be determined considering various geographical restrictions, not only due to net feedstock availability but also due to restrictions related to integration opportunities. Figure3presents a schematic overview of the inputs and outputs of the supply chain model.
Figure 3.Overview of the suggested supply chain optimization model. Data in the left-hand boxes are exogenous parameters to the model. For stand-alone applications of the supply chain model, see, e.g. [22,44].
the biorefinery supply chain configuration with the lowest total system cost, and in this way, the system performance cost of various biorefinery concepts can be determined. Depending on the design of the study, a multi- or single-technology problem can be investigated; the lowest cost solution could result in one or more biorefineries needed to satisfy the product demand.
In the proposed modeling approach, the total system cost includes all supply chain costs addressed in the model, e.g., transport costs, feedstock costs, technology costs, etc. The total transport cost is endogenously determined in the supply chain model depending on modes of transportation and transport distances. To limit the size of the total problem to be solved, we propose that the electricity market is handled exogenously and viewed as a fixed demand market. This entails that surpluses or deficits of electricity at biorefineries are assumed to be resolved by selling or purchasing electricity.
The output from the supply chain model is a set of biorefinery localizations and concepts that achieve the lowest total system cost. From this output, the system performance for each biorefinery site can be determined. The biorefinery performance costs are then used as inputs to the market model.
3.2. Market modeling: feedstock allocation and prices
The contribution of the market model in this framework is to allow for endogenous price formation of biomass feedstock considering the competition for the biomass. Key output variables from the market model are biomass feedstock allocation and prices, and biorefinery production costs and production levels. We propose to use a single-country generic PE model describing, for instance, the forestry and bioenergy sectors covering the same geographical scope as the supply chain model, to investigate price formation in the forest biomass market. The reason for choosing a PE model is that it allows for disaggregated data, which is desirable in the context of the forest biomass markets with many products and actors. The proposed modeling structure is similar to several previous PE forest sector models [17,54,73]. It is a microeconomic model focusing on a single country’s forest biomass market. The demand for end-use products and energy is exogenous, whereas production, conversion, and demand and supply of intermediate products are endogenously determined. International trade is represented through trade with one aggregate region (‘rest of the world’), which is a competitor to the domestic regions.
Figure 4.Overview of the suggested forest biomass market model. Supply of raw forest biomass and demand for energy and forestry end-use products are expressed exogenously to the model, shown as the upper and lower box, respectively. PPI = Pulp and paper industry. For a stand-alone application of the market model, see [47].
The objective of the market model is to maximize social welfare, i.e., the producer and consumer surplus, and to identify the corresponding optimal allocation of biomass given the exogenously given demand and supply constraints. This in turn generates endogenous feedstock prices, which can be fed back to the supply chain model and the plant-level model. For a policy scenario in which a given quota of, e.g., all transportation fuel must come from forest biofuels, the market model will choose the least-cost option to produce both forest industry and energy products given this constraint. This will lead to a reallocation of feedstocks and will therefore also affect the biomass market prices.
3.3. Integrated assessment: overall economic performance
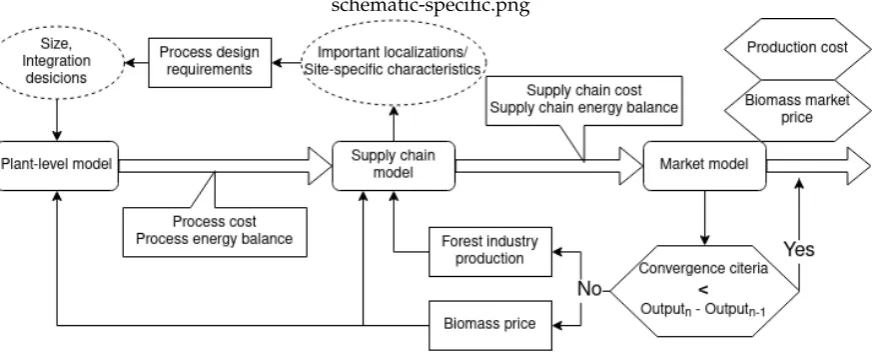
Figure5provides an overview of our suggested iterative model-linking process between the three different models. This enables the evaluation of the performance of various biorefinery concepts using techno-economic evaluations while at the same time considering changes in feedstock prices associated with the introduction of the biorefinery concept(s).
schematic-specific.png
Figure 5.Iteration procedure of the modeling framework.
integration. It is particularly important to make sure that biomass assortments are classified into the same categories in the supply chain model as in the market model. In addition, differences related to spatial resolution must be managed. In our case, the supply chain model includes exogenously determined plant-specific data and also generates plant-specific output data, whereas the market model is aggregated on sectors and large geographical regions. Our proposed solution is to adjust the output data from the supply chain model before entering the market model, by aggregating the supply chain model results per biorefinery technology and type of host. By creating a single cost for conversion for each process technology and industry type, rather than for each process technology and specific industry localization, some discrepancy between the technology representations in the supply chain and market model will occur. However, by using this approach, the specific site characteristics are implicitly included also in the market model.
The iteration procedure, as shown graphically in Figure5, can then be summarized as follows:
1. Biorefinery product yield and derived overall plant mass and energy balances are the main output data from theplant-level model. Together with the inventory of heat integration opportunities and process plant costs (CAPEX and OPEX), they constitute the input variables to the supply chain model.
2. Together with biomass prices from the market model, thesupply chain modelwill identify the technology mix that satisfies the demand for the specified biorefinery product at the lowest cost. 3. The biomass prices and industrial production levels determined through the market model
constitute new input data to the supply chain model through an iterative feedback loop 4. The new biomass prices influence the performance cost for the different technology options in the
supply chain model, which may in turn influence the lowest-cost supply chain configuration. If the new cost-minimizing supply chain differs from the previous solution, the resulting biorefinery technology choices and localizations constitute an input to theplant-level modelthrough a second feedback loop.
5. The new results from theplant-level modelingagain constitute inputs to thesupply chain model, and the latter will generate an updated performance cost. These new results provide updated biomass requirements and cost data to themarket modelthat generates new biomass prices and allocation to competing sectors.
6. For each iterationN, the new biomass prices and forest industry production levels determined by themarket modelare compared to the results generated in iterationN-1When the results from at iterationNdiffers from the results from iterationN-1by less than the specified convergence criterion, the solution is assumed to have converged. The biomass price, forest industry production levels, and biorefinery product costs of the last iteration are retained as the final resulting output data.
4. Case study: demonstrating the framework
The proposed integrated framework is demonstrated for a case study of a biorefinery concept integrated with a sawmill. The biorefinery produces liquefied biomethane (LBG) through gasification of forest biomass is followed by downstream conditioning and synthesis of the product gas. The case study aims to highlight the differences in the economic performance of the biorefinery supply chain when using exogenous biomass prices and forest industry production levels (current-exogenous biomass market scenario), and when the changes in biomass prices and forest industry production levels are endogenized (iterative-endogenous biomass market scenario)by applying the iterative soft-linking framework. The geographical scope is the national borders of Sweden, and the analysis is static over one year.
As described above, both the supply chain model and the market model are driven by an exogenously determined biorefinery product demand. We set the demand for LBG to be 4 TWh/a, assuming it to be used in the transport sector. This can be compared to future fuel usage scenarios for the Swedish transport sector, which include up to 4.2 TWh/a of gaseous biofuels by 2040 [74], and to the recent Swedish biomass market state public inquiry, which proposes a production target for non-aerobic digestion-derived biogas of 3 TWh/a by 2030 [75].
The biomass assortments allowed for the production of LBG are limited to forest and forestry industry by-products, tops and branches, industrial by-products, and wood chips. This complies with the EU renewable energy directive (RED II), which restricts the use of primary biomass for biofuel production [76].
As the focus of the case study is to demonstrate the soft-linking between the supply chain and market model, the option to modify the site-specific configuration – i.e., the “process reconfiguration” feedback loop in Figure5– is excluded from the analysis.
4.1. Applying the modeling framework
4.1.1. Plant-level model
Two different site-specific configurations for sawmill integrated LBG production are considered. Both were pre-optimized using different heat-integration targets, as described in a previous publication by several of the authors [20]. The configurations are:
• Configuration A: All sawmill residues. The LBG plant is sized to be able to process all by-products from the hosting sawmill. This allows the biorefinery to be self-sufficient regarding feedstock for LBG production and enables minimized transport costs for the LBG supply chain. • Configuration B: All sawmill residues excluding wood chips. The biorefinery is sized to be
able to process all by-products from the hosting sawmill except the wood chips. This restriction recognizes that this assortment constitutes an important feedstock for the domestic pulp and paper industry.
Both biorefinery configurations are allowed to use harvesting residues (tops and branches) as feedstock. In both cases, the excess heat from the biorefinery is used to cover a portion of the hosting sawmill’s heat demand for product drying.
4.1.2. Supply chain model
integer linear programming (MILP) model written in GAMS using CPLEX as a solver. For a more detailed description, see [44,77,78]. The objective of the model is to minimize the total system cost to satisfy the demand for domestically produced LBG, while simultaneously satisfying the exogenously defined biomass feedstock demand in the other industries (forest industry, stationary energy sector). The total system cost includes costs for biomass, transport and distribution, electricity, as well as CAPEX and OPEX for new plants.
4.1.3. Market model
The market model used is the Swedish forest sector trade model (SFSTM II), which is a PE model that simulates the Swedish forest biomass market (based on [79–81], including the Swedish forest sector, and the bioenergy-using heat and power sector and transport (biofuel) sectors. The model encompasses the national borders of Sweden divided into four regions, and an additional region covering trade with the rest of the world. The model is a nonlinear programming model written in GAMS using CONOPT as the solver, and the model objective is to maximize total consumer and producer surplus to obtain equilibrium prices, industry production levels, and resource allocation; see [47,81] for a more detailed overview of the model as applied in the chosen context.
4.1.4. Model linking
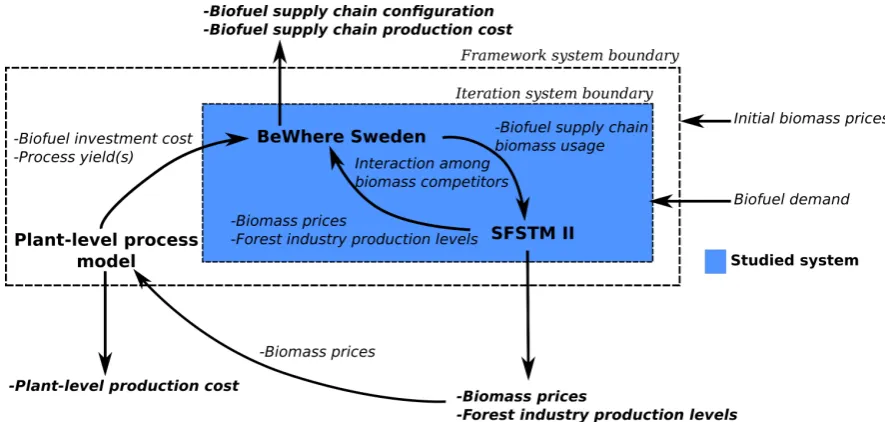
For the implementation of the soft-linking procedure involving BeWhere Sweden and SFSTM II, the following data are passed between the models:
• From BeWhere Sweden: biomass assortments and quantities used in the LBG production. • From SFSTM II: forest industry production levels and new equilibrium biomass prices.
The different output parameters from the different sub-models together with the data treated as exogenous to this study are shown in Figure6.
Figure 6.Schematic description of the iterative framework and the system studied in this case study.
Thus, in our case study demonstration, the iterative procedure proceeds according to the following:
2. BeWhere Sweden minimizes the total system cost while simultaneously satisfying a specified biofuel demand and the biomass demand from industries (which are dependent on their production levels). The specific biomass assortments used for producing the biofuel are used as inputs to SFSTM II to represent the biorefinery production technologies.
3. SFSTM II is used to simulate new biomass prices and forest industry production levels given the new biofuel production levels.
4. The iterative process (step 2-3) continues until the convergence criteria are fulfilled.
In this case study, convergence is assumed to have been reached when the normalized outputs from SFSTM II between two iterations differed by less than 10−5.
There are differences in how biomass assortments are represented in the different models. For instance, BeWhere Sweden distinguishes between biomass assortments from final felling and thinning, but not between different species, while SFSTM II has the opposite representation. To resolve this, price differences between biomass from final felling and thinning are removed in BeWhere Sweden, and the differences in prices between biomass species in SFSTM II are averaged against harvested volumes to be used as inputs in BeWhere Sweden. Likewise, the conversion of the biomass assortments used in LBG production from BeWhere Sweden is weight-adjusted for the representation in SFSTM II.
Differences occur also in the geographical representation of the models, and therefore all biomass grid cells in BeWhere Sweden assume the same biomass prices as the corresponding region in SFSTM II to which they belong. The industrial production is aggregated to a national level rather than keeping changes in industrial production region-specific.
4.1.5. Case study evaluation
After the iterative procedure, the total system cost from BeWhere Sweden is used to calculate the biofuel supply cost from the total system cost. The output from SFSTM II is used to identify the impacts on the forest industry production levels, and the new biomass market equilibrium prices. We then evaluate the effects of applying the framework by comparing the model outputs when using BeWhere Sweden only (current-exogenous biomass prices and production levels), versus when applying the proposed framework (iterative-endogenous prices and production levels). For this, we consider the converged industrial production levels and biomass prices from SFSTM II, as well as the total system cost and LBG cost of supply from BeWhere Sweden.
We also evaluate the effect of applying relaxation factors on the convergence of the framework by running the framework both with and without applying relaxation factors. The relaxation factors are applied on data passed in both directions. In this case, a maximum of 30 iterations is used as stopping criteria, applying relaxation factors of; 1, 0.5, 0.1, 0.05, respectively, where a relaxation factor of 1 means that no relaxation is applied. The convergence is then assessed by calculating the sum of the normalized differences in the output from SFSTM II based on the regional biomass prices and industrial production levels, with convergence defined as a change of less than 10−5.
4.2. Model input data
4.2.1. Biomass availability
4.2.2. Biomass prices and industrial production
SFSTM II consists of two sub-models: one trade-cost model that calibrates prices and feedstock allocation to a reference year, and one that simulates the prices and feedstock allocation is given the introduction of new biorefinery production. The trade-cost model maximizes the sum of producer and consumer surplus and yields the market equilibrium prices, production, and biomass allocation patterns assuming competitive markets. The reference year prices and industrial production levels are presented in Table1and Table2, respectively.
Table 1.Reference year (2016) market prices of biomass assortments and electricity.
Commodity Price[EUR/MW HLHV] Source
Electricity sold 29.1 [83]
Electricity purchased 41.7 [84]
Sawlogs
Pine 22.0
[85]b
Spruce 25.0
Non-Coniferous 21.6
Pulpwood
Pine 12.8
Spruce 12.2
Non-Coniferous 13.5
Industrial by-products Sawdust 24.4 [86]
Barka 11.0
Harvest residues (tops and branches) 17.1 [79]c
Wood chips 18.7 [86]
Pellets 25.7 [87,88]
a Assumed to be 20% lower price than sawdust on a volumetric basis.
b Roundwood prices in EUR/m3fub, before price calibration. The basic disaggregation into regions is based on the regionally disaggregated data [85], and then manually adjusted (with approximation) to the regions of SFSTMII. The conversion factor used for coniferous wood equals 0.458 m3fub/MWh, and the one for non-coniferous 0.386 m3fub/MWh [89].
c There is no official price data for harvest residues (tops and branches); instead the price of this assortment was based on estimations in [79,81]. The conversion factor used for tops and branches equals 0.208 tonDS/MWh [89].
Table 2.Reference year (2016) forest industry production levels, aggregated by product category (SDC, 2017; SFIF, 2015; Wiberg and Forslund, 2012).
Industry Product Production 2016
Pulp and paper industry Chemical pulp 7.81million tonnes Mechanical pulp 3.85 million tonnes
Sawmill
Sawn pine 6.7 million m3 Sawn spruce 10.4 million m3 Sawn non-coniferous 0.12 million m3 Pellets Wood pellets 1.7 million tonnes
4.2.3. Technology data
Table 3.Energy performance (LHV) of the biorefinery configurations, derived from [20]
Config. A Config. B
LBG produced[MWLBG/MWBiomass] 0.69 0.69
Electricity used[MWel/MWBiomass] 0.104 0.083
Electricity produced[MWel/MWBiomass] 0.057 0.155
Additional biomass for heating[MWBiomass/MWLBG] 0 0.042
Table4shows the overall investment cost function for the LBG facility, derived from data presented in [20].
Table 4.Reference year (2016) forest industry production levels, aggregated by product category (SDC, 2017; SFIF, 2015; Wiberg and Forslund, 2012).
InvestmentCost=a·Cb[MEUR2016]
a b
Config. A 0.014 0.73 Config. B 0.0283 0.69
For the economic evaluation in BeWhere Sweden, a capital recovery factor (used to annualize the investment cost) of 0.1 was assumed, e.g., corresponding to a discount rate of 8% and an economic lifetime of 20 years.
The biomass assortments allowed to be used for different activities in BeWhere Sweden are shown in Table5.
Table 5.Biomass assortments allowed to be used for different productions in BeWhere Sweden.
Biomass assortments
Demand sector Sawlogs Pulpwood Tops and branches
Wood chips
Industrial by-products
Waste
wood Pellets
Sawmills
(sawn products) x Sawmills
(heat demand) x x x
Pulp and paper
mills (pulp) x x x
Pulp and paper
mills (heat) x x x x x
Pellets
production x x
Stationary
energya x x x x x x
LBG
production x x x
a District Heating and Combined Heat and Power plants
4.3. Case study results
4.3.1. Biorefinery system performance
biomass use in the different industries and sectors, and Figure9the change in industrial production resulting from introduction of the biorefinery.
Sawl ogs
Pulpw ood
Tops
and B ranches
Ind. by -prod.
Wood
chips Pellets
Biomass assortment
0 5 10 15 20 25 30
Pri
ce
[E
UR
/M
Wh
]
Biomass market scenario
current-exogenous
config. A. iterative-endogenous config. B. iterative-endogenous
Figure 7.Biomass prices before (“current-exogenous”) and after (“iterative-endogenous”, relaxation factor = 1) the introduction of biorefinery production. Output from SFSTM II. Config. A = using all sawmill by-products, Config. B = excluding the wood chips.
Ch
em
.
ul
Mec
h.
u
l
Pel
let
s
Sa
wn
w
oo
d
Industry
−8
−6
−4
−2
0
Pro
du
cti
on
ch
an
ge
[%
]
Biomass market scenario
config. A, iterati%e
-endogenousconfig. B, iterative-endogenous
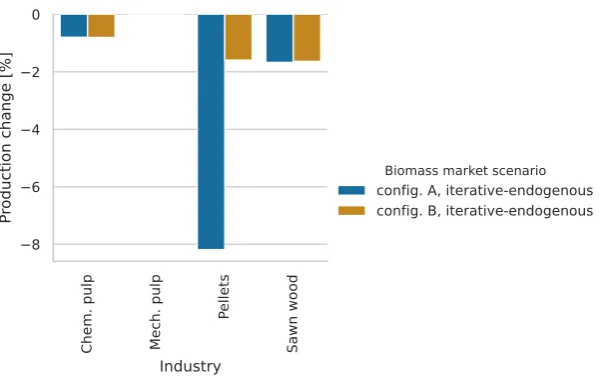
Figure 9.Change in forest industry production after the introduction of biorefinery production, when applying the iterative framework. Calculated from SFSTM II output. Config. A = using all sawmill by-products, Config. B = excluding the wood chips.
Interestingly, even though both technology configurations were sized to be able to be feedstock self-sufficient using only internal by-products, the cost-minimizing solutions also include biorefineries that import feedstock in the form of tops and branches. The reason is that the usefulness of tops and branches for other uses is lower than that of the by-product assortments, since they cannot be used for pulp production or pellets production.
The most prominent effect from the biorefinery introduction on existing industries is noted for the pellets industry. This is not due to a physical shortage of industrial by-products, as those are indeed available in sufficient quantities (Figure8). Instead, it is a result of the high feedstock market prices (Figure7), which render pellets production unprofitable. All biomass assortments allowed for the biorefinery production, i.e., industrial by-products, wood chips, and tops and branches, show a significant price increase when the LBG production is introduced. The price of pellets also increases due to the increase in feedstock prices, despite pellets not being used as biorefinery feedstock. In contrast, the production in both the sawmills and the pulp and paper industry is relatively unaffected by the biorefinery introduction, despite the potential new competition for feedstocks.
A B Config. 0
20 40 60 80 100
Su
pp
ly
co
st
[EU
R/M
Wh
]
Biomass market scenario current-exogenous iterative-endogenous
Figure 10.Total system supply cost of produced LBG when using exogenous and endogenous biomass prices, respectively. Output from BeWhere Sweden. Config. A = using all sawmill by-products, Config. B = excluding the wood chips.
4.3.2. Convergence and relaxation factors
21.5
22.0
Pri
ce
[E
UR
/M
Wh
]
Sawlogs
10.6
10.8
Pulpwood
20
22
24
Pellets
0
10
20
30
Iteration number
20
25
30
Pri
ce
[E
UR
/M
Wh
]
Tops and branches
0
10
20
30
Iteration number
10
20
Industrial by-products
0
10
20
30
Iteration number
10
15
20
Wood chips
21.5
22.0
Pri
ce
[E
UR
/M
Wh
]
Sawlogs
10.6
10.8
Pulpwood
20.0
22.5
25.0
Pellets
0
10
20
30
Iteration number
20
25
Pri
ce
[E
UR
/M
Wh
]
Tops and branches
0
10
20
30
Iteration number
10
20
30
Industrial by-products
0
10
20
30
Iteration number
10
15
20
Wood chips
relax=1
relax=0.5
relax=0.1
relax=0.05
0 5 10 15 20 25 30 Iteration
number
4800
5000
5200
5400
5600
5800
Tot
al
sy
ste
m
co
st
[M
EU
R]
Config. A
0
5
10 15 20 25 30
Iteration number
Config. B
relax=1
relax=0.5
relax=0.1
relax=0.05
Figure 12.Total system cost during the iterative process. Output from BeWhere Sweden. Config. A = using all sawmill by-products, Config. B = excluding the wood chips.
0
5 10 15 20 25 30
Iteration number
0
50
100
Sh
are
[p
ct]
Tops and branches
0
5 10 15 20 25 30
Iteration number
Wood chips
0
5 10 15 20 25 30
Iteration number
Industrial by-products
0
5 10 15 20 25 30
Iteration number
0
50
100
Sh
are
[p
ct]
Tops and branches
0
5 10 15 20 25 30
Iteration number
Wood chips
0
5 10 15 20 25 30
Iteration number
Industrial by-products
relax=1
relax=0.5
relax=0.1
relax=0.05
Figure 13. Biorefinery feedstock composition during the iterative process. Output from BeWhere Sweden. Top: Config. A = using all sawmill by-products. Bottom: Config. B = excluding the wood chips.
5. Concluding discussion and future research
We have proposed and demonstrated a soft-linking framework in an attempt to bridge the gap between techno-economic modeling and market modeling in the assessment of emerging biorefinery concepts. We showed that the final price effects of introducing a new biorefinery concept at a large scale are far from straightforward to forecast, as prices are formed in markets where any price changes affect both feedstock allocation and production levels in affected industries and sectors.
Three general insights can be discerned from the case study. Firstly, the use of static supply chain optimization models and exogenous biomass prices for the analysis of the biorefinery supply chains neglects the availability of suitable feedstocks due to changed allocations on the biomass markets. Secondly, neglecting the biomass price changes that are induced by the implementation of the biorefinery leads to erroneous relative biomass market prices. This might lead to specific biomass assortments being identified as preferable to use for the biorefinery, which might not be the case given their price changes as a result of the increased demand. Thirdly, the underestimation of the effect of higher feedstock costs might lead to overestimations of the potential of forest-based biorefinery products to penetrate the market.
Based on this, we argue that the framework developed in this paper can be used to facilitate the identification of biorefinery concepts with a high economic performance, and that in turn are robust to feedstock price changes caused by the biorefinery introduction. Furthermore, the proposed framework complements forest sector models used to analyze exogenous shifts in biomass markets, in that it also enables the explicit inclusion of flexible technology and supply chain optimization, focused on the final biorefinery product. In contrast to a static pre-selection of technology to be included in a market model, the benefit of the iterative framework is the iteration of information between the model that generates one stable solution considering all the decision variables included. The cost-minimizing choice of technology depends on feedstock prices. The feedstock prices are in turn dependent on the technologies included. Thus, optimal technologies included in a market model may not be optimal when feedstock prices have adjusted to the new production. The proposed framework ensures that the technologies included in the market model are chosen as to minimize total supply cost also when the feedstock price changes. A biorefinery has many decision variables, ignoring some of the key aspects is likely to result in misleading conclusions, with the risk of sending out conflicting policy recommendations.
The barriers associated with linking models from different traditions of research is a real obstacle –as not only do the models differ in structure and objective function, but the researchers representing the fields also have different agendas. The use of soft-linking enables models to be brought together representing different aspects of a topic, while keeping the integrity of the models intact. The proposed framework is an example of how to soft-link models from the techno-economic tradition with the models in economics built upon market behavior.
Regarding future developments of this framework, it should be noted that so far it has been developed to improve the economic assessment of biorefinery concepts. However, as the main political interest in new biorefinery concepts lies in the possibility of substituting fossil-fuel products and energy carriers, additional decision variables in the form of, e.g., greenhouse gas emissions related to the biorefinery supply chain can be included in the framework by attributing the different flows with the corresponding emissions.
Author Contributions: Conceptualization, Jonas Zetterholm, Elina Bryngemark and Johan Ahlström; Formal analysis, Jonas Zetterholm, Elina Bryngemark, Johan Ahlström, Patrik Söderholm, Simon Harvey and Elisabeth Wetterlund; Funding acquisition, Patrik Söderholm, Simon Harvey and Elisabeth Wetterlund; Methodology, Jonas Zetterholm, Elina Bryngemark and Johan Ahlström; Supervision, Patrik Söderholm, Simon Harvey and Elisabeth Wetterlund; Writing – original draft, Jonas Zetterholm, Elina Bryngemark and Johan Ahlström; Writing – review & editing, Jonas Zetterholm, Elina Bryngemark, Johan Ahlström, Patrik Söderholm, Simon Harvey and Elisabeth Wetterlund.
Funding: The work has been carried out under the auspices of Forskarskolan Energisystem financed by the Swedish Energy Agency. Economic support from Bio4Energy, a strategic research environment appointed by the Swedish government, is also gratefully acknowledged.
Conflicts of Interest:The authors declare no conflict of interest.
Abbreviations
The following abbreviations are used in this manuscript:
CAPEX capital expenditure
CGE computational general equilibrium IO input-output
KPI key performance indicator LBG liquefied biomethane LHV lower heating value
MILP mixed integer linear programming OPEX operational expenditure
PE partial equilibrium
References
1. Connolly, D.; Mathiesen, B.; Ridjan, I. A Comparison between Renewable Transport Fuels That Can Supplement or Replace Biofuels in a 100% Renewable Energy System. Energy 2014, 73, 110–125. doi:10.1016/j.energy.2014.05.104.
2. Fulton, L.M.; Lynd, L.R.; Körner, A.; Greene, N.; Tonachel, L.R. The Need for Biofuels as Part of a Low Carbon Energy Future. Biofuels, Bioproducts and Biorefining2015,9, 476–483. doi:10.1002/bbb.1559. 3. Börjesson Hagberg, M.; Pettersson, K.; Ahlgren, E.O. Bioenergy Futures in Sweden – Modeling Integration
Scenarios for Biofuel Production.Energy2016,109, 1026–1039. doi:10.1016/j.energy.2016.04.044.
4. Cuˇcek, L.; Varbanov, P.S.; Klemeš, J.J.; Kravanja, Z. Total Footprints-Based Multi-Criteria Optimisation ofˇ Regional Biomass Energy Supply Chains.Energy2012,44, 135–145. doi:10.1016/j.energy.2012.01.040. 5. Hosseini Seyed Ali.; Shah Nilay. Multi-Scale Process and Supply Chain Modelling: From Lignocellulosic
Feedstock to Process and Products. Interface Focus2011,1, 255–262. doi:10.1098/rsfs.2010.0013.
6. Mansoornejad, B.; Chambost, V.; Stuart, P. Integrating Product Portfolio Design and Supply Chain Design for the Forest Biorefinery. Computers & Chemical Engineering 2010, 34, 1497–1506. doi:10.1016/j.compchemeng.2010.02.004.
7. Sukumara, S.; Faulkner, W.; Amundson, J.; Badurdeen, F.; Seay, J. A Multidisciplinary Decision Support Tool for Evaluating Multiple Biorefinery Conversion Technologies and Supply Chain Performance. Clean Technologies and Environmental Policy2014,16, 1027–1044. doi:10.1007/s10098-013-0703-6.
8. Brown, T.R. A Techno-Economic Review of Thermochemical Cellulosic Biofuel Pathways. Bioresource Technology2015,178, 166–176. doi:10.1016/j.biortech.2014.09.053.
9. European Commission.; Directorate-General for Mobility and Transport.; Waldheim, L.; Kalligeros, S.; Landälv, I.; Maniatis, K.; van den Heuvel, E.Building up the future sub group on advanced biofuels: final report.; 2017.
10. Gnansounou, E.; Dauriat, A. Techno-Economic Analysis of Lignocellulosic Ethanol: A Review.Bioresource Technology2010,101, 4980–4991. doi:10.1016/j.biortech.2010.02.009.
12. Axelsson, E.; Harvey, S.; Berntsson, T. A Tool for Creating Energy Market Scenarios for Evaluation of Investments in Energy Intensive Industry.Energy2009,34, 2069–2074. doi:10.1016/j.energy.2008.08.017. 13. Harvey, S.; Börjesson, P.; Janssen, M.; Lundgren, J. Long-Term Sustainability Assessment of Fossil-Free
Fuel Production Concepts. Technical Report 2018:13, f3 The Swedish Knowledge Centre for Renewable Transportation Fuels, 2018.
14. Zhao, X.; Brown, T.R.; Tyner, W.E. Stochastic Techno-Economic Evaluation of Cellulosic Biofuel Pathways. Bioresource Technology2015,198, 755–763. doi:10.1016/j.biortech.2015.09.056.
15. Britz, W.; Delzeit, R. The Impact of German Biogas Production on European and Global Agricultural Markets, Land Use and the Environment. Energy Policy 2013, 62, 1268–1275. doi:10.1016/j.enpol.2013.06.123.
16. Kempegowda, R.S.; Skreiberg, Ø.; Tran, K.Q. Techno-Economic Evaluations of Various Biomass CHP Technologies and Policy Measures Under Norwegian Conditions. Energy Procedia2012, 20, 1–10. doi:10.1016/j.egypro.2012.03.002.
17. Mustapha, W.F.; Kirkerud, J.G.; Bolkesjø, T.F.; Trømborg, E. Large-Scale Forest-Based Biofuels Production: Impacts on the Nordic Energy Sector. Energy Conversion and Management2019,187, 93–102. doi:10.1016/j.enconman.2019.03.016.
18. Budzianowski, W.M.; Postawa, K. Total Chain Integration of Sustainable Biorefinery Systems. Applied Energy2016,184, 1432–1446. doi:10.1016/j.apenergy.2016.06.050.
19. Palmeros Parada, M.; Osseweijer, P.; Posada Duque, J.A. Sustainable Biorefineries, an Analysis of Practices for Incorporating Sustainability in Biorefinery Design. Industrial Crops and Products2017,106, 105–123. doi:10.1016/j.indcrop.2016.08.052.
20. Ahlström, J.M.; Pettersson, K.; Wetterlund, E.; Harvey, S. Value Chains for Integrated Production of Liquefied Bio-SNG at Sawmill Sites – Techno-Economic and Carbon Footprint Evaluation.Applied Energy 2017,206, 1590–1608. doi:10.1016/j.apenergy.2017.09.104.
21. Holmgren, K.M.; Berntsson, T.S.; Andersson, E.; Rydberg, T. Comparison of Integration Options for Gasification-Based Biofuel Production Systems – Economic and Greenhouse Gas Emission Implications. Energy2016,111, 272–294. doi:10.1016/j.energy.2016.05.059.
22. Zetterholm, J.; Pettersson, K.; Leduc, S.; Mesfun, S.; Lundgren, J.; Wetterlund, E. Resource Efficiency or Economy of Scale: Biorefinery Supply Chain Configurations for Co-Gasification of Black Liquor and Pyrolysis Liquids. Applied Energy2018,230, 912–924. doi:10.1016/j.apenergy.2018.09.018.
23. Cuˇcek, L.; Martín, M.; Grossmann, I.E.; Kravanja, Z. Multi-Period Synthesis of Optimally Integratedˇ Biomass and Bioenergy Supply Network. Computers & Chemical Engineering 2014, 66, 57–70. doi:10.1016/j.compchemeng.2014.02.020.
24. Heyne, S.; Thunman, H.; Harvey, S. Exergy-Based Comparison of Indirect and Direct Biomass Gasification Technologies within the Framework of Bio-SNG Production. Biomass Conversion and Biorefinery2013, 3, 337–352. doi:10.1007/s13399-013-0079-1.
25. Tock, L.; Gassner, M.; Maréchal, F. Thermochemical Production of Liquid Fuels from Biomass: Thermo-Economic Modeling, Process Design and Process Integration Analysis. Biomass and Bioenergy2010, 34, 1838–1854. doi:10.1016/j.biombioe.2010.07.018.
26. Alamia, A.; Magnusson, I.; Johnsson, F.; Thunman, H. Well-to-Wheel Analysis of Bio-Methane via Gasification, in Heavy Duty Engines within the Transport Sector of the European Union. Applied Energy 2016,170, 445–454. doi:10.1016/j.apenergy.2016.02.001.
27. Kangas, P.; Hannula, I.; Koukkari, P.; Hupa, M. Modelling Super-Equilibrium in Biomass Gasification with the Constrained Gibbs Energy Method. Fuel2014,129, 86–94. doi:10.1016/j.fuel.2014.03.034.
28. Kaushal, P.; Tyagi, R. Advanced Simulation of Biomass Gasification in a Fluidized Bed Reactor Using ASPEN PLUS.Renewable Energy2017,101, 629–636. doi:10.1016/j.renene.2016.09.011.
29. Ahlström, J.M.; Alamia, A.; Larsson, A.; Breitholtz, C.; Harvey, S.; Thunman, H. Bark as Feedstock for Dual Fluidized Bed Gasifiers-Operability, Efficiency, and Economics. International Journal of Energy Research 2019,43, 1171–1190. doi:10.1002/er.4349.
30. Alamia, A.; Thunman, H.; Seemann, M. Process Simulation of Dual Fluidized Bed Gasifiers Using Experimental Data. Energy & Fuels2016,30, 4017–4033. doi:10.1021/acs.energyfuels.6b00122.
32. Wright, M.; Brown, R.C. Establishing the Optimal Sizes of Different Kinds of Biorefineries. Biofuels, Bioproducts and Biorefining2007,1, 191–200. doi:10.1002/bbb.25.
33. Blair, M.J.; Cabral, L.; Mabee, W.E. Biorefinery Strategies: Exploring Approaches to Developing Forest-Based Biorefinery Activities in British Columbia and Ontario, Canada. Technology Analysis & Strategic Management2017,29, 528–541. doi:10.1080/09537325.2016.1211266.
34. de Jong, S.; Hoefnagels, R.; Wetterlund, E.; Pettersson, K.; Faaij, A.; Junginger, M. Cost Optimization of Biofuel Production – The Impact of Scale, Integration, Transport and Supply Chain Configurations.Applied Energy2017,195, 1055–1070. doi:10.1016/j.apenergy.2017.03.109.
35. Yue, D.; You, F.; Snyder, S.W. Biomass-to-Bioenergy and Biofuel Supply Chain Optimization: Overview, Key Issues and Challenges. Computers & Chemical Engineering 2014, 66, 36–56. doi:10.1016/j.compchemeng.2013.11.016.
36. Golecha, R.; Gan, J. Biomass Transport Cost from Field to Conversion Facility When Biomass Yield Density and Road Network Vary with Transport Radius. Applied Energy 2016, 164, 321–331. doi:10.1016/j.apenergy.2015.11.070.
37. Sultana, A.; Kumar, A. Development of Tortuosity Factor for Assessment of Lignocellulosic Biomass Delivery Cost to a Biorefinery. Applied Energy2014,119, 288–295. doi:10.1016/j.apenergy.2013.12.036. 38. Ghaderi, H.; Pishvaee, M.S.; Moini, A. Biomass Supply Chain Network Design: An Optimization-Oriented
Review and Analysis. Industrial Crops and Products2016,94, 972–1000. doi:10.1016/j.indcrop.2016.09.027. 39. Eskandarpour, M.; Dejax, P.; Miemczyk, J.; Péton, O. Sustainable Supply Chain Network Design: An
Optimization-Oriented Review. Omega2015,54, 11–32. doi:10.1016/j.omega.2015.01.006.
40. Papageorgiou, L.G. Supply Chain Optimisation for the Process Industries: Advances and Opportunities. Computers & Chemical Engineering2009,33, 1931–1938. doi:10.1016/j.compchemeng.2009.06.014.
41. Sharma, B.; Ingalls, R.; Jones, C.; Khanchi, A. Biomass Supply Chain Design and Analysis: Basis, Overview, Modeling, Challenges, and Future. Renewable and Sustainable Energy Reviews2013,24, 608–627. doi:10.1016/j.rser.2013.03.049.
42. De Meyer, A.; Cattrysse, D.; Rasinmäki, J.; Van Orshoven, J. Methods to Optimise the Design and Management of Biomass-for-Bioenergy Supply Chains: A Review.Renewable and Sustainable Energy Reviews 2014,31, 657–670. doi:10.1016/j.rser.2013.12.036.
43. Natarajan, K.; Leduc, S.; Pelkonen, P.; Tomppo, E.; Dotzauer, E. Optimal Locations for Second Generation Fischer Tropsch Biodiesel Production in Finland. Renewable Energy 2014, 62, 319–330. doi:10.1016/j.renene.2013.07.013.
44. Pettersson, K.; Wetterlund, E.; Athanassiadis, D.; Lundmark, R.; Ehn, C.; Lundgren, J.; Berglin, N. Integration of Next-Generation Biofuel Production in the Swedish Forest Industry – A Geographically Explicit Approach.Applied Energy2015,154, 317–332. doi:10.1016/j.apenergy.2015.04.041.
45. Söderholm, P.; Lundmark, R. The Development of Forest-Based Biorefineries : Implications for Market Behavior and Policy. Forest products journal2009,59, 6–16.
46. Sedjo, R.A. The Economics of Forest-Based Biomass Supply. Energy Policy 1997, 25, 559–566. doi:10.1016/S0301-4215(97)00045-1.
47. Bryngemark, E. Second Generation Biofuels and the Competition for Forest Raw Materials: A Partial Equilibrium Analysis of Sweden. Forest Policy and Economics 2019, 109, 102022. doi:10.1016/j.forpol.2019.102022.
48. Caurla, S.; Delacote, P.; Lecocq, F.; Barkaoui, A. Stimulating Fuelwood Consumption through Public Policies: An Assessment of Economic and Resource Impacts Based on the French Forest Sector Model. Energy Policy2013,63, 338–347. doi:10.1016/j.enpol.2013.07.111.
49. Geijer, E.; Bostedt, G.; Brännlund, R. Damned If You Do, Damned If You Do Not—Reduced Climate Impact vs. Sustainable Forests in Sweden. Resource and Energy Economics2011, 33, 94–106. doi:10.1016/j.reseneeco.2010.01.004.
50. Kangas, H.L.; Lintunen, J.; Pohjola, J.; Hetemäki, L.; Uusivuori, J. Investments into Forest Biorefineries under Different Price and Policy Structures. Energy Economics 2011, 33, 1165–1176. doi:10.1016/j.eneco.2011.04.008.
52. Sjølie, H.K.; Latta, G.S.; Trømborg, E.; Bolkesjø, T.F.; Solberg, B. An Assessment of Forest Sector Modeling Approaches: Conceptual Differences and Quantitative Comparison.Scandinavian Journal of Forest Research 2015,30, 60–72. doi:10.1080/02827581.2014.999822.
53. Trømborg, E.; Bolkesjø, T.F.; Solberg, B. Impacts of Policy Means for Increased Use of Forest-Based Bioenergy in Norway—A Spatial Partial Equilibrium Analysis. Energy Policy 2007, 35, 5980–5990. doi:10.1016/j.enpol.2007.08.004.
54. Folsland Bolkesjø, T.; Trømborg, E.; Solberg, B. Bioenergy from the Forest Sector: Economic Potential and Interactions with Timber and Forest Products Markets in Norway. Scandinavian Journal of Forest Research 2006,21, 175–185. doi:10.1080/02827580600591216.
55. Choumert Nkolo, J.; Combes Motel, P.; Guegang Djimeli, C. Income-Generating Effects of Biofuel Policies: A Meta-Analysis of the CGE Literature. Ecological Economics 2018, 147, 230–242. doi:10.1016/j.ecolecon.2018.01.025.
56. De Lucia, C.; Bartlett, M. Implementing a Biofuel Economy in the EU: Lessons from the SUSTOIL Project and Future Perspectives for next Generation Biofuels. Renewable and Sustainable Energy Reviews2014, 29, 22–30. doi:10.1016/j.rser.2013.08.058.
57. Hoefnagels, R.; Banse, M.; Dornburg, V.; Faaij, A. Macro-Economic Impact of Large-Scale Deployment of Biomass Resources for Energy and Materials on a National Level—A Combined Approach for the Netherlands. Energy Policy2013,59, 727–744. doi:10.1016/j.enpol.2013.04.026.
58. Cambero, C.; Sowlati, T. Assessment and Optimization of Forest Biomass Supply Chains from Economic, Social and Environmental Perspectives – A Review of Literature. Renewable and Sustainable Energy Reviews 2014,36, 62–73. doi:10.1016/j.rser.2014.04.041.
59. Sacchelli, S.; Bernetti, I.; De Meo, I.; Fiori, L.; Paletto, A.; Zambelli, P.; Ciolli, M. Matching Socio-Economic and Environmental Efficiency of Wood-Residues Energy Chain: A Partial Equilibrium Model for a Case Study in Alpine Area.Journal of Cleaner Production2014,66, 431–442. doi:10.1016/j.jclepro.2013.11.059. 60. You, F.; Tao, L.; Graziano, D.J.; Snyder, S.W. Optimal Design of Sustainable Cellulosic Biofuel Supply
Chains: Multiobjective Optimization Coupled with Life Cycle Assessment and Input-Output Analysis. AIChE Journal2012,58, 1157–1180. doi:10.1002/aic.12637.
61. Parajuli, R.; Dalgaard, T.; Jørgensen, U.; Adamsen, A.P.S.; Knudsen, M.T.; Birkved, M.; Gylling, M.; Schjørring, J.K. Biorefining in the Prevailing Energy and Materials Crisis: A Review of Sustainable Pathways for Biorefinery Value Chains and Sustainability Assessment Methodologies. Renewable and Sustainable Energy Reviews2015,43, 244–263. doi:10.1016/j.rser.2014.11.041.
62. Cambero, C.; Sowlati, T. Incorporating Social Benefits in Multi-Objective Optimization of Forest-Based Bioenergy and Biofuel Supply Chains. Applied Energy 2016, 178, 721–735. doi:10.1016/j.apenergy.2016.06.079.
63. Santibañez-Aguilar, J.E.; González-Campos, J.B.; Ponce-Ortega, J.M.; Serna-González, M.; El-Halwagi, M.M. Optimal Planning and Site Selection for Distributed Multiproduct Biorefineries Involving Economic, Environmental and Social Objectives. Journal of Cleaner Production 2014, 65, 270–294. doi:10.1016/j.jclepro.2013.08.004.
64. Wene, C. Energy-Economy Analysis: Linking the Macroeconomic and Systems Engineering Approaches. Energy1996,21, 809–824. doi:10.1016/0360-5442(96)00017-5.
65. Bauer, N.; Edenhofer, O.; Kypreos, S. Linking Energy System and Macroeconomic Growth Models. Computational Management Science2008,5, 95–117. doi:10.1007/s10287-007-0042-3.
66. Deane, J.; Chiodi, A.; Gargiulo, M.; Ó Gallachóir, B.P. Soft-Linking of a Power Systems Model to an Energy Systems Model. Energy2012,42, 303–312. doi:10.1016/j.energy.2012.03.052.
67. Andersen, K.S.; Termansen, L.B.; Gargiulo, M.; Ó Gallachóirc, B.P. Bridging the Gap Using Energy Services: Demonstrating a Novel Framework for Soft Linking Top-down and Bottom-up Models. Energy2019, 169, 277–293. doi:10.1016/j.energy.2018.11.153.
68. Krook-Riekkola, A.; Berg, C.; Ahlgren, E.O.; Söderholm, P. Challenges in Top-down and Bottom-up Soft-Linking: Lessons from Linking a Swedish Energy System Model with a CGE Model. Energy2017, 141, 803–817. doi:10.1016/j.energy.2017.09.107.

![Table 3. Energy performance (LHV) of the biorefinery configurations, derived from [20]](https://thumb-us.123doks.com/thumbv2/123dok_us/8055076.1342314/17.595.136.461.108.172/table-energy-performance-lhv-biorenery-congurations-derived.webp)