CSEIT183180 | Received : 12 Jan 2018 | Accepted : 29 Jan 2018 | January-February-2018 [(3) 1 : 549-555 ]
International Journal of Scientific Research in Computer Science, Engineering and Information Technology © 2018 IJSRCSEIT | Volume 3 | Issue 1 | ISSN : 2456-3307
549
Multiple Imputation for Missing Data Using Factored Regression
Modelwith the Implementation of Current Population
S. Dilip Kumar
MCA.,M.Phil, Assistant professor, Department of Computer Applications, NGM College, pollachi, Tamil Nadu, india
ABSTRACT
Missing value or data is a major issue in all fields. Many models and methods are supported to substitute the missing values. In this paper, we promote the use of statistical methods for treating missing data that employ single- or multiple- imputation of missing values. Proposed a method, called factored regression model to multiply impute missing values in such data sets by modelling the joint distribution of the variables in the data through a sequence of generalised linear models. Apply our model to protect confidentiality of the current population survey data by generating multiply imputed, partially synthetic data sets.
Keywords: Data mining, Missing Values, Multiple Imputation, Factored Regression.
I.
INTRODUCTION
The problem of missing values, also often referred to as incomplete data, is the central one for this thesis. As an example, the Siemens data set is very incomplete. It contains missing values for most of the features, with up to over 90% of the values missing for some of them. One of the standard techniques used for treating missing values, filling in the mean or median, does not seem appropriate any more, when more of the data is missing than is being present.
Methods to deal with missing values have been widely used since the seventies. One of the most important reviews of these methods is Little and Rubin (1987), who give an overview of historical approaches. The main part of that book then covers state of the art methods, which are described from a statistical viewpoint. These are mainly based on maximum likelihood theory and on the Expectation-Maximization (EM) algorithm.
The book is mainly directed to practitioners and provides many examples of application of these methods to missing value problems. Little and Rubin try to systematize missing values approaches to provide the grounds for further research.
One systematic is their distinction of methods in (1) complete case methods, (2) imputation methods, (3) weighting procedures, and (4) model-based procedures. Methods covered in the book include different imputation methods, where missing values are filled in by computed or sampled values, namely filling in least squares estimates, unconditional or conditional means of the respective feature, and multiple imputation. Furthermore, it covers complete case analysis, (pairwise) available case analysis, weighting methods, and, most importantly, a host of maximum likelihood approaches.
1.1. Missingness Characteristics
Missing Completely At Random (MCAR) The probability for a value to be missing is independent of that feature value, and independent of the values of all other features, as well.
Missing At Random (MAR)
The probability of a value missing is independent of the value itself, but may depend on the values of other features.
Non-ignorable
In this case, the probability that a feature is missing may also depend on the actual value. An example could be a question for the income in a survey, where people with very little or high income may not want to admit this and leave questions unanswered.
Prediction For the focus of this thesis, prediction of target values instead of statistical model estimation, this distinction is not as important; instead, missingness mechanisms can also be divided into
Informative
The fact, that a value is missing, provides information about a classification or regression target.
Non-Informative
The distribution of missing values is the same for all classes / regression values.
These two classification systems, MCAR/MAR/non-ignorable and (non-) informatively missing, overlap somehow. MCAR, MAR and non-ignitability are targeted on density And/or model estimation, where there is not necessarily a dedicated target feature for later prediction. MCAR values are always non-informative. A MAR missingness mechanism might be either informative or not, depending on whether the set of features it depends on includes the target or not. The same holds for non-ignorable missingness mechanisms, where a missing value is (potentially) informative, if the actual value is statistically dependent on the target.
II.
LITERATURE REVIEW
Multiple imputation (see e.g. Little and Schenker (1991)) completes the missing values in the data set more often than once. The use of some or several completed data sets allows determining the sensitivity of parameters or predicted values with respect to the missing values.
The sampling of the missing values has to be performed according to a probability distribution, not by deterministic regression. This can be done
A problem of multiple imputations is the scaling for large numbers of missing values; the combinatorial number of possibilities for completion makes it harder (and time consuming) to obtain reliable estimates of mean values and variances for parameters and/or predictions. Furthermore, depending on the estimation or prediction task, it may not be trivial to combine the results obtained from the different completed data sets into one.
importance of differentiating between estimation and prediction problems. Preprocessing appropriate for estimation of statistical models may be inadequate for use with prediction algorithms and vice versa.
Ramoni and Sebastiani (1996) and Ramoni and Sebastiani (2001) describe the Robust Bayesian Estimator (RBE) method, which replaces exact conditional probabilities in reasoning by intervals resulting from filling in the possible values for missing values. The main application of the approach is with Bayesian networks, but the idea may also be applied to other learning algorithms. It also allows to do sensitivity analysis and to infer, whether the missing values mechanism is informative or not. The RBE is compared to the EM algorithm and Gibbs sampling. For MCAR and MAR mechanisms, some advantages in accuracy are reported, although the precision of latter methods often is not reached. But for non-ignorable missingness mechanisms, the RBE method is more robust than the other two.
Using association rules for imputation, Ragel (2000) proposes his method “Missing Values Completion” (MVC) to fill in missing values. Results are published with C4.5 as classifier, and compared to the built in missing values handling of C4.5. For many missing values, he reports an improves performance.
A further approach, very similar to the EM algorithm in its idea, is presented in Satten and Datta (2000). Their S-U algorithm iterates two steps. First, it uses an importance sampling procedure to simulate the missing data (S-step), and then updates the parameters (U-step); the sequence of parameter estimates converges toward the complete data likelihood solution. Contrary to the EM algorithm, the update step is no maximization, but a closed-form expression designed to let the approximations converge to the true estimate. This allows to use the algorithm in cases, where EM is problematic, because of intractable maximization during the M-step. Consistency and asymptotic normality of the approximation sequence are proven, and the
relations to Monte-Carlo Maximum Likelihood and Monte-Carlo EM algorithms are discussed, with arguments usually in favor of the S-U algorithm.
Kamakura and Wedel (1998) develop a framework for latent variable, and also missing value, estimation, in the context of exponential distributions for factor models, using simulated likelihood for the estimation. In this model, the distribution parameters of the observations Y depend bilinearly on the values of latent variables X. Exponential families are used as distributions for X and Y, because only for them it is possible to compute sufficient statistics for this dependence from the observed data. They allow to model discrete as well as continuous distributions, enabling its use for mixed feature spaces (cf. next section). Kamakura and Wedel apply this approach to artificial and marketing data. An advantage of the simulated annealing latent variable method is, that estimation of missing values is unbiased, even if the missingness pattern depends on the unobserved latent variables. Disadvantages are the computational complexity of the simulated likelihood procedure used, cf. Gourieroux and Montfort (1994) and Lee (1997), and that the distribution of the latent variables must be specified and cannot be verified.
III. PROPOSED METHODOLOGY
to the analysis based on the observed-data likelihood, whereas the imputation uncertainty is reflected by the variation across the multiple completed datasets.
Analysis Procedure
The analysis of multiply imputed data proceeds as follows:
1. Analyze each completed dataset separately using a suitable software package designed for estimate, standard error, and the associated confidence interval or probability value. The combining rules in step 3 contain some formulas for calculating the average of the estimates across multiple imputations and the variances of the estimates, both within and between imputations.
Imputation Models
Plausible imputation should give reasonable predictions for the missing data, and the variability among them must reflect an appropriate degree of uncertainty. Rubin recommends that imputations be created through Bayesian arguments: Specify a parametric model for the complete data under MAR, assume a prior distribution for the unknown model parameters, and simulate multiple independent draws from the conditional distribution of missing values given observed data by Bayes theorem. A simple example for univariate missing outcome is given in the Appendix.
Various imputation models have been developed within more general and complicated contexts. See Buuren for a summary and references. In general, the strategy of building imputation models falls into 2 categories:
1. Joint modelling
The joint modelling approach partitions the observations into groups of identical missing data
patterns and imputes the missing entries with each pattern according to a joint model for the variables that is common to all observations. Some classic examples include multivariate normal models for continuous variables, log-linear models for categorical variables, general location models for a mixture of continuous and categorical variables, and mixed-effects models for repeated measurements or multilevel data. These methods start by specifying a parametric multivariate density for the data given model parameters. Under an appropriate prior distribution for the parameters, it is possible to derive the appropriate sub model for each missing data pattern, from which imputations are drawn. The joint modelling approach is theoretically sound but may lack the flexibility needed to represent complex data structures arising in many studies.
2. Sequential regression multiple imputation (SRMI) (also referred to as the multiple imputation by chained equations). In SRMI, multivariate data are characterized by separate conditional models for each incomplete variable. That is, the imputation model is specified separately for each variable, with other variables as predictors. At each step of the SRMI algorithm, imputations are generated for the missing values of 1 variable; these imputed values are then used in the imputation of the next variable, and this process repeats until it reaches convergence. Compared with the joint modelling approach, an appealing feature of SRMI is that it is relatively easy to accommodate complex data features in univariate regression models. Constructing these regression models can follow common guidelines of regression modelling applied to the data at hand. For continuous variables, the model may involve a linear regression model or its robust extensions.
3.1 Classification with Missing Data
input features. Our main interest is in classification methods that can both learn from data cases with missing features, and make predictions for data cases with missing features.
Imputation is a strategy for dealing with missing data that is widely used in the statistical community. In unconditional mean imputation, the mean of feature d is computed using the data cases where feature d is observed. The mean value for feature d is then used as the value for feature d in data cases where feature d is not observed. In regression imputation, a set of regression models of missing features given observed features is learned. Missing features are filled in using predicted values from the learned regression model.
Regression and mean imputation belong to the class of single imputation methods. In both cases a single completion of the data set is formed by imputing exactly one value for each unobserved variable. Multiple imputations is an alternative to single imputation procedures. As the name implies, multiple completions of a data set are formed by imputing several values for each missing variable.
In its most basic form, the imputed values are sampled from a simplified imputation model and standard methods are used on each complete data set. The principal advantage of multiple imputations over single imputation is that multiple imputation better reacts the variability due to missing values. Sophisticated forms of multiple imputations are closely related to approximate.
The key to imputation techniques is selecting an appropriate model of the input space to sample from. More flexible imputation models for real valued data are often based on mixtures of Gaussians. In high dimensions, learning a mixture of probabilistic principal components analysis or factor analysis models may be more appropriate. The advantage of imputation methods is that they can be used in conjunction with any complete data classifier. The main disadvantage is that learning one or more
imputation models can be a costly operation. In addition, using multiple imputations leads to maintaining an ensemble of classifiers at test time. Combining multiple imputations with cross validation requires training and evaluating many individual classifiers.
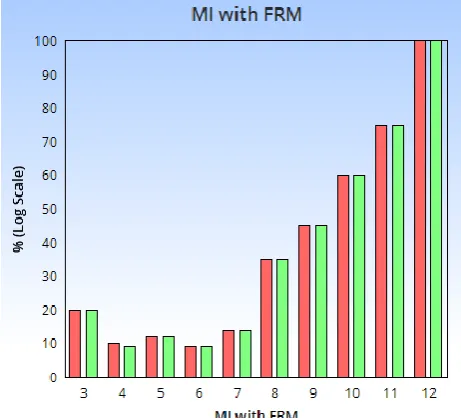
Figure 1. Performance evaluation of FRM
MI Mortality proportions were within 95% confidence intervals of observed proportions for the whole range of FRM values Imputed RR led to an underestimation in mortality risk from 30<RR< 60 but remained within 95% confidence intervals for all other values. The functional relationship between SBP and mortality risk remained practically unchanged following MI
Figure 2. Performance evaluation of FRM
is limited, resulting imputations will be heterogeneous, which will result in robust variance estimates in ensuing analyses. MI uses information on any number of auxiliary variables whether they have missing values or not; it simultaneously imputes data for all variables with missing values. Finally, MI generates imputed values that can be added to the trauma registry database and used in future analyses as long as covariance structures are respected.
IV. CONCLUSION
Learning, inference, and prediction in the presence of missing data are pervasive problems in machine learning and statistical data analysis. This thesis focuses on the problems of collaborative prediction with non-random missing data and classification with missing features. We have presented new experimental protocols, new data sets, and new models and algorithms for learning, inference, and prediction. In this paper we present concluding remarks and indicate directions for future research.
Our results show that incorporating a model of the missing data process results in substantial improvements in predictive performance on randomly selected items compared to models that ignore the missing data process. Our results show that training and testing only on ratings for user selected items can vastly overestimate prediction performance on randomly selected items. Our analysis also shows that the availability of even a small sample of ratings for randomly selected items can have a large impact on rating prediction performance.
V.
REFERENCES
[1]. Alan Agresti. Categorical Data Analysis (Second Edition). John Wiley and Sons, 2002. [2]. D. Aldous. Exchangeability and Related Topics.
In Proceedings of the Ecole d'Ete de Probabilities de Saint-Flour XIII, Pages 1{198. Springer, 1985.
[3]. J. A. Anderson. Separate Sample Logistic Discrimination. Biometrika, 59(1):19{35, 1972. [4]. Galen Andrew and Jianfeng Gao. Scalable
Training of L1-Regularized Log-Linear Models. In Proceedings of the 24th International Conference on Machine Learning, 2007. [5]. A. Banerjee. An Analysis of Logistic Models:
Exponential Family Connections and Online Performance. In SIAM International Conference on Data Mining, 2002.
[6]. Halima Bensmail and Gilles Celeux. Regularized Gaussian Discriminant Analysis Through Eigenvalue Decomposition. Journal of the American Statistical Association, 91(463):1743{1748, 1996.
[7]. C. M. Bishop. Neural Networks for Pattern Recognition. Oxford University Press, 1995. [8]. tephen Boyd. An Interior-Point Method for
Large-Scale L1-Regularized Logistic Regression. Journal of Machine Learning Research, 8:1519{1555, 2007.
[9]. John S. Breese, David Heckerman, and Carl Kadie. Empirical Analysis of Predictive Algorithms for Collaborative Filtering. In Proceedings of the Fourteenth Annual Conference on Uncertainty in Arti_cial Intelligence, Pages 43{52, July 1998.
[10]. Christopher J. C. Burges. A Tutorial on Support Vector Machines for Pattern Recognition. Data Mining and Knowledge Discovery, 2(2):121{167, 1998.
[11]. John Canny. Collaborative Filtering with Privacy via Factor Analysis. In Proceedings of the 25th Annual International ACM SIGIR Conference on Research and Development in Information Retrieval, Pages 238{245. ACM Press, 2002.
[12]. O. Chapelle, B. Sch•olkopf, and A. Zien, editors. Semi-Supervised Learning. MIT Press, Cambridge, MA, 2006.
in Neural Information Processing Systems 19, 2006.
[14]. Gal Chechik, Geremy Heitz, Gal Elidan, Pieter Abbeel, and Daphne Koller. Max-Margin Classi_cation of Data with Absent Features. Journal of Machine Learning Research, 9:1{27, 2007.
[15]. D. R. Cox and E. J. Snell. Analysis of Binary Data. Chapman Hall, second edition, 1989. [16]. Dennis Decoste. Collaborative Prediction Using
Ensembles of Maximum Margin Matrix Factorizations. In Proceedings of the 23rd International Conference on Machine Learning, Pages 249{256, 2006.
[17]. A.P. Dempster, N.M. Laird, and D.B. Rubin. Maximum Likelihood From Incomplete Data Via the EM Algorithm. Journal of the Royal Statistical Society, Series B, 39(1):1{38, 1977.
[18]. M.Ramaraj, Dr.S.Niraimathi Application of