Using the Complexity of the Distribution of Lexical Elements as a Feature in
Authorship Attribution
L.M. Spracklin, D.Z. Inkpen, A. Nayak
University of OttawaOttawa, Canada
[email protected], [email protected], [email protected]
Abstract
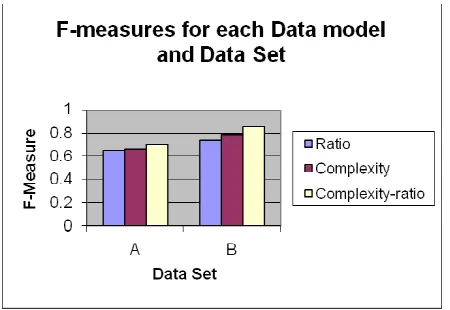
Traditional Authorship Attribution models extract normalized counts of lexical elements such as nouns, common words and punctuation and use these normalized counts or ratios as features for author fingerprinting. The text is viewed as a “bag-of-words” and the order of words and their position relative to other words is largely ignored. We propose a new method of feature extraction which quantifies the distribution of lexical elements within the text using Kolmogorov complexity estimates. Testing carried out on blog corpora indicates that such measures outperform ratios when used as features in an SVM authorship attribution model. Moreover, by adding complexity estimates to a model using ratios, we were able to increase the F-measure by 5.2-11.8%
1. Introduction
Determining the author of a text is an important problem in computational linguistics. It has applications to plagiarism, copyright infringement and the analysis of anonymously written texts. Normally a machine learning system for authorship attribution extracts features which represent the counts of a variety of lexical elements which are normalized over the length of the text. For example the number of nouns, verbs, common words or punctuation characters may be counted. This is done to fingerprint an author. A model is created based on these features and texts of unknown origin are classified using the model.
The problem with extracting counts of elements is that information is lost. The text is viewed as a “bag-of-words” and the distribution of elements within the text is ignored. It would be useful to have a method of quantifying the distribution of lexical elements within a text. For example, are most of the common words clustered in one part of the text or are they distributed in a near random fashion throughout the text? If one could quantify the distribution of lexical elements then the question still remains as to whether this is a useful feature for authorship attribution and if so is it as good as or better than using only the counts of lexical elements.
This paper proposes a method of quantifying the distribution of lexical elements by using compression. The set of tokens is represented by a binary string. The Kolmogorov complexity of a binary string is the length of the shortest program which can output the string on a universal Turing machine and then stop (Li, 1997). It can be approximated using any lossless compression algorithm. The degree of compression of the string gives an upper bound on the Kolmogorov complexity (Li, 1997).
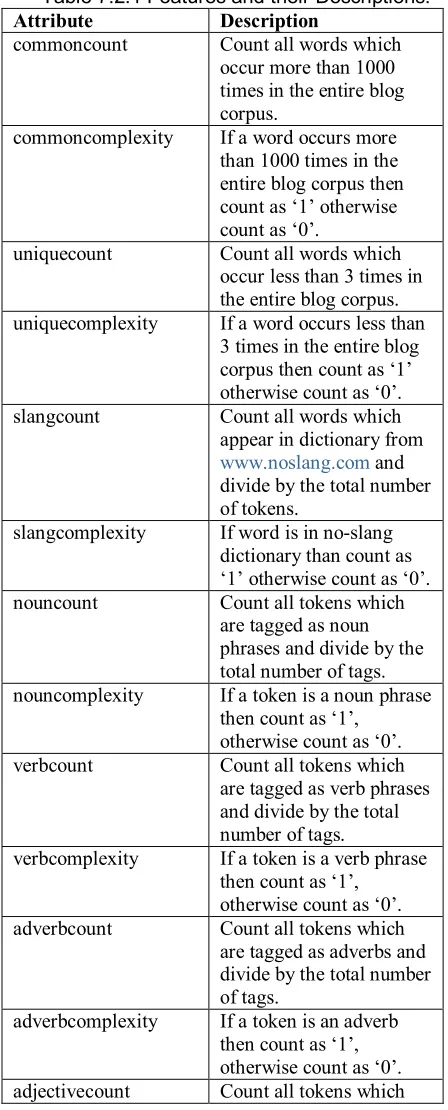
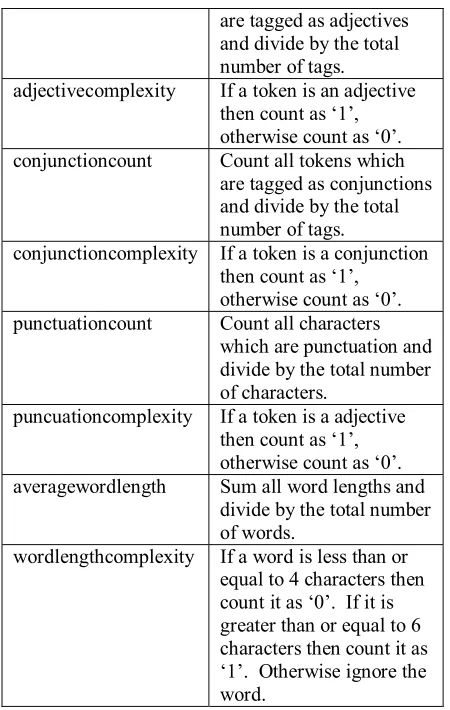
In this paper, we use a set of blogs as a training/test corpus and a Support vector machine, or SVM, is used to develop models which predict the author. For each blog, nouns, verbs, pronouns, conjunctions, common words, unique words, internet slang words and punctuation characters were identified. Both normalized counts and complexity estimates were extracted for each lexical element. Thus we have 10 features which are based on traditional normalized counts and 10 features which are based on complexity.
We show that the complexity of lexical elements is a better indictor of style then the normalized count of such elements. In addition because ratio and complexity contain different information, both can be used in an authorship attribution model to boost performance without over fitting.
2. Authorship Attribution
Stylometry is concerned with analyzing the linguistic style of text to determine authorship or genre. If one assumes that an author has a consistent style, then one can assume that the author of a text can be identified by analyzing its style.
In order to analyze the style of text, various features are extracted and analyzed. The first attempts at feature extraction focused on treating text as sets of tokens arranged into sentences (Stamatatos, 2000). The extracted features included sentence count, words per sentence, and characters per word. Usually these features were also normalized to the length of the text. These features are still used for classification today.
keywords at the end of the spam to try to fool the filter
00001000010000 0.714 0.143 01111011110000 0.714 0.571
Likewise, if we use ratios, we lose information about how the common words were distributed. For example, the following two strings have the same ratio of 0.5 but very different distributions.
String Complexity Ratio
11111110000000 0.143 0.500 10101010101010 1.000 0.500
Koppel et al. obtained good results using almost the entire corpus for author attribution (Koppel, 2006). Using only those posts with over 200 words, he obtained 18,000 blogs for testing/training. He extracted weighted measures of words that would be representative of topic, function words and unique numeric non-alphanumeric words (such as smileys). He used information retrieval techniques instead of a machine learning model and in 66.0% – 79.5% of cases his system could make no conclusions and returned “I don’t know”, otherwise his system was over 80% accurate.
Schler et al. also used this corpus to build a model which predicts gender and age with over 80% accuracy (Koppel, 2006).
Since the corpus contained far too many blogs and bloggers for a machine learning author attribution model, I selected a subset of bloggers to work with. By analyzing length of posts, I obtained a set of 19 authors each of which had over 37 blogs of length over 1000 words. Generally this is the minimum length required for accurate authorship attribution (Stamatatos, 2000). I divided these authors into 2 sets. Data set A is a balanced data set in which most authors have the same number of large (length > 1000) blogs. The mean is 43.40 blogs and the standard deviation is 3.31. Data set B is less balanced and the mean number of blogs is 60.56 and the standard deviation is 28.87. There were other blogs by each of these 19 authors but only posts of length greater than 1000 were used. Note that I refer to bloggers and authors interchangeably in this report.
Table 4.1 Details of Authors and their blogs in Data Set A.
Author Gender Age Posts of Length > 1000
a1 male 24 46
a2 male 24 40
a3 male 47 44
a4 male 41 42
a5 male 17 36
a6 female 26 47
a7 male 36 45
a8 male 25 46
a9 female 47 44
a10 male 25 44
Table 4.2 Details of Authors and their blogs in Data Set B.
Author Gender Age Posts of Length > 1000
b1 male 25 89
b2 male 27 62
b3 male 33 112
b4 female 25 38
b5 male 15 76
b6 male 44 54
b7 male 37 37
b8 female 43 39
b9 female 14 38
5. Weka
Weka is a collection of machine learning algorithms and data processing tools (Witten, 2005). It is available for free download and it is very easy to use. It was developed at the University of Waikato in New Zealand. There are a great deal of machine learning tools included in the Weka package such as trees, linear regression, neural networks, naïve Bayes and support vector machines. A support vector machine was used in our experiments.
6. Support Vector Machines
A support vector machine or SVM is a supervised learning method used to classify data (Witten, 2005). Each instance in the training set is represented as a set of n features which correlates with an n-dimensional data point. The entire set of training examples if viewed as a set of data points in n-dimensional space and the SVM attempts to find the hyperplanes which best divide the space between each pair of classes such that the largest possible number of data points are on the same side and the distance between each class and the hyperplane is maximized (Witten, 2005). The optimal hyperplane is one which minimizes the risk of misclassifying a data point. The data points which are closest to the maximum margin hyperplane are known as support vectors (Witten, 2005).
Thus for our problem there are 20 dimensions and 9 or 10 classes or authors thus the SVM will find a maximal margin hyperplane which separates each possible pair of classes of which there are 34 or 43. Suppose we label the features f1, f2, …f20, then the SVM
finds a vector of the form x = w0 + w1f2 + w2f2 + … +
w20f20 to divide each possible pair of classes. This will be
done for each pair of classes and each fold in 10-cross validation.
For this project the SMO or sequential minimal optimization implementation of an SVM in Weka was used. By default the SMO uses polynomial of Gaussian kernels, transforms nominal vales into binary ones and normalizes attributes (Witten, 2005). Other machine learning tools in Weka were also tested but SVM proved to be very competitive and seemed a natural fit for the problem.
7. Methodology
7.1 OverviewFigure 8.1 F-measures for each Model and Data Set.
The results are better for data set B then data set A for two reasons. Firstly B is bigger than A. This generally always increases accuracy. Also if you view the confusion matrices for data set A (table A2, A4 and A6 in appendix A), there was a great deal of confusion between authors a1 and a2. In fact a2 was never classified correctly for any of the instances for any of the models and in fact was always classified as a1. What is also interesting is that both a1 and a2 are 24 year old men. There are two possibilities. Schler et al. show that in blogging, gender and age have an affect on the use of lexical features (Koppel, 2006). It is also possible that they were both written by the same person. On the internet no one is ever who they say they are. I chose not to remove a2 from the training set as we did not want to run the risk of cherry-picking data.
9. Conclusion
It has been shown that the addition of Kolmogorov complexity measures of lexical features increases the accuracy of a feature-based author attribution SVM model by 5.2%-11.8%. In fact the Kolmogorov complexity estimate of a feature is a better measure of style than the normalized count of such a feature. This is an important result because this means we can boost accuracy with the addition of very little extra computation. If a system is already extracting features and counting them then it is trivial to also compute the complexity measure for that feature as well. Our results also show that some information about style is lost when we view text as a “bag-of-words” and it is possible to add some of this information back into an natural language processing model through the use of feature complexity estimates.
10. Future Work
There are several things that can be done to expand this method. Firstly, one could experiment with the Kolmogorov complexity estimates of different
features then the ones used in this project. One could also experiment with the complexity estimates of non-binary classes. For example what about it we counted nouns as 0 and verbs as 1 and all others as three and then computed complexity. It would also be interesting to use other compression algorithms than run-length compression.
11. References
Brill E. (1995) “Transformation-Based Error-Driven Learning and Natural Language Processing: A Case Study in Part-of-Speech Tagging" Computational Linguistics vol. 21 no. 4 pp 543-565, 1995.
Internet Slang Dictionary www.noslang.com
Joachims T. (1998). “Text categorization with Support Vector Machines: Learning with many relevant features” In Machine Learning: ECML-98, Tenth European Conference on Machine Learning, pp. 137— 142, 1998.
Keselj V., Peng F., Cercone N., and Thomas C. (2003) “N-gram-based Author Profiles for Authorship Attribution” In Proceedings of the Conference Pacific Association for Computational Linguistics,
PACLING'03, Halifax, Nova Scotia, Canada, pp. 255--264, August 2003.
Koppel M., Schler J., Argamon S. and Messeri E. (2006). “Authorship Attribution with Thousands of Candidate Authors” (poster) in Proc. Of 29th Annual
International ACM SIGIR Conference on Research & Developmenton Information Retrieval, August 2006.
Li M. and Vitanyi P. (1997) “An Introduction to
Kolmogorov Complexity and its Applications” Second Edition, Springer Verlag, Berlin, pages 1-188, 1997.
Manning C., Schütze H. (1999) “Foundations of Statistical Natural Language Processing” pp 23-35, MIT Press, 1999.
Schler J., Koppel M., Argamon S. and Pennebaker J. (2006) “Effects of Age and Gender on Blogging” in Proceedings of 2006 AAAI Spring Symposium on Computational Approaches for Analyzing Weblogs.
Seaward L. and Saxton L.V. (2007), "Filtering spam using Kolmogorov complexity measures", to appear in The Proceedings of the 2007 IEEE International Symposium on Data Mining and Information Retrieval (DMIR-07), (Niagara Falls, May 21-23, 2007).
Lexical Measures” Computers and the Humanities, 35(2), pp. 193-214, Kluwer, 2001.
Stamatatos E., Fakotakis N., and Kokkinakis G. (2000). “Automatic Text Categorization in Terms of Genre and Author” Computational Linguistics, 26:4, pp. 461-485, 2000.
Uzuner O. and Katz B. (2005) “A comparative study of language models for book and author recognition” In Proceedings of the 2nd International Joint Conference on Natural Language Processing (IJCNLP-05), 2005.
Weka Project http://www.cs.waikato.ac.nz/ml/weka/
Wiener J. (2006) NLP Parts of Speech Tagger
http://jcay.com/python/scripts-and- programs/development-tools/nlp-part-of-speech-tagger.html