attention-based models, we introduce a Python li-brary that allows users to create web-based in-teractive visual analytics environments, in which they can interrogate the model by perturbing the input text and observing the effects on the atten-tion and predicatten-tion, or modifying the attenatten-tion and studying how it affects predictions (see Figure1). We demonstrate our library applied to two NLP tasks: natural language inference (NLI) and ma-chine comprehension (MC).
2 Related Works
Due to the increasing demand for model inter-pretability, many previous works have been pro-posed for making sense of NLP models by exam-ining individual predictions as well as the model mechanism as a whole. In recent work, Li et al.(2015) investigated the composability of the vector-based text representations using instance-level attribution techniques that originated from the vision community (e.g., Zeiler and Fergus,
2014). In a study of the representation of erasure,
Li et al.(2016) explained neural model decisions by exploring the impact of altering or removing the components of the model (i.e., changing the dimension count of hidden units or input words) on the prediction performance.
Besides interpreting the model via carefully de-signed experiments, several interactive demo/vi-sualization systems, such as AllenNLP’s demos (http://demo.allennlp.org/), often rely on visual encodings to summarize the model pre-dictions. These systems provide a flexible envi-ronment in which the user can experiment with the various inputs and perform error analysis. The hidden state properties of the LSTM are visual-ized and investigated in the LSTMvis visualiza-tion system (Strobelt et al., 2018). Lee et al.
(2017) visualized the beam search and attention component in neural machine translation models, in which the user can dynamically change the probability for the next step of the search tree or change the weight of the attention. In the visual-ization work on question answering (R¨uckl´e and Gurevych, 2017), the system shows the text con-text and highlights the critical phrase that is used to answer the question.
3 Visualization System
As illustrated in Figure1, many recent end-to-end NLP models follow a similar encoder–attention–
classifier structure. The attention stage provides a window to peek into the model decision-making process. However, the static attention alone does not tell the whole story. Our proposed system uses a perturbation-driven exploration strategy that al-lows the user to manually or automatically perturb part of the pipeline and observe the changes down-stream. The system consists of several visualiza-tion components that can be selectively combined to form a functional interactive system for a given task. In the following section, we will cover some of the essential components; the usage of all com-ponents can be found in the accompanying video
link.
Figure 2: The interface for showing input sentences. The user can manually edit the words or apply au-tomatic perturbation/paraphrasing of the inputs. In the “perturbed” drop-down menu, the blue background highlights words not in the original sentence.
3.1 Input Sentences Perturbation
Due to the discrete nature of natural language, automatically perturbing a sentence for sensitiv-ity analysis can be particularly challenging (com-pared to other domains such as images) — small changes in words can lead to drastic differences in the semantics of the sentences. To reduce the po-tential semantic deviation, we allow for a straight-forward perturbation method by replacing nouns
andverbsby their synonyms in WordNet (Miller,
1995). However, synonym replacement does not guarantee that the meaning of the sentence re-mains the same. Furthermore, WordNet often pro-duces rare words or obscure usages that may lead to less meaningful sentences.
Translation Platform), we can obtain paraphrases of the original sentence (see Figure 2, where the drop-down menu shows some of the perturbed sentences).
decision boundary
density contour
map
Figure 3: Summary of the prediction results of the per-turbed input for the natural language inference model. The prediction is encoded as a point in the barycentric coordinate system of the triangle, in which each vertex corresponds to one prediction label.
3.2 Prediction Visualization
Efficient visual encoding for prediction is crucial for communicating the model behavior, and to fully support the input perturbation feature, the vi-sual encoding should also allow multiple predic-tions to be shown in the same visualization.
For the natural language inference task, as il-lustrated in Figure 3, the predicted probabilities are encoded via a triangular barycentric coordinate system, where the vertices represent the three pos-sible predictions (namely, entailment, contradic-tion, andneutral). The prediction for the original unperturbed input is illustrated by a larger yellow circle, whereas the prediction of perturbed inputs is represented by smaller gray circles.
A density contour of the prediction is computed to emphasize the highly cluttered areas and detect outliers.
3.3 Attention Visualization
As illustrated in Figures4(a)(b), the most widely adopted visual encodings for attention are bipartite graphs (a) and heatmaps (b). In the graph attention view (Figure4(a)), the edge thickness corresponds to the attention value of the word pairs. The graph view is suitable for highlighting the most domi-nant alignments. However, the edges may become cluttered if multiple attention values are high. The
matrix attention view (Figure4(b)) resolves these issues, despite being more verbose and less ef-ficient in highlighting the most dominant align-ments. We also enable the linkage between high-lighted actions in both views (see Figure4(a)(b), where one alignment relationship is highlighted).
We augment these standard visual encodings with grammar structure to address the challenge of long sentences. The text can be dynamically simplified based on the dependency tree (see Fig-ure4(a1)). We also show how the dependency in-formation can potentially improve the prediction result in Section4.1. To facilitate the perturbation of attention (see Figure 1), as illustrated in Fig-ure 4(c), we implement an interface for directly manipulating the attention value.
However, when the text sequence becomes sig-nificantly longer, i.e., a full paragraph in the ma-chine comprehension task, even the simplified sentence cannot be meaningfully represented in the graph or matrix visual encoding. To address this visualization challenge, as illustrated in Fig-ure 4(d), we introduce a hierarchical representa-tion. Here, a pure graphical encoding (the color bars marked by att2) is used to capture the ag-gregated attention information for the whole para-graph. The user can focus on localized attention information by selecting a pixel bar that repre-sents a single sentence (the colored blocks in the bar correspond to individual works). We also link this attention representation with the matrix form, such that whenever a sentence is selected the lo-cal attention is shown in the matrix view (see Fig-ure6(a)).
3.4 Implementation
The initial setup cost and unnecessary learning curve are often the barriers to broad adaptation of a tool. Therefore, instead of designing a vi-sualization system as a monolithic standalone ap-plication, we implement the proposed system as a Python library with modularity and ease of use in mind. The different pieces of the visualization (i.e., matrix-based attention encoding) can be ac-cessed individually or combined with other com-ponents to fit one’s workflow via a simple API. More importantly, the library-based design allows easy integration with the existing model imple-mented in Python. The code for creating an in-teractive exploration environment for a machine comprehension model is illustrated below.
(a) Bipartite Graph Attention Representation (b) Matrix Attention Representation
Dependency Tree
(c) Attention Editing Interface
(a1)
(d) Zoomable Attention Representation
Figure 4: Attention visualization. A bipartite graph encoding is adopted in the graph attention view (a), in which the edge thickness corresponds to the attention value. The same attention values can also be directly visualized in the matrix form (b). The user can edit the attention values via the pop-up interface illustrated in (c). We overlay the dependency tree (a1) grammar structure to highlight important words and allow simplification of
com-plex sentences (shown in the video). For highly asymmetric attention, we utilize a zoomable hierarchical visual representation (d). The user can focus on the individual sentence by selecting the summary visualization.
from bidaf_src import bidafModelInterface from NLPutility import translationPerturbation
#initialize machine comprehension model
model = bidafModelInterface(
wordDict="data/bidaf/squad.word.dict", wordVec="data/bidaf/glove.hdf5", model="data/bidaf/bidaf.ema") gen = translationPerturbation()
#visualization components
visLayout = {
"column":[{"row": ["Paragraph",
"AttentionSubMatrix"]}, {"row": ["AttentionAsymmetric"]}] }
#setup interface
modelVis = MCModule(visLayout)
modelVis.setPredictionHook(model.predict) modelVis.setAttentionHook(model.attention) modelVis.setSentenceHook(gen.perturbSentence)
#open browser for the web-based visualization
modelVis.show()
Listing 1: Code for setting up the visualization system shown in Figure6(a).
4 Applications
We demonstrate the proposed visualization system on the decomposable attention network (Parikh et al., 2016a) for the NLI task and the BIDAF model (Seo et al.,2017) for the MC task.
4.1 Natural Language Inference
The NLI task predicts the entailment relationship between a premise sentence (P) and a
hypothe-sis sentence (H). The attention matrix captures the alignment of words between these two sentences. Here we give an example of how a wrong predic-tion can be corrected by editing attenpredic-tion values.
As illustrated in Figure5(a), the input sentence pair (P:“A woman in a green jacket is drinking tea.” H:“A woman is drinking green tea.”) is pre-dicted to beentailment, which is incorrect. By ex-amining the attention, we can see the wordgreen
in “greenjacket” is aligned to thegreenin “green
tea.” However, these two greens modify differ-ent nouns, which potdiffer-entially leads to the wrong prediction. The grammatical structure is visually shown in the form of the dependency tree. How-ever, the model does not have access to the syn-tactic information and mistakenly assumes the two
greensmodify the same thing. To correct the mis-take, we can edit the attention value and remove the align between these two “greens” (see (c)(b)). As expected, the prediction label is corrected ( neu-tral).
4.2 Machine Comprehension
(c) Corrected prediction
(a) Different dependency structure (b) Edit the attention
Figure 5: An illustration of the attention editing process. The dependency structure is shown in (a), where the two “greens” decorate different nouns. By removing the “wrong” alignment in (b), the original predictionentailment is corrected toneutralin (c).
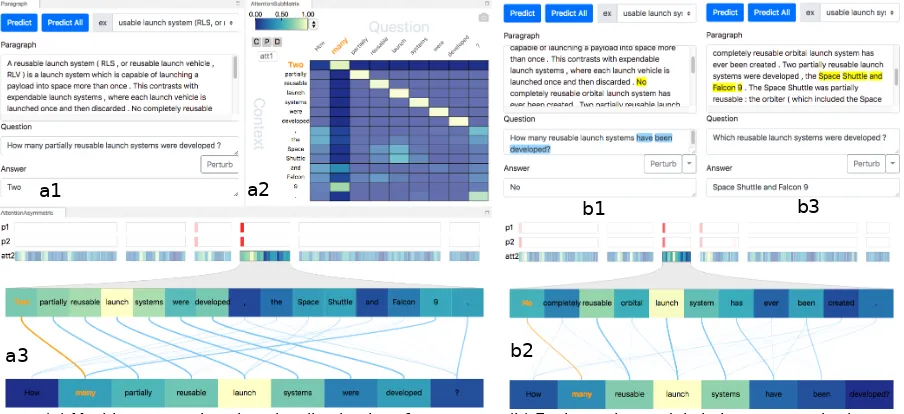
(a) Machine comprehension visualization interface (b) Evaluate the model via inputs perturbation a3
a1 a2
b1
b2
b3
Figure 6: In the machine comprehension visualization interface (a), the p1, p2 colored bar (ina3) illustrates the predicted start and end index of the answer in the context (the deeper the red, the higher the probability). The most likely answer is shown in (a1). The global attention and local attention are visualized by (a2,a3). We can evaluate the robustness of the prediction by perturbing the question sentence (b1,b3). As illustrated in (b1,b2), by removing the word “partial”, the model still finds the correct answer (albeit different, as the sentence perturbation changes the exact meaning of the question).
as a bidirectional alignment (i.e., from context to question and vice versa). Here, we refer the con-text to question attention asatt1and the question to context attention asatt2 (which is a vector in-stead of a matrix according toSeo et al.(2017)). In this demo, we apply a min max normalization foratt2after the softmax layer to better distinguish different attention values.
As illustrated in Figure6, we representatt2 as colored bars with a yellow-green-blue colormap. Each rectangular bar corresponds to one sentence. The user can focus on individual sentences by clicking on the rectangular bar (see Figure6). The
p1,p2 colored bars (white-redcolormap) illustrate the predicted probabilities of the start and the end
index for the answer (the deeper the higher). In Figure6(a3), the sentence containing the answer exhibits good alignment with the question (e.g., “Two” with “many”). Interestingly, the number “9” (in “Falcon 9”) is also aligned with “many”, which may lead to problems.