International Journal of Scientific Research in Computer Science, Engineering and Information Technology © 2018 IJSRCSEIT | Volume 3 | Issue 2 | ISSN : 2456-3307
Effective Debluring Algorithm Using Inertial Motion Sensor
Yashwant Deshmukh*, Prof. B H Pansambhal
Department of Electronic and Telecommunication TSSM’s BhivarabaiSawant College of Engg. And Research, Pune, Maharashtra, India
ABSTRACT
A blurred image can be recognized as a convolution function of a sharp image and a blur kernel or PSF. So in order to recover the sharp image it is needed to know the PSF function which causes the motion blur. The unknown blur kernel estimation is called as the Blind deconvolution. Most of the deblurring techniques make use of these concepts. Few methods such as, Winner Deblur and Luci-Rechard uses sensors to calculate the PSF. In this paper some reading of inertial motion sensor is considered with the value of LEN and Theta to calculate the PSF. At the same time motion blurred images dataset is considered for applying the Blind De-convolution, Winner for the results to calculate best suitable parameters of good quality image output.
Keywords: LEN, THETA, PSF, Winner, De-blu, Blind-Deconvolution.
I.
INTRODUCTION
The relative motion between the camera and the scene causes motion blur for given exposure time. Unintentionally induced blur is a real cause of rejection of images. Every blur follows a particular blur function. If this blur function is known then the image can be enhanced by debluring it with non-blind deconvolution method. In most of the cases, this blur function is unknown and has to be explicitly calculated. This has solved by using a combination of inexpensive sensors (hardware) alongwith an image processing (software) system. The hardware attachment is compatible with consumer camera. A 9dof IMU unit with triple axis gyroscopes, accelerometers and magnetometer has used to measure a camera’s acceleration and angular velocity during an exposure. This data has used to reconstruct camera motion trajectory.
This inertial measurement sensor provides camera coordinates and is used to determine camera motion and thus the camera-shake blur can be obtained, This automatic method gives the exact value of LEN and
THETA to produce point spread function (PSF). Two approaches i.e. Winner Deblur and LUCI-RechardDeblurhas used comparatively with Blind De-convolution to product the result on blurred database.
In second section, proposed system with block description has mentioned. Blind De-convolution and Non-blind convolution hasexplained in third section whereas comparative result analysis has done in further sections.
II.
PROPOSED DE-BLURRING SYSTEM
typical view of the proposed deblur system is given in figure 1.
Figure 1. Typical view of the proposed De-blur system
2.1 Computing PSF using inertial sensor:
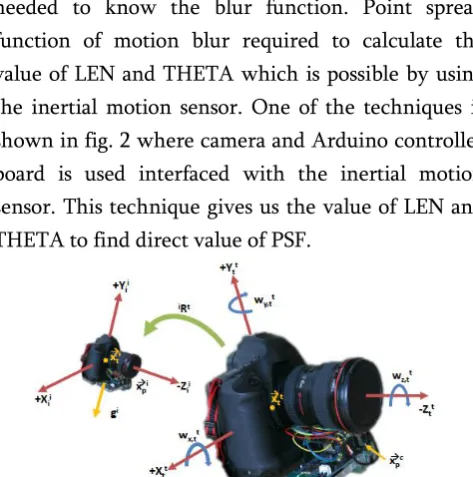
Motion blur is a cause of the movement between camera and object at the time of capturing it. To restore the degraded image at highest efficiency, it is needed to know the blur function. Point spread function of motion blur required to calculate the value of LEN and THETA which is possible by using the inertial motion sensor. One of the techniques is shown in fig. 2 where camera and Arduino controller board is used interfaced with the inertial motion sensor. This technique gives us the value of LEN and THETA to find direct value of PSF.
Figure 2. Camera with arduino and inertial motion sensor.
2.2 Image restoration techniques:
Image restoration techniques are methods which attempt the inversion of some degrading process. It can be broadly classified into two types depending upon the knowledge of degradation. If the prior knowledge about degradation is known then the deterministic method of image restoration can be employed. If it is not known then the stochastic method of image restoration has to be employed.
Figure 3. Image restoration techniques
2.3 De-blurring using Blind De-convolution:
Blind de-convolution is a powerful tool to restore images with little or without any prior knowledge about the point–spread function. Normally iterative blind de-convolution is used with the concept of genetic algorithm.
Figure 4. Overview of Blind De-convolution
The major steps involved in this Evolutionary Algorithm are:-
Mutation: A set of random PSFs is generated in every generation. These PSFs are then used along with all individual images, obtained from the previous generation.
Selection: The individuals in each generation individually undergo a selection procedure called feature vectors. Those individuals which have ῤ value greater than the corresponding expectation value for the generation are excluded.
Clustering: There exist only few individuals at each generation. The survivors are used in the next k + 1th generation.
end. The best image is sort out by adopting fusion method pseudo-wiener distribution.
2. 4 Debluring using Winner Approach:
The wiener filter tries to build an optimal estimate of the original image by enforcing a minimm mean-square error constraint between estimate and original image. It is an optimum filter which minimise the mean square error. It has the capability of handling both the degradation function as well as noise.
Where Sxx(f1,f2), S𝛈𝛈 (f1,f2)power spectra of the original image and the additive noise respectively, and H(f1,f2) is the blurring filter. It is very easy to find that the Wiener filter has two separate components, a converse filtering component and a noise reduction component. It not only de-convolved by converse filtering but also reduces the noise with a compression process.
2.5 Debluring using Lucy-Rechard approach:
The clear image I is computed by Bayesian estimation. The pixel value I(x) is computed according to pixels values B(y) in the blurry image by the following formula:
Where (𝐼𝑥/𝐵Y) can be computed by Bayes’s rule.
Use the accelerated, damped, Lucy-Richardson algorithm to deblur an image using the deconvlucy function. When you have very less knowledge about additive noise and you know the PSF in an image then this method can be effective. The deconvlucy method has maximum likelihood to the original Lucy-Richardson algorithm that deal with typical image restoration process. Applying these adaptations, you can:
Decrease the effect of noise amplification on image restoration.
Deal with camera read-out and background noise.
Improve the restored image resolution by sub-sampling
III.
PARAMETERS FOR GOOD QUALITY OF
IMAGE
a] Sharpness: The sharpness is arguably the most important photographic image quality factor because it determines the amount of detail an imaging system can reproduce. Sharpness is defined by the boundaries between zones of different tones or colors. It is illustrated by the bar pattern of increasing spatial frequency, below. The top portion is sharp; its boundaries are crisp steps, not gradual. The bottom portion illustrates how the pattern is degraded after it passes through a lens. It is blurred. All lenses, even the finest, blur images to some degree. Poor lenses blur images more than fine ones.
Bar pattern: Original (top); with lens degradation sharpness, it has an important limitation. There is no simple way to calculate the rise distance of a complete imaging system from the rise distance of its components— from a lens, digital sensor, and software sharpening.
Where e(m, n) is the error difference between the original and the distorted images.
c] Peak Signal-to-Noise Ratio (PSNR): Signal–to-noise ratio (SNR) is a mathematical measure of image quality based on the pixel difference between two images. The SNR measure is an estimate of quality of reconstructed image compared with original image.
where s = 255 for an 8-bit image. The PSNR is basically the SNR when all pixel values are equal to the maximum possible value.
IV.
RESULT AND ANALYSIS
In this paper, we are mainly dealing with the motion blur problem. Using inertial measurement sensor the Linear and Translational coefficient value i.e. LEN and THETA is considers as LEN=21 and THETA=11. At the same time dataset of input images is considered for calculating and analyzing several results.
Figure 5. Results showing of various input images selected from dataset
Figure 6. Results showing after applying Blind De-convolution with simulation time.
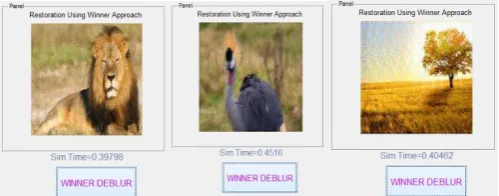
Figure 7. Results showing after applying Winner apporach with simulation time.
Analysis using parameters:
To make the comparative analysis of Blind De-convolution and Non Blind De-De-convolution methods, tabular analysis of parameters is given from which best quality of image and its De-blurring method could be understood. It includes the image quality parameter i.e. Sharpness, Mean Square Error (MSE), Peak Signal to Noise Ratio (PSNR).
Table 1. Analysis of parameters for first input image (tiger.jpg)
Parameter Blind De-convolution
Winner
Sharpness 0.0192 0.0335
MSE 0.0988 0.0956
PSNR 10.0507 10.1955
V.
CONCLUSION
shows better efficiency and more pleasant results of restored images than Blind De-convolution.
VI.
REFERENCES
[1]. NEEL JOSHI, SING BING YANG "Image
debluring using inertial measurement sensors" 2010. ACM Trans. Graph.25 (July), 787-794.
[2]. BASCLE, B., BLAKE, A., AND ZISSERMAN, A.
1996. Motion deblurring and super-resolution from an image sequence. In ECCV ’96: Proceedings of the 4th European Conference on Computer Vision-Volume II, Springer-Verlag, London, UK, 573-582.
[3]. BEN-EZRA, M., AND NAYAR, S. K.
2004.Motion-based motion deblurring.IEEE
Trans. Pattern Anal. Mach. Intell. 26, 6, 689- 698.
[4]. CANON, L. G. 1993. EF LENS WORK III, The
Eyes of EOS.zzz Canon Inc.
[5]. FERGUS, R., SINGH, B., HERTZMANN, A.,
prediction.In Computer Vision and Pattern Recognition, 2008.CVPR 2008. IEEE Conference on, 1-8.
[7]. KUNDUR, D., AND HATZINAKOS, D.
1996.Blind image deconvolution. Signal
Processing Magazine, IEEE 13, 3, 43-64.
[8]. LEVIN, A., FERGUS, R., DURAND, F., AND
FREEMAN, W. T. 2007.Image and depth from a conventional camera with a coded aperture.ACM Trans. Graph.26 (July), Article 70.
[9]. LEVIN, A., SAND, P., CHO, T. S., DURAND, F.,
AND FREEMAN, W. T. 2008.Motion-invariant photography.ACM Trans. Graph.27 (August), 71:1-71:9.
[10]. LEVIN, A., WEISS, Y., DURAND, F., AND
FREEMAN, W. 2009. Understanding and evaluating blind deconvolution algorithms.= In Computer Vision and Pattern Recognition, 2009. CVPR 2009. IEEE Conference on, IEEE
[11]. BASCLE, B., BLAKE, A., AND ZISSERMAN, A.
1996. Motion deblurring and super-resolution from an image sequence. In ECCV ’96: Proceedings of the 4th European Conference on Computer Vision-Volume II, Springer-Verlag, London, UK, 573-582.
[12]. BEN-EZRA, M., AND NAYAR, S. K.
2004.Motion-based motion deblurring.IEEE
Trans. Pattern Anal. Mach. Intell. 26, 6, 689- 698.CANON, L. G. 1993. EF LENS WORK III, The Eyes of EOS.
[13]. Canon Inc. FERGUS, R., SINGH, B.,
HERTZMANN, A., ROWEIS, S. T., AND FREEMAN, W. T. 2006. Removing camera shake from a single photograph. ACM Trans. Graph.25 (July), 787-794.
[14]. JOSHI, N., SZELISKI, R., AND KRIEGMAN, D. J.
2008.Psf estimation using sharp edge
prediction.In Computer Vision and Pattern Recognition, 2008.CVPR 2008. IEEE Conference on,1-8.
[15]. KUNDUR, D., AND HATZINAKOS, D.
1996.Blind image deconvolution. Signal
Processing Magazine, IEEE 13, 3, 43-64.
[16]. LEVIN, A., FERGUS, R., DURAND, F., AND
FREEMAN, W. T. 2007.Image and depth from a conventional camera with a coded aperture.ACM Trans. Graph.26 (July), Article 70.
[17]. LEVIN, A., SAND, P., CHO, T. S., DURAND, F.,
AND FREEMAN, W. T. 2008.Motion-invariant photography.ACM Trans. Graph.27 (August), 71:1-71:9.
[18]. LEVIN, A., WEISS, Y., DURAND, F., AND
FREEMAN, W. 2009.Understanding and
evaluating blind deconvolution algorithms.In Computer Vision and Pattern Recognition, 2009.CVPR 2009.IEEE Conference on, IEEE Computer Society, 1964-1971.