W-PhAMT: A web tool for phonetic multilevel timeline visualization
Francesco Cutugno, Vincenza Anna Leano, Antonio Origlia
LUSI-Lab @ Dipartimento di Scienze Fisiche –Università di Napoli Federico IIComplesso Universitario di M. S. Angelo – 80126 - Napoli
E-mail: cutugno@unina.it, vincenzaanna.leano@unina.it, antonio.origlia@unina.it
This paper presents a web platform with an its own graphic environment to visualize and filter multilevel phonetic annotations. The tool accepts as input Annotation Graph XML and Praat TextGrids files and converts these files into a specific XML format. XML output is used to browse data by means of a web tool using a visualization metaphor, namely a timeline. A timeline is a graphical representation of a period of time, on which relevant events are marked. Events are usually distributed over many layers in a geometrical metaphor represented by segments and points spatially distributed with reference to a temporal axis. The tool shows all the annotations included in the uploaded dataset, allowing the listening of the entire file or of its parts. Filtering is allowed on annotation labels by means of string pattern matching. The web service includes cloud services to share data with other users.
The tool is available at http://w-phamt.fisica.unina.it .
Keywords: multilevel phonetic annotations, timeline, web service
1.
Introduction
Web tools and cloud computing are assuming a stronger and stronger position in the world of software application, especially in the case a large community wishing to share methods, tools and data. Phonetic tools are destined to be included in this scenario with an undeniable advantage in all the cases where a large research group, distributed in different sites, collects, annotates and analyzes a significantly large speech corpus.
Although many research groups declared the intention to afford the realization of web-based phonetic analysis tools, no particular evidence can be found in literature on this matter.
This paper illustrates one of the first attempts to implement a web platform to visualize and filter data coming from multilevel phonetic annotations into a specific graphic environment. The tool, named W-PhAMT (Web Phonetic Annotation Multilevel Timeline), accepts as input XML files respecting the Annotation Graph (Bird and Liberman, 2001), or Praat TextGrids (Boersma, 2001) format and shows in the browser a timeline containing all the annotations included into the dataset. The system allows the audio streaming of the entire file or of one of its parts. Filtering is allowed on annotation labels by means of string pattern matching. A timeline is a graphical representation of a period of time, on which relevant events are marked. Events are usually distributed over many layers in a geometrical metaphor represented by segments and points spatially distributed with reference to a temporal axis. This gives the direct sense of events interrelation and, consequently, it enables a viewer to quickly understand complex temporal relationships.
In phonetics, timeline can find its optimal use in the visualization of speech corpora annotated at many analysis levels eventually spanning over a arbitrarily long temporal duration, as it happens, for example, in annotated dialogues corpora. Each annotation level fits
into a temporal layer, two actors in the dialogue can be plotted together by means of two different timelines referenced to the same temporal axis. For each timeline the necessary number of annotation levels can be shown in the graphic environment. Each annotation is formed by adjacent labels that can eventually be represented with colour alternation; furthermore, filtering is allowed on the data, in the sense that either an entire layer can be added or removed from the timeline, or that just a selection of the annotation set in a specified layer can be conserved after the matching with a user defined regular expression used as a string to match on the labels. User can listen to the audio corresponding to any portion of the displayed annotations.
The tool is offered as a web service, the user uploads his/her data and visualizes results via the browser. In the next future most common form of speech processing utilities could be added in the cloud hosting this service. The service is totally free of charge and can be accessed via the url : http://w-phamt.fisica.unina.it. Users can share their data with the community and can suggest further improvements by collaborating with the authors in a common open project.
This paper presents the definition of the concept of timeline in section 2.1, together with an accurate description of the data format accepted as input (section 2.2). In section 3 a discussion about obtained results and future improvements ideally possible within the tool will be given.
2.
Methods
Existing tools for phonetic analysis synchronizing a temporal representation of an annotated audio/speech segment with the relative audio file, such as Praat (Boersma, 2001) and WaveSurfer (Sjölander and Beskow, 2000) does not succeed in sharing, interoperability and local vs. global time visibility feature.
Firstly, these tools are desktop-based, and consequently the sharing information process among a (geographically) distributed workgroup (sharing) is more complex. Secondly, the lack of a standard inter-exchange file format of the annotation files, discourages, in some cases, and makes it impossible, in other, to compare or to use corpora annotated with different tools (interoperability). Finally these tools provide some functionalities concerning the relation between local versus global time analysis. This concept is related to the idea that speech analysis could be eventually conducted on long speech files, where the events positioning could be obtained as an offset measurement referenced to the absolute start time (global), whereas it would be useful to have the possibility to contextualize phonetic local events referring to the start of the local (idem) temporal sub-division (i.e. turn, or tone-unit, etcetera) (local vs. global time visibility). The idea underlying the developed tool is to improve the previously cited features allowing the users to upload and to give public access to a multilevel phonetic annotation in different formats (interoperability) on a web service (sharing) and to visualize them in an interactive timeline integrated with an audio player (local vs. global time visibility) and, in the near future, adding phonetic analysis plug-in.
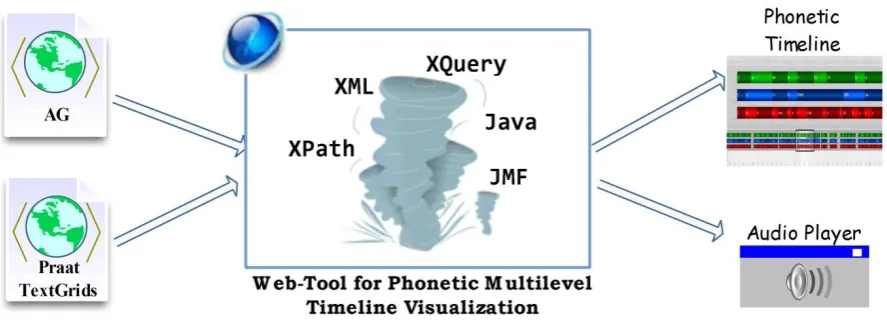
In particular the developed web tool allows the user to upload multilevel phonetic annotation in AG XML format or Praat TextGrid files. The uploaded file can be converted into the accepted XML timeline format. The result of this is used to instantiate the phonetic annotation visualization interface.
The visualization interface is composed of two parts: an interactive timeline representation of the speech annotated file containing various annotation levels on different graphic layers, and an audio player that is
implemented with a Java applet. The timeline and the audio player are synchronized: selecting a single label on the timeline, users can listen to the corresponding part of the audio file. System behavior is shown in Figure 1. A definition of the timeline visualization tool and of the input data format accepted is given in the next sub-section.
2.1. Timeline
In literature a timeline is defined as “a graphical or textual display of events in chronological order (Kumar et al., 1998) and the most used technique for interacting with time-linear visual information. It also allows the user to explore relationships among historical events” (Silva and Catarci, 2000).
In this section a definition of the timeline visualization tool is provided.
A Timeline (TL) is a software tool taking as input a file (in different native formats) representing timed referenced data and producing as output another XML file that could be visualized on a dedicated visualization service (for practical example see Figure 2 in Section 3).
A Timeline is horizontally partitioned in n Layers (Li
i=1…n). Each layer Li represents data at different
granularity (i.e.: word, syllables etc. for phonetic annotated data).
A TL layer is graphically represented by an horizontal band. Each Li has a unit measure for time (umi)
representing time scale of the layer. Allowing different time scales for each layer enables the contemporary representation of data at different granularity.
Layers could contain one or more time referenced objects. An object o is time referenced if it has a temporal extension.
Temporal extension represents the life of the object and can be expressed as:
a point temporal extension, indicated by t;
an interval temporal extension, indicated by [s,t] where s is the start instant, t is the final instant and s<t.
extension is expressible in layer time scale umi.
2.2. File format
As stated in previous section, W-PhAMT accepts as inputs two phonetic annotation file format. A brief description of AG XML format and Praat TextGrid files is now given:
2.2.1. Annotation Graphs
Annotation Graphs (AG) (Bird and Liberman, 2001) are a descriptive model designed to embody the main annotation formats and can be considered as a unifying standard to apply to each speech corpus.
AG are data structures whose nodes are anchored to the signal (and thus contain timing information) while the left to right oriented arcs are labeled with the annotations values. Several relations are defined within arc- and node-like data structures. Temporal precedence relations are stored in the node fields while inclusion, coincidence and overlap relations are topologically expressed by the arc relative positions in the graph structure.
2.2.2. Praat TextGrid files
Praat TextGrid files are an annotation format based on simple text files. There are two different kinds of tiers that can be described in the TextGrid format: interval and point tiers. Interval tiers label speech segments while point tiers mark time instants. Multiple annotation levels, each one having a user defined name, can be included in a single TextGrid file. The reader is referenced to (Boersma, 2001) for further details.
2.2.3. The Simile timeline
In order to realize this tool we made use of an open source widget named Simile Timeline (STL) for visualizing time-based events (Huynh, 2006).
The widget is part of a project called “Simile Project”, maintained by MIT and the Open Source Community.
The STL is based on two key concepts: bands and events. A timeline contains one or more bands, which can be panned by dragging with the mouse pointer, using the mouse scroll-wheel or the keyboard arrow buttons. A band can be configured to synchronize with another band such that panning one band also scrolls the other. This
way it is possible to show multiple layered temporal information acting on different temporal scales in the same picture.
An event is defined as the atomic representation of a temporal information. Generally it can be an instant or an interval labeled by some text describing it.
Each event belongs to a band and each event is arranged on its band to map its temporal position. Instead, the default vertical position of an event does not represent a semantic information: an event is positioned on the uppermost band having enough room to accommodate it. However, it is possible to manually set the vertical position of each event to provide contextual information (such as granularity level or annotated level hierarchy) of the events. Therefore, users can intuitively recognize the temporal relationships among events.
STL has a very high level of customization, interaction and expandability. The entire interface can be modified using CSS, personalizing the colors of events according to the context, or changing band span and dimensions. It is also possible to interact with timeline in different ways. The JavaScript API allows developers to manually scroll the timeline, hide, show and highlight one or more events, in order to provide additional features such as searching and filtering.
For these reasons using STL is a good way to represent phonetic multilevel data: these data types contain many temporal information, such as start time and end time of each element on each level. Again, each element has a phonetic text describing it, and each element belongs to a precise phonetic level. In conclusion, mapping these data on the STL, allows to render a phonetic annotation into a complete graphical representation, with all the benefits in terms of user understanding, information retrieval and visual representation.
3.
Results
The goal of W-PhAMT is to provide a web service allowing a phonetician to analyze (typically) long speech files along with multiple set of annotation in an intuitive, complete and detailed manner. The web tool allows a registered user to upload and store his/her speech
annotation data in two forms: AG XML and Praat TextGrids. User can add new data using the upload form and visualize previously uploaded timelines.
Uploaded data are available for visualization on the timeline after computation. A typical example of visualization is shown in Figure 2: each phonetic annotation level is rendered on a different timeline layer, providing immediate correlation among different annotation levels.
W-PhAMT has a special feature to manage dialogues: in this case the timeline is doubled and synchronized as shown in Figure 3.
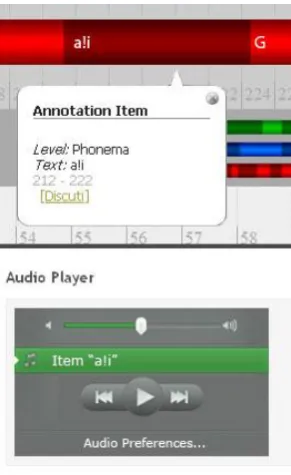
When clicking an event on the timeline (word, part of speech…) a balloon containing more details is shown and the users can listen to the relative audio file, if available, through the embedded player (Figure 4):
In order to improve navigation and information retrieval user can (Figure 5):
navigate using start and end button, or by choosing a temporal instant;
apply a filter, choosing or highlighting elements one would like to concentrate on.
4.
Conclusion
In agreement with what proposed in (Cutugno and Romano, 2011), we are particularly interested in merging two different type of annotations namely what we define as text-aligned annotations vs. time-aligned ones. In (Cutugno and Romano, 2011) authors propose SpLASH, a software tool operating such integration. SpLASH uses only XML native data of any format for text aligned annotations while forces users to adopt Annotation Graph XML format for time-aligned (speech) labels.
W-PhAMT can be considered as an improvement of SpLASH with the added value of being a cloud-oriented web-service, with integration in the visualization frame of phonetic annotations with other linguistic labels.
In this view we are conducting a study on how timed events have been taken into account until now. Annotation Graphs are presently considered the most affordable standard for time representation in Phonetics even if it is not based on a proper hierarchy among annotation levels. In IDE environment (Ide and Suderman, 2007; Ide and Romary, 2009) it is explicitly stated that AG is “not sufficiently general because (1) AG reifies the ‘arc’ and distinguishes it from identification of spans via, e.g. XML tags, and (2) requires ad hoc mechanisms to deal with hierarchically organized annotations (Ide and Suderman, 2007):843)”. In alternative they propose the use of RDF triples with timestamp even if it is not explicitly clarified how to link
Figure 4 - Interaction with timeline events and audio player
Figure 3 - A dialogue visualization example
_start_ and _end_ attributes to serialized text anchors. According to what proposed in (Guiterrez et Al., 2007) and, in combination with the data-model proposed in (Cutugno and Romano, 2011) we are implementing a temporal RDF representation of every timed event as future work . RDF representation of every timed event as a typical RDF triple (a,b,c) with the addition of a related temporal variable t expressing instants or intervals (the correct formalism is (a,b,c)[t] where t1<t<t2 with t1 =t2 if the event is an instant). In this way we recognize the necessity to move semantics from AG arcs to node and triples, but, explicitly, we conserve the idea that Phonetics cannot be constrained by the definition of an internal hierarchy among time-dependent levels of annotation, i.e. according with what formalized in the timeline, timed events are represented as a mere sequences of triple with a timestamp (interval or instant), represented in memory as an acyclic, oriented graph. Querying on these data must take into account paths on the graph as already foreseen in AG-QL (Bird et al., 2000) but, differently from what there stated, SPAR-QL and other RDF query mechanisms can guarantee the formalization of filters that could take into account the Allen’s theory (Allen, 1991) on time operators.
To link phonetic timestamps and textual serialized anchors we further introduce a table-look-up.
This passage is performed by choosing, among the levels contained in label set of the phonetic annotations the most suitable (usually, but not necessarily, words) to be put into one-to-one relation with the lower hierarchical token in the textual annotation framework.
5.
Acknowledgements
Authors wish to thank Antonio Melani and Claudio Papa for software development and testing.
.
6.
References
Allen J. F., (1991). “Time and Time Again: The Many Ways to Represent Time”, International Journal of Intelligent Systems, vol. 6, pp 341-355.
Bird, S., Liberman, M., (2001) . A formal framework for linguistic annotation. Speech Communication, 33(1-2):23-60.
Bird S., Buneman P., Tan W.C., (2000). “Towards a query language for annotation graphs”. The Computing Research Repository (CoRR).
Boersma, P., (2001). Praat, a system for doing phonetics by computer. Glot International, 5(9/10):341–345. Cutugno, F., Romano, S., (2011). Time- and text-aligned annotations: the splash data model. In Proceedings of
VLSP 2011, pp. 115–118, The University of Pennsylvania, Philadelphia, USA.
Huynh, D., (2006). Similetimeline. Available on line at http://www.simile-widgets.org/timeline/, accessed on Mar 2012.
Ide, N., Romary. L., (2009). Standards for language resources. In Proceedings of Third International Conference on Language Resources and Evaluation - LREC 2002, pp. 839–844.
Ide, N., and Suderman. K., (2007). Graf: a graph-based format for linguistic annotations. In Proceedings of the Linguistic Annotation Workshop, LAW ’07, pp. 1–8, Stroudsburg, PA, USA. Association for Computational Linguistics.
Kumar, V., Furuta, R., Allen, R.B., (1998). Metadata visualization for digital libraries: interactive timeline editing and review. In Proceedings of the third ACM conference on Digital libraries, DL ’98, pp. 126–133, New York, NY, USA. ACM.
Silva S.F., Catarci T., (2000). Visualization of linear time-oriented data: A survey. In Proceedings of the First International Conference on Web Information Systems Engineering (WISE WISE’00) - Volume 1, WISE ’00, Washington, DC, USA. IEEE Computer Society.