The most efficient coursewareCˆis obtained by solving an optimization problem defined as ˆ
C= arg min
C Length(C) (1)
whereCsatisfies the two conditions and Length(C)is the number of tokens6inC.
In the next section, we describe the greedy method7that we used in the experiment to construct effi-cient courseware.
3 A method for constructing efficient courseware
LetCbe the courseware under development. We iteratively put a document that has the largest number of new types (types contained inV but not inC) intoCuntilCcovers all ofV.
More concretely, letVtodo be the part of the target vocabulary not covered byC, and letVdone be the
rest of the target vocabulary that is already covered byC; i.e.,Vtodo∪Vdone=V,Vtodo∩Vdone=φ. We iteratively put documentdintoCthat maximizesG(·),
G(d|α, Vtodo, Vdone) =αg(d|Vtodo) + (1−α)g(d|Vdone), (2)
untilCcovers all ofV. We then defineg(·)as
g(d|Vx) = k1+ 1
k1((1−b) +bE|(W|W(d(·))||)) + 1
|W(d)∩Vx|, (3)
whereW(d) is the set of types in d, E(|W(·)|)is the average for |W(·)|over the whole corpus, and
k1 and bare parameters which depend on the corpus. We set k1 andb as 1.5 and 0.75, respectively. g(d|Vx) takes a large value when the number of common types betweenW(d)andVx is large and the length ofdis short. These effects are due to|W(d)∩Vx|and E|(W|W(d()·)||) respectively. g(·) is based on the Okapi BM25 function (Robertson and Walker, 2000), which has been shown to be quite efficient for information retrieval, so we expectedg(·) to be effective in retrieving documents relevant to the target vocabulary.
In Equation (2),αis used to combine the scores of documentdthat are obtained by usingVtodo and
Vdone. It is defined as
α = |Vdone|
1 +|Vdone| (4)
This implies that even if|W(d)∩Vtodo|is 1, it is as important as|W(d)∩Vdone| = |Vdone|. Con-sequently,G(·)uses documents that have new types of vocabulary in preference to documents that have already covered types.
To summarize, efficient courseware is constructed by putting documentdof maximumG(·) intoC until C covers all of V. This allows us to construct efficient courseware that satisfies Equation (1) approximately becauseG(·)takes a large value when a document has a large number of new types and its length is short. The courseware thus obtained satisfies Conditions 1 and 2 by construction.
4 Experiment
This section describes the courseware constructed by applying the method described in the previous section. We first describe the vocabulary and corpus used to construct the courseware and then show the effectiveness of the courseware compared with that of randomly chosen documents. Finally, we describe the use of the courseware in an English course.
6
A token refers to each occurrence of a unique word (type).
4.1 Vocabulary
We used the specialized vocabulary for the Test of English for International Communication (TOEIC) because the TOEIC is one of the most popular English certification tests in Japan. The vocabulary was compiled by (Chujo, 2003), who confirmed that the vocabulary was useful in preparing for the TOEIC test. The vocabulary has 640 entries. When an entry consisted of multiple words, we used all of them. For example, we used the two words, “advertisement” and ”ad”, of the entry koukoku in the vocabulary. Consequently, we used 642 words in the vocabulary that occurred at least once in the corpus described below as the target vocabulary.
4.2 Corpus
We used articles from The Daily Yomiuri newspaper from 1989 to 2001 as the corpus. The corpus consisted of about 110,000 articles, from which we extracted about 25,000 articles8of 300 words or less. The 300-word limit was set on an empirical basis to reduce the burden on learners.
We used English processing software9to tokenize, POS-tag, and lemmatize the corpus. Lemmatization was necessary to match the words in the target vocabulary with the words in the corpus.
4.3 Example article
Figure 1 is an example of the articles in the courseware. It was the first article obtained by the algorithm. It shares 43 types and 61 tokens with the target vocabulary. These words are printed in bold when they first appear and in italic afterwards.
Being the first article selected, this was the best article in terms of Equation (2). The other articles inevitably shared fewer common words with the target vocabulary than this article did. However, the number of common words in subsequently selected articles was still significantly greater than for ran-domly chosen articles as we discuss in the next section.
4.4 Courseware statistics
4.4.1 Comparison to randomly sampled articles
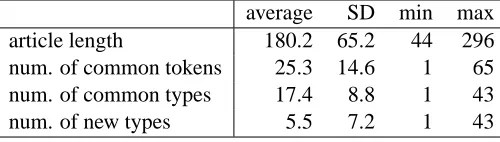
Table 1 shows basic statistics of the courseware constructed from the target vocabulary and corpus. The courseware consisted of 116 articles and 20,900 tokens. The average length of articles was180.2(= 20900/116) tokens. The average number of tokens per article shared with the vocabulary (“num. of common tokens” in the Table) was 25.3 and that of types (num. of common types) was 17.4. About 14%(= 25.3
180.2 ×100)of the tokens in each article were covered by the vocabulary. The average number
of new types contained in each article (|W(d)∩Vtodo|in Section 3) was 5.5.
Table 1: Basic courseware statistics (number of articles: 116). average SD min max article length 180.2 65.2 44 296 num. of common tokens 25.3 14.6 1 65 num. of common types 17.4 8.8 1 43
num. of new types 5.5 7.2 1 43
SD means standard deviation.
These statistics were relatively dense compared with those of randomly sampled articles. We randomly sampled 1,000 sets of articles. Each set contained randomly sampled articles which consisted of 20,900 tokens (around 111 articles). For each set, we calculated the statistics shown in the first column of Table
8
Each of these 25,000 articles had a Japanese counterpart that was estimated to be a translation of the English article. The translation relationship was identified by (Utiyama and Isahara, 2003). These translations helped the students understand the English articles.
9http://www2.nict.go.jp/jt/a132/members/mutiyama/software.html
NTT Corp’s restructuring plan, which aims to transfer 110,000 workers to subsidiaries, will cost the telecom giant a hefty 1.4 trillion yen to 1.5 trillion yen, The Yomiuri Shimbun learned Thursday.
The plan is expected to be so expensive because of ballooning retirement and other compensation allowances that will be paid to about 55,000 workers.
NTT will earmark lump-sum expenses in its fiscal 2001 account settlement ending in March to make up for the costs of the large-scale streamlining plan scheduled to be implemented in spring.
The nation’s largest telecommunications company, which originally forecast after-tax profits of 3 billion yen for the current fiscal year, is predicting a loss of hundreds of billions of yen.
Under the restructuring plan, NTT will transfer a total of 110,000 of its 210,000 workers, mostly from its two
regional phone operators–NTT East Corp. and NTT West Corp.–to other group companies to be set up. Among those
transferred, 55,000 workers aged 51 and above will be retired and rehired at salaries as much as 30 percent lower than those they are currently receiving.
The move comes amid sluggish demand and deteriorating earnings by the two regional phone operators, which are currently cutting rates due to intensifying competition.
NTT’s labor union, which reached a broad agreement on the company’s restructuring plan at its August convention,
approved the management’s plan in its extraordinary central committee meeting on Thursday.
The union also approved the management’s offer regarding the amount of compensation to be paid to transferred
employees.
The restructuring plan will cost NTT about 1.1 trillion yen in retirement allowances and about 300 billion yen in allowances to compensate for average cuts of 55 percent in workers’ lifetime wages. NTT will likely cover the expenses with bank loans or by selling land and other corporate assets.
Figure 1: Example article
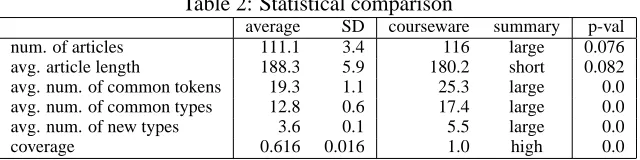
2 and then averaged them over all sets. For example, for each set, we calculated the average numbers of tokens and types per article that were shared with the vocabulary (“avg. num. of common tokens” and “avg. num. of common types” in the Table). We then calculated the averages of those numbers over the 1,000 sets. The average for tokens was 19.3 and that for types was 12.8. These values are shown in the “average” column in Table 2. The corresponding courseware statistics are shown in the “courseware” column. The “summary” column shows how these statistics compare to those of the randomly sampled articles. The differences between the statistics of the courseware and those of the randomly sampled articles were statistically significant as indicated in the “p-val” column.10
Table 2: Statistical comparison
average SD courseware summary p-val num. of articles 111.1 3.4 116 large 0.076 avg. article length 188.3 5.9 180.2 short 0.082 avg. num. of common tokens 19.3 1.1 25.3 large 0.0 avg. num. of common types 12.8 0.6 17.4 large 0.0 avg. num. of new types 3.6 0.1 5.5 large 0.0
coverage 0.616 0.016 1.0 high 0.0
We want to emphasize the comparison of the coverage shown in the bottom row of Table 2. Coverage means the proportion of the types in the target vocabulary that are covered by the courseware. It was 1.0 for the constructed courseware. However, the average coverage of the randomly sampled articles was 0.616; i.e., about 40% of the target vocabulary was not covered by the randomly sampled articles.
These results indicate that the courseware was more efficient (as defined in the Introduction) than the randomly sampled articles.
10
4.4.2 Distribution of common types
Figure 2 shows the distribution of the number of types against the order (ranking) of articles that were put into the courseware. The horizontal axis indicates the ranking of articles and the vertical axis indicates the number of types. The solid line shows the number of new types contained in the articles and the cross-shaped points show the number of common types. As shown, the number of new types decreased rapidly as the ranking of the article increased. This demonstrates that Equation (2) prefers documents that have many new types. Figure 2 also indicates that the number of common types was relatively large even when the ranking increased. Therefore, students will have an opportunity to learn new types while continuing to see previously learned types.
0 5 10 15 20 25 30 35 40 45
0 20 40 60 80 100 120
num. of types
article ranking
num. of new types num. of common types
Figure 2: Distribution of the number of types
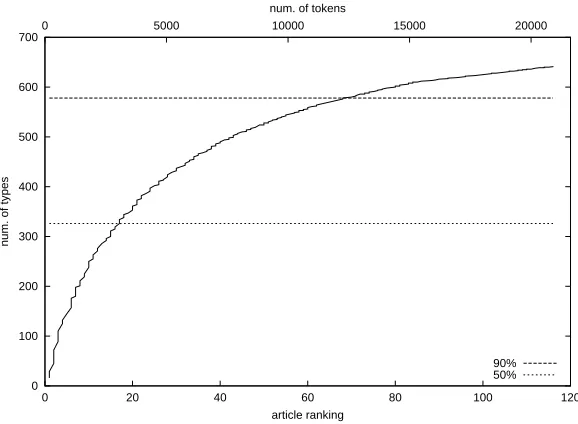
Figure 3 shows the increase in the number of covered types. The horizontal axis indicates the ranking of articles and the number of tokens. The vertical axis indicates the number of covered types. The increase was sharpest when the ranking value was lowest (at the left part of the figure). The dotted horizontal lines indicate 50% and 90% of the target vocabulary. These lines cross the solid line at 18% and 67% of the total number of tokens, respectively.
Figures 2 and 3 show that students can learn most of the target vocabulary from the beginning part of the courseware. This is desirable because students sometimes do not have enough time to study all the courseware.
4.5 Usage discrepancies between the target vocabulary and courseware
We used the specialized vocabulary for the TOEIC as the target vocabulary and made the courseware from The Daily Yomiuri newspaper articles. As a result, usage discrepancies between the TOEIC and The Daily Yomiuri caused mismatches in the meanings of some words. For example, “agency” mostly means “a business that provides particular services” such as “an advertising agency” in TOEIC contexts. However, it often means “a government department” in The Daily Yomiuri contexts. Such mismatches confuse students. This is a difficult problem to solve because it involves word sense disambiguation. We can remedy the mismatches in word meaning, though, if we provide a corpus that matches the target vocabulary.
4.6 Use in the classroom
Since May 2004, we have been using the courseware described above as supporting materials in univer-sity English classes. A detailed evaluation of the constructed courseware is ongoing.
0 100 200 300 400 500 600
0 20 40 60 80 100 120
num. of types
article ranking
90% 50%
Figure 3: Increase in the number of covered types
A benefit of the courseware is that it enables students to infer the meaning of a target word from the surrounding context. Thus, the courseware fosters an essential ability in reading.
A problem with this courseware is that some articles are too difficult for the students. However, the students’ motivation to learn from the courseware is high. We attribute this to the authenticity of the TOEIC vocabulary and The Daily Yomiuri newspaper articles. Students are keenly aware of the need to learn the TOEIC vocabulary because of recent job market trends requiring moderate ability in English. The courseware has been accepted by the students as an effective tool for learning the TOEIC vocabulary from real texts.
5 Related work
Natural language and speech processing technologies have been used elsewhere in EFL. For example, they have been applied to automatic essay rating, pronunciation testing, and automatic setting of test problems (Burstein and Leacock, 2003).
The focus of these studies was on automating individual activities in a class. Our work, however, focuses on making courseware that can be used during an English course. They are complementary rather than alternative.
6 Conclusion
Although a wide range of English reading materials are available through the Internet, it is difficult to select appropriate materials to construct courseware for use as part of an English course.
We have developed a method for constructing courseware from a target vocabulary and a corpus. The courseware we constructed using this method consisted of articles in which the target vocabulary words frequently occurred.
References
Burstein, Jill and Claudia Leacock, editors. 2003. HLT-NAACL 2003 Workshop on Building Educational Applica-tions Using Natural Language Processing.
Chujo, Kiyomi. 2003. Eigo syokyuu-sya muke “TOEIC goi 1,2” no sentei to kouka. Nihon Digaku Seisan Kougaku-bu Kenkyuu Houkoku Vol.36, pp.27–42.
Robertson, S. E. and S. Walker. 2000. Okapi/Keenbow at TREC-8. In Proc. of TREC 8, pages 151–162.
Utiyama, Masao and Hitoshi Isahara. 2003. Reliable measures for aligning Japanese-English news articles and sentences. In ACL-2003, pages 72–79.
Williams, H.P. 1993. Model Building in Mathematical Programming. John Wiley & Sons Ltd.