A Debugging Framework for N
IPS
Master thesis
by Riemer van Rozen
October 2007
Committee
dr.ir. Theo Ruys
dr.rer.nat. Michael Weber dr.ir. Arend Rensink
Research Group
I would like to thank Theo Ruys and Michael Weber for being my first and second advisor, for their ideas and feedback and the long meetings at the UT and the CWI,
Arend Rensink for being third advisor,
Patricia Dockhorn for some general pointers about the thesis structure, my colleagues Frank van Es and Paul Zandbergen for providing feedback on spelling mistakes and sentence structure, Ismenia Galvao for being patient and sweet and my parents for supporting me during my education and for raising me.
Intended Audience
The intended audience of this thesis report consists of experienced professionals in the field of Formal Methods and Software Engineering, as well as students with interest in debugging information.
SDI
Simple,Static,Smurf
Contents
1 Introduction 7
1.1 Background . . . 8
1.1.1 Model Checking . . . 8
1.1.2 Compiling and Debugging . . . 9
1.1.3 TheNips VM . . . . 11
1.2 Problem Statement . . . 11
1.3 Objectives . . . 12
1.4 Approach . . . 12
2 Related Work 15 2.1 TheNipsVM . . . . 15
2.1.1 Motivation . . . 15
2.1.2 Language . . . 16
2.1.3 Design . . . 17
2.1.4 Applications . . . 20
2.2 Debugging Information Formats . . . 20
2.2.1 Stabs . . . 21
2.2.2 Dwarf . . . . 21
2.2.3 GDB . . . 22
2.2.4 JavaclassFile Format . . . 22
2.3 Model Checkers . . . 24
2.3.1 Spin . . . 24
2.3.2 JPF . . . 26
2.3.3 Bogor . . . 27
2.4 Evaluation . . . 28
2.4.1 Model Checkers . . . 28
2.4.2 Debugging Information . . . 29
2.5 Concluding Remarks . . . 31
3 The SDI Language 33 3.1 Introduction . . . 33
3.2 Memory Model . . . 34
3.2.1 Modeling Notation . . . 36
3.2.2 Furniture Factory Example . . . 37
3.3 List Language . . . 41
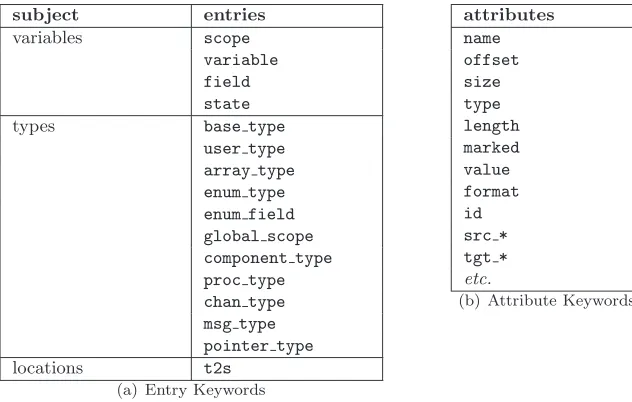
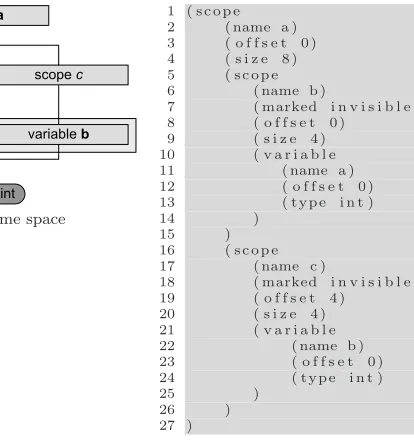
3.4 Variables . . . 42
3.4.2 Attributes . . . 43
3.5 Types . . . 45
3.6 Locations . . . 52
3.7 Concluding Remarks . . . 54
4 The SDI Framework 57 4.1 Introduction . . . 57
4.2 Syntactic Analyser . . . 61
4.3 Symbol Table . . . 62
4.3.1 Component Types . . . 65
4.4 State API . . . 67
4.4.1 State Factory . . . 70
4.4.2 Modeling Notation . . . 72
4.4.3 Threads Example . . . 73
4.5 Transition API . . . 77
4.5.1 Component Transition Instructions . . . 77
4.6 Compiler Extensions . . . 83
4.7 The SDI Debugger . . . 85
4.8 Concluding Remarks . . . 87
5 Case Study 89 5.1 A Debugger for Nips . . . . 89
5.1.1 Memory Model . . . 91
5.1.2 Debugging API . . . 92
5.1.3 TheNipsDebugger . . . . 98
5.2 Evaluation . . . 100
5.2.1 Debugging Functionality . . . 100
5.2.2 Implementation Effort . . . 101
5.3 Concluding Remarks . . . 102
6 Conclusion 103 6.1 Contributions . . . 103
6.2 Future Work . . . 105
A Enhancing the Nips VM 111 A.1 Introduction . . . 111
A.2 TheNipsVM API . . . 112
A.2.1 Initialization . . . 112
A.2.2 Scheduler . . . 113
A.3 Design Suggestions . . . 114
A.3.1 Depth First Search . . . 114
A.3.2 State Space Organisation . . . 115
A.3.3 Error Handling . . . 116
A.3.4 Language Support . . . 116
A.3.5 Code Optimization . . . 117
A.3.6 Transitions . . . 117
CONTENTS CONTENTS
B Nips Compiler Extensions 119
B.1 Predefined SDI . . . 119
B.2 Program defined SDI . . . 120
B.2.1 Variables . . . 120
B.2.2 Types . . . 122
B.2.3 Locations . . . 122
C Furniture Factory Example 125 C.1 SDI . . . 125
Chapter 1
Introduction
Software Engineering is the field in Computer Science concerned with the process of software development and all its intricacies. The system design life cycle can be modeled using the
waterfall model, in which the sequential development phases are conceptually linked [34] as is
depicted in Figure 1.1. The phases are often repeated iteratively, resulting in a new version of the software every iteration.
analysis
design
code
test
Figure 1.1: Waterfall Model
A major goal of software engineering is to enable developers to construct systems that operate reliably despite their scale and complexity. To this end a lot of time and attention is spent on testing whether the software system meets its requirements.
Formal methods are mathematically based languages, techniques, and tools that can be used to specify and verify large and complex systems [7]. Tools have been derived from these formal methods that offer functionality supporting activities in the design, coding and testing develop-ment phases. The software industry is motivated to use these tools because they can play an important role in developing reliable and quality software. They can help in the early identifica-tion of software (design) errors which become more expensive and time-consuming to find and repair later in the system design cycle. The tools that we are concerned with in this thesis report
1.1
Background
Model checkers, compilers and debuggers are tools that provide specific contributions to the formal design of software systems. This section introduces basic ideas concerning them.
1.1.1
Model Checking
Model. A model formally describes the behaviour of a system whilst abstracting from details
which are not relevant for its use. The representation of a model may be abstract, but mod-els may also be textually represented in a modeling language. Design modmod-els can be used to formally specify systems before they are implemented or they can be extracted from system implementations.
Simulation. A simulation is a step-by-step execution of a model. Simulations can be used to
show the behaviour of a system. In particular, it can be used to show acounter-example, which
is sequence of steps leading to an undesired situation.
Property. A property specification formally describes a requirement about the system which
can be an invariant or related to safety, fairness, liveness, etc. Properties are typically described using formal specifications which are expressed as logic formulas, e.g. Linear Temporal Logic (LTL) or Computation Tree Logic (CTL) and may be associated with an automaton [23].
Model Checking. Model checking is a formal method used to automatically verify the
cor-rectness of finite-state systems with respect to specification properties. Verification algorithms
are used to traverse every possible behaviour of the model, also referred to as thestate space, to
check whether a property holds (is true) or not. If the property holds then the model satisfies a specification. If the property does not hold, a counter-example is produced.
In [13] the two fundamental approaches to model checking are described: In symbolic model
checking a symbolic representation for the state set is used, usually based on binary decision
diagrams. Validating a property in symbolic model checking amounts to performing a symbolic fixpoint computation. Symbolic model checking works especially well for hardware verification.
Inexplicit state model checking an explicit representation of the system’s global state graph is
used, usually given by a state transition function. The validity of LTL properties over a model are evaluated by interpreting its global state transition graph as a Kripke structure. For every
LTL formula there exists a B¨uchi automaton that accepts precisely those runs that satisfy the
formula. Verifying that a modelM satisfies a property Φ: M |= Φ entails performing a partial
or a complete exploration of the state space. A comprehensive foundation to model checking is given in [6].
Model Checker. A model checker is a tool that is concerned with automating the search
for errors in software (designs) by providing model checking as a push-the-button functionality. Usually a model checker also supports one or more forms of simulation.
One model checker that has been successfully applied in many software design projects isSpin
[20]. The input language of Spin is Promela(Process Meta-Language) which is a high level
language used to model concurrent systems. Spin will be a benchmark tool reference in this
report. Indeed much of the ideas in this report, the context and the reasoning have been derived
CHAPTER 1. INTRODUCTION 1.1. BACKGROUND
1.1.2
Compiling and Debugging
Compiling and debugging code are strongly related activities. We will give an introduction to both compilers and debuggers and explain what they have to do with each-other.
Compilers can be used by programmers to translate high level languages to low level runnable machine code. The process of compiling a program from human-readable form into the machine
code that a processor can execute is described in [10] as: ”successively recasting the source
programs into simpler and simpler forms, discarding information at each step until, eventually, the result is a sequence of simple operations, registers and memory addresses and binary values that consist of zeros and ones.”
A multi-pass compilation scheme can be described as a sequence of steps (or passes). Each
step performs a specific operation on the same structures in order to perform a translation.
In contrast, a single-pass compilation scheme performs the translation in one step. Figure 1.2
schematically depicts a multi-pass compilation scheme at compiler time and shows that we can either run or debug a program at run-time. Multi-pass compilers are also explained in [49].
source program
Compiler-Time Run-Time
Syntactic Analysis Contextual Analysis Code Generation
scanner
Figure 1.2: Multipass Compiler
Multi-pass compilation. The first phase of the compilation process is thesyntactic analysis
phase in which the source program is scanned by a scanner (also called lexer) and represented
as a stream of tokens, the basic textual building blocks of the language. They are the input
for the parser which is based on a grammar and creates an Abstract Syntax Tree (AST), an
intermediate representation of the program syntax. It is practical to describe a grammar in EBNF (Extended Backus-Naur Form) which is a standard form to describe the structure of
programming languages. After the syntactic analysis phase, the compiler performs a contextual
analysis of the AST which means it is analyzed for type correctness and contextual constraints.
A symbol table is used to store and retrieve information about variable declarations in order to
facilitate scope and type checking and code generation. The information about variables that
may be retrievable are itstype, the source line and column number of the corresponding token
and the memory location at which the variable will be saved within the machine at run-time.
The final phase of the compilation is the code generation in which the AST of a program is
translated to a lower level language called the target language. Sometimes it is necessary for an
assembler to transpose the generated code before it can be executed. Assemblers may create
object files, binary files that contain object code which consists of zeros and ones. In order to
create an executable, object files have to be linked to other object files by a linker. Compilers
Run-time. A compiled program can be run by a program user who may interact with the program and view the results on the screen. The compiled program consists of code that is either
run directly on the Central Processing Unit (CPU) or it is abyte code that is interpreted by a
Virtual Machine (VM). A VM differs only from physical machines in that it is not represented by a hardware component directly but is a program itself running on another machine.
Debugging. In case of a program error at run-time the programmer can either examine the
source code or the generated code. In order to be able to examine binary target code it must be
analyzable in terms of the source code. Asource-level debugger is a tool that depicts the progress
of a program in terms of its program source and allows control over the program control flow in order to find software bugs.
Debugging is the process in which software developers use a debugger to prove or disprove
hypotheses about the source program. Debugging is related to model checking, simulation and testing. In testing, hypothesis about the program are described as test-cases which consist of a predefined expected result and the observed result. When the two correspond the test passes,
otherwise it fails. Aside from being used for complete validation to certify the quality of the
product or design model by establishing its absolute correctness, a model checker can be used
as a debugging aid to find residual design and code faults using partial state space exploration
methods [13]. The counter-examples produced by model checkers provide a means to simulate the source program and direct the behaviour to the error state. Testing, debugging and model checking are complementary activities because any verification is only as good as the validity of the system model.
Ryu et. al describe two fundamental approaches to source-level debugging of compiled code in
[39]: The first approach isreverse engineering where the compiler generates code and additional
information that enables the debugger to analyze the object code and report information at
the source level, e.g. ldb [35], GDB and ACID [52]. The second approach is instrumentation
where the compiler modifies the program code and inserts extra instructions that are used for
debugging, e.g. smld [45]. Although instrumentation can provide debugging support with a
modest effort it is also slow at run-time [39].
Debugging Information. We definedebugging information as the extra, optional information
generated by the compiler which is (usually) not necessary for programs to run, but which is necessary for debuggers to make source-level debugging possible.
Reflection. Debugging information is related to an object oriented design pattern called
re-flection. Bobrow et al. define reflection in [4] as a mechanism for observation and modification:
”Reflection is the ability of a program to manipulate as data something representing the state of
the program during its own execution”. There are two aspects of such manipulation:
introspec-tion andintercession. The first aspect is the ability of a program to observe and reason about
its own state. The second is the ability for a program to modify its own execution state or alter
its own interpretation or meaning. Both aspects requirereification, which is a mechanism for
encoding execution state as data.
Parson et al. pose in [31] that: ”Reflection provides a powerful means for a target software
CHAPTER 1. INTRODUCTION 1.2. PROBLEM STATEMENT
1.1.3
The Nips VM
The Nips VM is targeted to be a fast, reusable, Embeddable Virtual Machine for State Space
Generation [50]. The Nips VM and the Nips byte code it runs are designed for operational
models of high-level languages for use with verification tools. The VM can play the role of the
state space generation back-end in an explicit state model checking framework. Using the Nips
VM as tool back-end saves the tool engineer the often complex and time-consuming task of having to design and implement a model checking engine. Furthermore, the design allows the reuse of modeling languages and common (byte code) analyses.
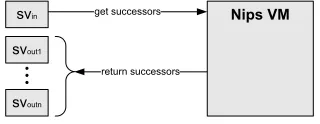
TheNipsVM runsNipsbyte code supplied by a compiler, executes its semantics and generates
states vectors, low level snapshots of the system behavior, based on the byte code and an input
state vector. TheNipsVM Application Programming Interface (API) is schematically depicted
in Figure 1.3.
get successors svin
return successors svout1
Nips VM
svoutn
Figure 1.3: NipsVM API
TheNips Promela Compiler translatesPromelamodels, created by the tool user intoNips
byte code. Together with the NipsVM and a scheduler component, it forms an explicit state
model checker that offers comparable functionality to theSpinmodel checker.
The NipsVM is mainly distinguished from other explicit state model checkers by its modular
design and its small implementation. Consequently, it can be embedded in host-tools as a model checker engine. The host-tools determine the strategy for the search of the state space and may
use any high level language, provided that it can be translated toNipsbyte code. Furthermore,
the Nips byte code can be optimized as a means for state space reduction and the Promela
compiler allows the reuse of a large amount of case-studies.
1.2
Problem Statement
This thesis is concerned with working towards fulfilling the promise of theNipsVM as a reusable
component for state space generation that is part of a extensible tool set of explicit state model checker components. The following problems related to model checking and debugging regarding
theNipsVM can be identified.
State BLOBs. The main problem with theNipsVM is that it cannot be properly used since
the output consists of state vectors, i.e. arrays of unnamed, untyped bytes which are displayed as Binary Large Objects (BLOBs).
Debugging. Consequently, theNips VM misses debugging functionality. Users of Nips VM
tools cannot analyse the behaviour of design models compiled to Nips byte code. The need
generates.
Debugging Information. We lack the language to describe source level information that can
be used by a debugger for Nips to display states at run-time. The question is what kinds
of debugging information there are and what they can be used for. What should debugging
information tailored towards theNipsVM look like, and how can this information be provided
by compilers targeting it?
Embeddable Nips VM.TheNipsVM is designed to be an embeddable component for state
space generation, but it is unclear how it can be embedded in host applications because it consists
of undocumented C code. For tool engineers that wish to embed theNipsVM as a explicit state
model checker back-end, it needs to be clear what the Nips VM API is in terms of functions
and procedures and their arguments, such that they can design host applications that can gain
access to the VM. How can theNipsVM be embedded? Does the VM offer all the services host
applications need to make use of it? If not, then in what way does the API need to be extended or altered?
1.3
Objectives
The primary goal of the research work elaborated in this thesis is to allow users to make use of
NipsVM based tools and to make it more attractive to tool engineers to embed the NipsVM
as a tool back-end. The objectives are sub-devised as follows.
• Readable States. States and counter-examples should be unparsed to their source-level
equivalent allowing program debugging, simulation and viewing model checking results.
• Embeddable Nips VM. The Nips VM should be more easily embeddable in host
ap-plications by giving access to state components and facilitating state introspection, paving
the way for state-of-the-art state space reduction techniques such as state collapsing [19]
andPartial Order Reductions (POR) [6, 36].
The research must be applicable to the field of explicit state model checking but the specific goal
of the research is to extend the application field of theNipsVM.
1.4
Approach
We discussed the problems regarding theNipsVM related to model checking and debugging in
Section 1.2 and set specific goals to achieve a subset of these problems in Section 1.3. Here we give an outline of the approach on how to achieve the objectives and a chapter structure of the report. Figure 1.4 shows the chapter overview.
Chapter 2 places the thesis research in context. It elaborates and explains references used in the introduction background. Existing definitions of debugging information formats are discussed
to see if there is a likely candidate to be used with theNips VM. Existing implementations of
explicit state model checkers similar to theNipsVM are compared with theNipsVM.
The study into related work in Chapter 2 yielded no immediate solution that could easily be
lan-CHAPTER 1. INTRODUCTION 1.4. APPROACH
guage must be defined which is both general and reusable, but which can be specifically used to
support a debugger for theNipsVM.
Chapter 2
Chapter 3 Chapter 4
Chapter 5
Chapter 6
used in
Chapter 1
Appendix
(a) Chapter Structure
Chapter 1: Introduction
Chapter 2: Related Work
Chapter 3: The SDI Language
Chapter 4: The SDI Framework
Chapter 5: Case Study:
TheNipsDebugger
Chapter 6: Conclusions & Future Work
Appendix A: Enhancing theNipsVM
(b) Chapters
Figure 1.4: Chapter Overview
In this thesis the reverse engineering approach to debugging is applied. We believe that debugging information provides a means to define an API that gives access to the memory model of a running
program, which can be used for debugging1.
A debugging API provides the means for a debugger to offer debugging functionality such as
displaying states at run-time to the user in an understandable way and allowing users to edit state values. Displaying states can be seen as a form of introspection, editing state values as a form of intercession and debugging information as a means for reification.
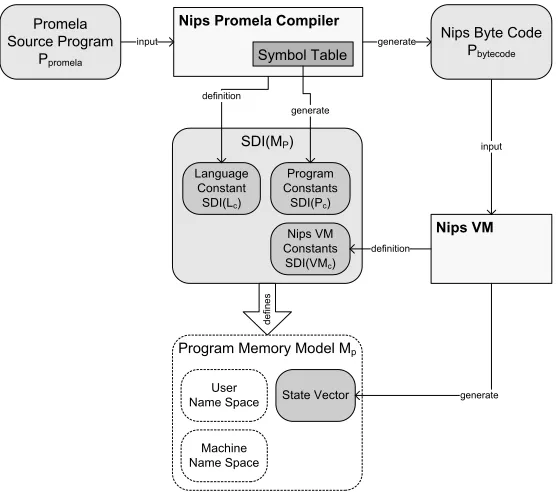
The principal contributions of this thesis for reaching the objectives defined in Section 1.3 are presented in Chapters 3, 4 and 5. This thesis introduces a simple multi-use readable format for Static Debugging Information (SDI) in Chapter 3 and the SDI Framework for state manipulation, which is based on the SDI language, in Chapter 4. SDI is a high level modeling notation for debugging information that is meant to describe the source-level elements of modeling languages used with explicit state model checkers. The SDI Framework facilitates a reflective debugging API that consists of function calls that enable debuggers to display and modify the information in state vectors associated with running programs for which memory models have been defined using SDI.
The generic results of the research are applied to the Nips VM in particular. The Nips VM
Tool Set is extended with a source-level command-line debugger that allows users to simulate
the behaviour of Nips byte code in Chapter 5. The design of the debugger based on the SDI
framework is treated as a case study, an in-depth examination of the application in order to gain understanding about the investigated approach.
1
The thesis is concluded in Chapter 6 with considerations about the results of the research, motivations and the design and implementation of the SDI Framework and its application to the
NipsVM.
Additionally, theNipsAPI is documented and it is described how to embed it as a tool
back-end in model checker host applications in Appback-endix A. This appback-endix also describes design
suggestions for enhanced components for future versions of theNipsVM. Appendix B describes
the extensions to theNips PromelaCompiler. Appendix C details an example used throughout
this thesis to illustrate our approach. In Appendix D a user manual for theNips Debugger is
Chapter 2
Related Work
This chapter discusses work related to our approach. The Nips Virtual Machine (Nips VM)
is more thoroughly introduced than thus far in Section 2.1. After this introduction we discuss
debugging information formats as candidates for use with the Nips VM in Section 2.2. Next,
explicit state model checkers related to the Nips VM are discussed in Section 2.3, particularly
the debugging solutions employed in the tools. How are counter-examples related to the source and how are they presented to the tool user? The debugging solutions offered by the discussed formats and tool designs and languages are compared in Section 2.4 to finally decide about the
approach for the debugger forNipsin Section 2.5.
2.1
The Nips VM
The Nips VM is described in [50, 51] as a Virtual Machine for state space generation that is
designed as a modular, efficient, reusable, embeddable explicit state model checker tool engine
(or back-end). It can execute Nips byte code instructions that are translations for high level
modeling languages. Executing aNipsbyte code program yields a state space that can be used
with model checkers simulators and testing tools. TheNipsacronym is the reverse of Spinand
has (at least two) different meanings: New Implementation of PromelaSemantics andNever
Implement PromelaSemantics (again).
2.1.1
Motivation
The design of theNipsVM andNipsbyte code for implementing an operational model of
high-level languages for use in verification tools is motivated by four main arguments [50]. Firstly,
it is highly desirable to reuse an already existing modeling language like Promela and reuse
existing case studies instead of having to resort to artificial examples. Secondly, the tool de-veloper can focus on the design and implementation of algorithms when using a reusable (or re-implementable) component for state space generation that can easily be interfaced with the tool infrastructure. Thirdly, tool users can switch to other tools with the same input language
without having to reimplement the model in another formalism. Lastly, using theNipsVM as
reduction and statement merging irrespective of the high level modeling language being used.
2.1.2
Language
TheNipsVM runsNipsbyte code, an intermediate language, that serves as a means to describe
the operational semantics of modeling languages. Nipsbyte code works on three types of
run-time components: the global component, processes and channels which can be used with all
compilers targeting theNipsVM.
Nips byte code supports non-determinism, concurrency1 of run-time created processes,
ren-dezvous and asynchronous communication between processes via channels, sending achannel as
a variable message via another channel,priority control of byte code execution andspeculative
execution. Speculative execution entails that the changes to states caused by byte code of which
the execution cannot complete are undone (rolled-back). The byte code can be used to encode
LTL properties in the model itself into a monitor process. LTL properties are described in
Promelaas neverclaims. A full description of theNipsbyte code can be found in [50].
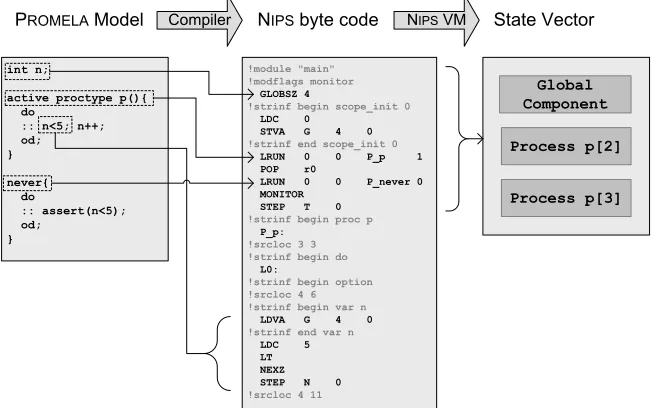
TheNipsbyte code contains incomplete debugging information for Promelaprograms in the
form of debugging information strings. These strings are limited in their expressiveness and their
meaning depends on the relative placement in the code. Source location markers consist ofline
and column. Name markers consist of a begin or end tag, followed by a keyword and possibly
aname. They do not provide a means for a debugging API and they seem to be designed only
withPromelain mind.
int n;
!strinf begin scope_init 0 LDC 0
STVA G 4 0 !strinf end scope_init 0 LRUN 0 0 P_p 1 POP r0
LRUN 0 0 P_never 0 MONITOR
STEP T 0 !strinf begin proc p P_p: !strinf begin var n LDVA G 4 0 !strinf end var n LDC 5 LT NEXZ STEP N 0 !srcloc 4 11
PROMELAModel Compiler NIPS byte code NIPS VM State Vector
Global Component
Process p[2]
Process p[3]
Figure 2.1: NipsByte Code Example
Figure 2.1 shows an example byte code snippet compiled from thePromelasource program on
the left. Its source statements can be deduced from the byte code, but the location of variable
1
CHAPTER 2. RELATED WORK 2.1. THENIPSVM
n in the memory is not saved with its source name. Therefore, ”variablen” is unknown in the
resulting state vector on the right.
TheStatic Code Optimization forNips byte code described in [2], that works for all compilers
targeting theNipsVM, can in some cases improve the performance substantially. In such cases
the amount of byte code and the state space can be statically reduced.
2.1.3
Design
The Nips VM was designed using pragmatic design solutions. First, a formal semantics was
written that completely describes the model behavior for each of thePromelalanguage features
[42]. This formal description was then used to derive theNipsbyte code instructions that are as
generic as possible, in order to be able to reuse them for describing the operational semantics of
different languages [41]. TheNips VM was designed to create a model that is simple, efficient
and embeddable as a component into host applications [43]. Conceptually the design of Nips
VM based tools is split in the Nips VM back-end for state successor calculation, a scheduler
algorithm that determines the next state to evaluate and acompiler that targets theNipsVM.
The VM makes use of a stack-based architecture for expression evaluation. It has registers for the translation of counting loops. The RISC-like instruction set is motivated by the need for fast decoding inside the instruction dispatcher, the VM’s most executed routine. As a design
principle the Nips VM executable remains the same for each model and is not recompiled for
specific models as happens withSpin.
States. NipsVM states are memory BLOBS, untyped sequences of bytes called state vectors.
States contains all the information the VM needs to continue its execution. During the execution
of a process step, the process contains execution stacks and registers but these are removed
before the state vector is returned. The Nipsstate vector starts with a global component that
contains global variables, followed by processes that contain local variables and channels that
may contain messages up to their predefined capacity. All compilers for the Nips VM that
support components or objects that do not fit global variables, processes or channels precisely must encode these objects as global or local variables. The order in which the components are
placed in the state vector is referred to as thestate format. Figure 2.2 shows theNipsVM state
format.
variable describes
gvar size size of the global variables in bytes process count number of processes in the state vector exclusive pid pid of the exclusively executing process monitor pid pid of the process used for monitoring channel count number of channels in the state vector
(a) Global Component Descriptor
variable describes pid process identifier
flags process execution mode
lvar size size of the process’ local variables pc program counter
(b) Process Descriptor
variable describes
cid creating process identifier and channel identifier max length maximum number of messages in the channel cur length current number of messages in the channel
msg length message length
type length type preamble length (c) Channel Descriptor
Figure 2.3: NipsVM State Component Descriptors
Each component starts with acomponent descriptor that describes component state information
relevant to the execution of the VM. The information in the descriptors is relevant to the place-ment of the component in the state vector and the retrieval of the component from the state
vector. TheNipscomponent descriptors are depicted in Figure 2.3. Processes are ordered inside
the state vector by increasing value of thepid and channels are ordered inside the state vector
by increasing value of thecid. Even though processes are not explicitly typed, depending on the
type of the process thepcstays within the range of the section of the byte code.
Channel identifiers contain the creating process identifier as means for a simple symmetry reduc-tion. The order in which channels are created by different processes does not lead to different
CHAPTER 2. RELATED WORK 2.1. THENIPSVM
For each instruction, the component subject to the instruction must be retrieved from the state vector. This is done by an algorithm reminiscent of a scanner. It uses a component descriptor look-ahead to identify the next component in the state vector. The type of the component and thus the type of the descriptor is determined by the state format. Algorithm 1 describes the
retrieval of NipsVM state components from the state vector.
Algorithm 1 (Nips Component Retrieval). retrieve(sv,comp,id) is a function to retrieve
component comp with component identifier id from state vectorsv that starts at Global
where
• Argument sv is a state vector, argument comp is a Nips component where comp ∈
{global,process,channel} and argument id is the process identifier if comp=process,
the channel identifier whencomp=channel or not defined ifcomp=global.
• Local variable process count is the number of processes in the sv, Local variable
channel count is the number of channels in the sv, Local variablecurp is the current
number of visited processes and Local variable curc is the current number of visited
channels.
• And let functions size(global g) = size(global descriptor) + g.descriptor.gvar size,
size(process p) =size(process descriptor) +p.descriptor.lvar sizeandsize(channelc) =
size(channel descriptor) + c.descriptor.type length + c.descriptor.cur length ∗
c.descriptor.msg length be help functions.
1. Global: The global componentgis at offset zero.
(a) If the object of the search is the global component, i.e. comp=global returng.
(b) Otherwise read the global component descriptor. Save the number of processes and
channels inprocess count andchannel count. Set the number of visited processes
and channels to zero: curp= 0 andcurc= 0. Goto process at offsetsize(g).
2. Process(into): Processpis a component at offseto. Increment the number of visited
processes: curp++. Read the process component descriptor.
(a) If the process was found thencomp=processandid =p.descriptor.id then return
processp.
(b) Else if there are more processes i.e. curp<process count then goto Processat
offsetsize(p) +o.
(c) Else if there are more channels i.e. curc<channel count then gotoChannelat
offsetsize(p) +o.
(d) Else terminate, component not found.
3. Channel(into): Channelcis a component at offseto. Increment the number of visited
processes: curc++. Read the channel component descriptor.
(a) If the channel was found then comp =channel and id = c.descriptor.id return
channelc.
(b) Else if there are more channels i.e. curc<channel count then gotoChannelat
offsetsize(c) +o.
2.1.4
Applications
Promela Semantics. The NipsVM is particularly well-suited forPromela models because
Nipsbyte code has been developed to express the formal semantics of Promela models[42,
41, 43]. The efforts are implemented in theNips PromelaCompiler. Together with theNips
VM and a scheduler component, it provides functionality comparable to that of theSpinModel
Checker that fast enough for practical use, although a debugger is missing2. The goal is to reuse
Promelain order to be able to reuse case studies and be interchangeable with tools that use Promela.
Schedulers. TheNipsVM distribution contains built-in DFS and BFS schedulers. The
algo-rithm for nested DFS described in [44] has been implemented in Java to gain insight into the algorithm.
Adaptive Model Checker. TheNipsVM has been used as a state-space generation component
in an adaptive external-memory model checking tool [17]. The tools scheduler uses not only the main memory but also the hard drive to store the state space, making it possible to model check
Promelamodels with larger state spaces.
Nips and DiVinE.TheNipsVM has been used withDiVinE[3] indistributed algorithms for
verification, in which multiple scheduler algorithms run on different PCs. By letting each sched-uler perform a BFS the state space is partitioned and stored distributively. Like the
external-memory model checker it makes it possible to use more external-memory for model checkingPromela
models.
Model Checking Embedded System Software. The Nips VM has been used to model
check correctness of assembly code for ATMEL ATmega family of micro-controllers [40].
Tapir. Tapiris a programming language designed forsystems programming. It is a minimalistic
object oriented language which has no automatic memory management, no exception handling, no inheritance and no type-casts. Its domain, systems programming, includes networking proto-cols, operating systems, middlewares, DSM systems, etc. The services provided by such systems
are critical for the stability of the programs that rely on them. Therefore the semantics ofTapir
is modeled using Nips byte code. A model checker has been implemented that uses the Nips
VM which provides a means to check the correctness of the system [46].
2.2
Debugging Information Formats
Over the years many debugging information formats for programming languages have been used
such asstabs [28] ,COFF, IEEE-965 [47] (a withdrawn standard) andDwarf[15]. Debugging
information format standards are either combined with object file formats (COFF, IEEE-695)
or separately described (stabs, Dwarf) to be used in combination with an object file format.
An important example of such a format is the Executable and Linking Format (ELF) which is a standard Unix object file format. ELF largely replaced the Common Object File Format
(COFF). The Java programming language uses its own format, called the Javaclassfile format,
to store both byte code and debugging information. Java virtual machines require part of the debugging information to run Java programs whereas the rest only serves for debugging. In this
section we discuss the stabs,Dwarfand the JavaclassFile debugging information formats as
2
CHAPTER 2. RELATED WORK 2.2. DEBUGGING INFORMATION FORMATS
candidates for use with the NipsVM.
2.2.1
Stabs
Thestabs (symbol table strings) debugging information format was originally used with Unix’s
a.out(assembler output) object format for executables, but has been extended over the years for use with Cobol, C, C++, Pascal and other languages. Problematic with the stabs format is its standardization, with some exceptions [28, 29] stabs have not been properly documented. Compilers that support stabs, such as the GNU Compiler Collection (GCC), can generate the
debugging information encapsulated in so calledassembler directives known as stabs, formatted
information strings, which are interspersed with the generated code. The assembler adds the
information from stabs to the symbol information it places in the symbol table and the string
table of the object file it builds. The linker combines the object files into an executable such that
it contains one symbol table and one string table. The resulting linked object or executable can be parsed by a debugger on the same platform, as a source of debugging information about the running program.
Language. A documented version of stabs used with the GNU Debugger [28], describes the
lan-guage that consists of three differently formatted stab assembler directives calledstring(.stabs),
number (.stabn) anddot (.stabd).
.stabs "string", type, other, desc, value .stabn type, other, desc, value
.stabd type, other, desc
The type field is a number which uniquely determines the stabs type. The stabs type defines
the exact interpretation of, and possible values for, any remaining string, desc, or value fields
present in the stab. The overall format of the string field for most stab types is: "name:symbol-descriptor type-information"
The field describes the names of symbols and their type. Stabs symbols include the: (stack)
variable, constant, nested name, (nested) function or procedure, reference or register parameter, module, an enumeration or an array. Stabs type supports includes: built-in (base-), method-, pointer-, reference-, array-, function-, structure-, set- and union- types. Stabs may also describe unnamed entities.
2.2.2
Dwarf
The Dwarf3 debugging information language acronym is said to mean Debugging With
At-tributed Record Formats [10]. There are three documented versions, the first of which was first
used with the sdb debugger in Unix System V Release 3 (SVR3) developed by Bell Labs in the
mid 1980’s. It was first documented by the Programming Languages Special Interest Group
(PLSIG), part of Unix International (UI), in 1989 as theDwarf1 standard [32] and is still used
for debugging small embedded systems processors. Dwarf2 was introduced as a draft standard
[33] in 1990 but a final version was never released. It addressed issues related to the amount of
generated data and introduced support for C++. Dwarfwas revived in 1999 in order to provide
better debugging support for the HP/Intel IA-64 Architecture as well as better documentation
of the Application Binary Interface (ABI) used by C++ programs4. The Dwarf 3 standard
3
The nameDwarfis a funny reference to ELF. 4
was released in January 2006 [15, 1]. It is backwards compatible withDwarf 2 and therefore
resembles it closely. It adds support for Java, C name spaces, C99 base types, cross module entry reference, discontinuous scopes, stack structures and stack unwinding.
Language. Dwarf3 is designed to be extensible to support procedural programming languages
on any machine architecture. Dwarf uses a series of debugging information entries to define a
low-level representation of a source program. It is commonly used with ELF but it can be used with other object file formats as well. It does not duplicate information located in the object file.
Dwarf is block structured, like many programming languages. The Dwarf description of a
program is a tree structure which resembles an AST.Dwarftree nodes representtypes,variables
orfunctions. The basic descriptive entity inDwarfis the Debugging Information Entry (DIE).
Each entity, except the top-most entity, is contained in a parent entity and may containchild
entities. Entities may contain multiple entities called siblings. Each DIE has a tag, which
specifies what the DIE describes and a list of attributes which fill in details and further describes the entity.
There are a vast amount ofDwarfentries, e.g. used for describing: functions, procedures, lexical
blocks, labels, statements, error handling, sets, built-in (base-) types, pointer-types, array-types, structure-types, union-types, class-types, interface-types, and member-function types.
Further-more,Dwarfcontainsinstructions to describe call frame information and to provide a mapping
between target code and the program source.
2.2.3
GDB
Arguably the most popular debugger for UNIX systems is GDB, the GNU debugger. It is a source-level debugger that can be run on most UNIX variants and Microsoft Windows that allows debugging of programs written in C, C++, Objective-C, Pascal, Java, Fortran and Modula-2, etc. GDB can display variable values and can be used to determine where in the execution
errors occurred. It can be used to setbreak-points, which entails selecting a source line where
the execution op the program should halt and it can be used tostep through the code line by
line or instruction by instruction. GDB can read various debugging information formats that are output by the GNU Compiler Collection (GCC), including stabs and a modified undocumented
modified version of Dwarf 2. It is however difficult to extend GDB with support for new
languages, because the requirements are not clearly described and it requires an extensive amount of programming [39].
2.2.4
Java
class
File Format
The Java virtual machineclassfile format describes the Java byte code structure. Eachclass
file consists of a tree structure. Its nodes are described as tables that consist of zero or more
variable-sized items. The Java class format is extensible because all tree nodes may have any
number ofattributes, general information items, associated with them. Compilers are permitted
to define and emit classfiles containing new attributes in the attributes tables of class file
structures. Java virtual machine implementations are permitted to recognize and use new at-tributes, e.g. to support vendor-specific debugging, provided that these attributes do not affect
CHAPTER 2. RELATED WORK 2.2. DEBUGGING INFORMATION FORMATS
allowing byte code with additional attributes to run on different implementations of the Java VM also [25].
The root ofclasstree, which is represented by theClassFilestructure, contains theConstants,
Fields,Methods and Attributestables. The class format tree structure is schematically de-picted in Figure 2.4. We discuss the tree nodes one-by-one.
... ... ...
optional
...
ClassFile
Attributes
Constants Fields Methods
LocalVariableTable LineNumberTable
Code
optional optional Exceptions
SourceFile optional
Method InnerClasses
ConstantValue
Field
Deprecated Synthetic
Constant
Figure 2.4: JavaclassFormat
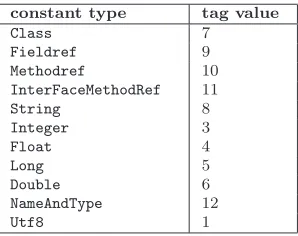
Constants. TheConstantPoolis a table of entries that among other things, represents a flat
representation of the compiler symbol table. Constants in theConstantPoolare referred to by
other tree nodes by array index number. The format of each entry is indicated by thetag, the
first byte in the constant entry. Table 2.1 depicts the possible constant types and their tag value. A full description of constant types is given in [25].
constant type tag value
Class 7
Fieldref 9
Methodref 10
InterFaceMethodRef 11
String 8
Integer 3
Float 4
Long 5
Double 6
NameAndType 12
Utf8 1
Table 2.1: classformat constants
Fields. TheFields node is a table of entries that represent the fields declared for thisclass
orinterface. Afield entry contains thename,type andflags that indicate if the field ispublic,
privateorstatic. For fields that are declared as constants theConstantValueattribute is used to
store the constant value. TheDeprecatedattribute is used to indicate that a field is deprecated.
Methods. TheMethodInfonode describes the methods declared by this class or interface type,
including instance methods, class (static) methods, instance initialization methods, and any
class or interface initialization method, but no inherited methods from superclasses or
superin-terfaces. A method entry contains the name of the method, the type of its parameters and of
its return value,flags that indicate if the method ispublic, private or static. The Exceptions
attribute contains the names of the exceptions that can be thrown by the method. The method
fieldCodeattribute contains the code of the non abstract methods.
The LocalVariableTable attribute and the LineNumberTable are optional attributes of the
Code attribute. The LocalVariableTable attribute may be used by debuggers to determine
the value of a given local variable during the execution of a method. The LineNumberTable
attribute may be used by debuggers to determine which part of the Java virtual machine code array corresponds to a given line number in the original source file.
Attributes. The Attributes node is a table of class attributes. The optional SourceFile
attribute refers to the name of the source file. The InnerClasses attribute describes nested
classes and interfaces. This concludes the description of the Javaclassfile format.
Java VM.TheCode,ConstantValue, andExceptionsattributes must be recognized and
cor-rectly read by a class file reader for correct interpretation of the class file by a Java virtual
machine implementation. Furthermore, the InnerClassesand Syntheticattributes must be
read correctly in order to support the Java and Java 2 platform class libraries. These libraries
in-clude support for reflection, loading and creation of classes and interfaces (e.g. theClassLoader),
linking and initialization of a class or interface, security and multi-threading. Additionally, the
LineNumberTable,LocalVariableTableandSourceFileattributes of a class file and its meth-ods are needed to support source-level debugging.
2.3
Model Checkers
In this section, explicit state model checkers that bear resemblance to theNipsVM are discussed
with respect to the motivation, the technologies and the modeling languages. The focus is on the debugging solutions in particular, since counter-examples produced by the tools must be
returned to the user at a source level and this has yet to be achieved with theNipsVM.
2.3.1
Spin
Spinis an explicit state model checker that can be used for the formal verification of distributed
software systems. TheSpinacronym, introduced with the first version of the tool, means Simple
PromelaInterpreter. NowadaysSpinis neither simple nor merely an interpreter, it is a mature
model checker that has been successfully applied in many software development projects. Spin
is thoroughly described in [20].
Motivation. The motivation for Spin is to verify the correctness of the design models of
concurrent and distributed systems which are difficult to debug and test with traditional means.
Language. Promela means Process Meta-Language. It is a high level modeling language
intended to find good abstractions of system designs (i.e. models) of concurrent software systems. Its commands are guarded which means statements are blocking (will not execute) until they
CHAPTER 2. RELATED WORK 2.3. MODEL CHECKERS
channels for communication between processes with message passing, synchronizing statements,
non-deterministic control structures, conditional branching statements, loops, atomic sequences, deterministic steps, structured data, etc. The full language features and their syntax are too numerous to explain here, they are described in detail in [20].
Tool. Spincan perform a depth first search (DFS) or a breadth first search (BFS) to validate LTL
properties, which are translated to never claimsin thePromelamodel. To check invariants,
assertions can be placed in the model at strategic locations in the model. During a DFS Spin
uses a stack to keep track of visited states. Once a counter-example has been found the stack is simply printed. It is returned to the user as execution trace that consists of a sequence of
states and transitions, which are described using source level variables and values andPromela
source statements. Spin keeps track of the source statements and variable types with internal
look-up tables. It does not have to resort to the use of separately defined debugging information
to explain counter-examples. However, the symbol table information that is collected by Spin
while parsing aPromelamodel can be emitted to a file in a machine readable format.
Debugging Information Format. TheSpin debugging information format uses one line to
describe each symbol table object. Similar to stabs, each line is a string that consists of
infor-mationfields. All objects are described by type and name.
type name ...
Depending on the type of the object additional information is specified.
For a variable of typebit, byte, short, int, mtype andproctype the additional information fields
are the initial value, thescope and itsrole.
type name initial value scope role
The scope of variable is global, part of a struct field or local to a process. A variable either plays the role of a variable or that of an argument. The values that the type, scope and role field can
range over are depicted in Table 2.2. If the variable is declared as anarray the name field also
contains the array length: name[length]where the length is a positive integer. If the variable
is a structure field then its name is composed of the type name and the field name separated by
a dot: type namefield name.
type scope role
bit <:global:> <variable>
byte <:struct-field:> <argument>
int <process name>
mtype proctype struct channel ...
Table 2.2: PromelaDebugging Information Field Values
For structure variables, where the type isstruct, the third field defines the name of its structure
type declaration.
struct name type name scope role
Structures can be structure-fields themselves in which case its name is composed of the type
name and the field name separated by a dot: type namefield nameanalogous to variables that
For achannel, the additional information fields are the size, the scope, the role, the number of message parts and the message part types. The size is an integer value greater than or equal to zero, the number of of message parts is an integer value greater than zero, and the message type parts are not struct types but single-value types.
channel name size scope role msg parts type 1. . .type n
Optimization Strategies. Many optimizations have been made to Spin to reduce the state
space, such asstate collapsing,state compressions [19] and the minimized automaton [21]. The
state space explosion is curbed by means of Partial Order Reduction [20, 6]. Spin also supports
approximate model checking wherebit state hashing orhash compaction are used store the state
space.
2.3.2
JPF
Java Path Finder (JPF) is a second generation explicit state model checker tool environment for the verification, analysis and testing of Java programs, or Java models as they are referred to in
this context. The original version of JPF translated Java programs toPromela. This approach
was abandoned because of the difficulties of mapping the language features of Java toPromela.
The current version uses a virtual machine based approach and runs Java byte code.
Motivation. The design of JPF is motivated by practical language and tool design arguments
[48]. Programs often contain fatal errors, such as critical section and deadlock errors, despite the existence of careful designs. Therefore there should also be focus on model checking real programs written in modern programming languages. Because modern programming languages are well designed, they may be good design modeling languages as well. Using programming languages as modeling languages may increase the access to real examples and case studies. It may also enlarge the number of potential users of the tool.
Tool. JPF is designed as an extensible tool environment for model checking and debugging,
which is as modular and easily understandable to developers as possible at the cost of model checking speed. The tool, which his implemented in Java, simulates non-determinism by using
backtracking, such that JPF can restore previous execution states, which are heap and
thread-stack snapshots, in order to explore different previously unexplored execution paths. The JPF VM runs on a Java VM. It intercepts method invocations and delegates property-irrelevant executions to dedicated classes running the host VM. JPF can only exhaustively explore the state space for small programs, which should be no greater than approximately 10000 lines and
may not contain platform specific native code, because the JPF VM cannot execute it. Aside
from model checking, JPF offers debugging functionality in the form ofrun-time analyses such
as datarace condition detection andlock order analysis, that can be used to pinpoint potentially
problematic code fragments, deadlocks and unhandled exceptions.
Explaining Counter-Examples. To understand how JPF counter-examples can be related
to the Java source it is necessary to explain what JPF states are. States are represented in a
complex Java data structure which consists of three components: 1)information for each thread
in the Java program,2) the static variables (in classes)3)and the objects in the system. The
CHAPTER 2. RELATED WORK 2.3. MODEL CHECKERS
The state space size is reduced by using a generalizedcollapse compression where state
compo-nents are stored in separately indexed spaces (hash-tables) and states are represented by indexes referring to component hash-table positions. The states are compressed losslessly and stored in a single integer, making it very fast to compare states.
Explaining a counter-example in JPF entails uncollapsing the integer state vectors and using reflection, a Java language feature, to view run-time models and relate the states to source level information. The java byte code contains debugging information which is used to support reflection at run-time, as is explained in Section 2.2.4. JPF is integrated with BANDERA for its error-displaying capabilities which allow users to step through the code line by line, forwards and backwards, while observing the objects in the memory.
Optimization Strategies. To improve its scalability and allow use with larger programs JPF
supportsdirected model checking using a heuristics search. The set of follow-on states is filtered
according to a property related relevance directs the JPF VM, which is either supplied by the
user or gained from arun-time analysis. With this inexhaustive model checking the tool does not
provide a proof of correctness with respect to a system property, but rather serves as adebugging
tool (that may also yield false positives).
JPF usessymmetry reductions forclass loading and the heap, where the ordering of the classes
being loaded and the order in which dynamic objects are created in the heap are canonicalized, such that different orderings are recognized as equivalent. A mark-and-sweep garbage collection algorithm prevents states from growing indefinitely and facilitates heap symmetry reduction.
The static analyses: slicing and partial evaluation are used to generate smaller functionally
equivalent programs that result in a smaller state space. A different static analysis calledpartial
order computation does not change the program size but reduces the state space by eliminating
unnecessary interleavings of the program behaviour.
2.3.3
Bogor
Bogor is a modular model checker framework with an extensible input language for defining
domain specific constructs. Its modular interface is designed to ease the optimization of domain-specific state-space encodings, reductions and search algorithms [38, 8, 37, 18].
MotivationBogor was developed as an answer to difficulties with the application of existing
model checker frameworks to particular domains [38]. The authors observed that it is problematic to apply existing model checker frameworks to domain specific model checker problems because it
is difficult to: 1)efficiently map domain constructs to model checker input languages;2)change
the encoding of system data to achieve state space reductions; 3)configure the search mode of
the model checker based on the reasoning with the particular model checking problem;4)alter
or combine state space reduction strategies with collections of reduction strategies in order to target related model checking problems.
Language. The input language of Bogor is an extended version of the Bandera
Intermedi-ate Representation (BIR). BIR features language constructs for types, expressions and actions.
Unlike most model checker languages, BIR features include dynamic thread creation, object cre-ation, exception handling, virtual functions and recursive functions. BIR can express all features
of the Java Programming Language. Bogor can be extended with new semantics primitives.
name of the Java package that implements the semantics of the extension. Extensions do not alter the BIR grammar, but add names to the set of built-in expressions, actions, etc [38].
Tool. Bogor is designed to make it easy toextend the model checker withnew semantic
primi-tives and optimize thestate-space-storage andexploration strategies in order to tailor it towards
different applicationdomains. Bogor is developed as a plug-in for the Eclipse platform. The type
of properties supported by the tool are invariants and LTL properties. The state space can be explored with a DFS, BFS or directed search. The tool offers and editor with syntax highlight-ing, a well-formedness checker, a user simulation mode and counter-example display. Just like
Spin, Bogor keeps track of the source statements, line numbers and variable types in an internal
symbol table. It does not have to resort to the use of separately defined debugging information in order to depict counter-examples. In line with Bogor’s modular design, the symbol table may be extended to support new actions and expressions.
Uses. Bogor is used for education in a graduate-level model checking course at (among
oth-ers) Kansas State University [9]. Because its design aspects are functionally separated and it is programmed in Java, students and professional developers alike can easily add functionality to Bogor.
Bogor has been used to model check Java programs [9]. The prototype Bytecode-to-BIR Transla-tor (BB) translates Java source to BIR. The BB translaTransla-tor makes use of the ASM Framework [14], a Java class manipulation tool designed to dynamically generate and manipulate Java classes, which are useful techniques to implement adaptable systems. ASM is not an acronym but refers to C assembly code functions. The debugging information is saved inside the Java byte code as discussed in Section 2.2.4.
2.4
Evaluation
In Section 1.1.2 we stated that debugging information is the extra, optional information generated by the compiler which is usually not necessary for programs to run, but which is necessary for debuggers to make source-level debugging possible.
In this section we evaluate the debugging approaches used with Spin, Bogor and JPF in
Sec-tion 2.4.1. In the design of each of the tools, except the Nips VM, the problem of relating
counter-examples back to the source has been solved. To what extent do approaches used with
the explicit state model checkers related to theNipsVM, discussed in Section 2.3, make
source-level debugging possible for the Nips VM? Furthermore, we evaluate the debugging formats,
discussed in Section 2.2, in Section 2.4.2 in order to reach a conclusion about an debugging
approach forNips.
2.4.1
Model Checkers
Modularity & Extensibility. What Bogor, JPF and Nipshave in common is that they all
aim to be easily extensible with new algorithms and standardize model checking solutions by offering an extensible explicit state model checking tool set. This is done by modular design,
separating the tools into easily replaceable components. JPF and the Nips VM both employ
CHAPTER 2. RELATED WORK 2.4. EVALUATION
Source Language. In contrast toSpin, Bogor and JPF which use high level modeling languages
which contain variable and type information, theNipsVM uses the low levelNipsbyte code as
its input language which may be derived from aPromelamodel but which contains almost no
source-level elements. The debugging information strings theNips byte code contains will not
be extended because they are tangled with the byte code and they do not support a debugging
API.Spinparses high levelPromelamodels itself and keeps track of the source statements and
types using internal look-up tables. It has no need for separately defined debugging information to show counter-examples to the user.
AlthoughNipsbyte code and BIR are both intermediate representations, in the design of Bogor
there is no need for separate debugging information. LikePromela, BIR contains the source
level elements that Nipsbyte code lacks. The debugging approaches used withSpinand Bogor
cannot be used because the source level elements are not described separately from their respec-tive modeling languages. Consequently, if we wish to either of the approaches, the modeling language associated with it must be reused as well.
The design of JPF is similar to that of the Nips VM in that both are virtual machines that
run byte code and both can be used to model check programming languages. JPF uses Java as its modeling language, is written in Java itself and runs on a Java virtual machine. The JPF approach to show counter-examples to the user is to use the debugging information stored in the
classfiles generated by a Java Compiler from a Java model.
A comparison of the discussed modeling languages is shown in Table 2.3. Each of the tools use different languages, some of which are source level modeling languages and some are intermediate representations of models. What the tools have in common is that debugging information is never separately described at a high level.
tool modeling language low level language debugging information
Spin Promela none Promela
JPF Java classfile format classfile format
Bogor BIR none BIR
Java + BB compilers Java BIR classfile format
NipsVM based tools Promela,Tapir, etc. Nipsbyte code to be decided
Table 2.3: Modeling Languages
Debugger Design. Bogor makes use of the Eclipse platform to show counter-examples to the
user. The Nips VM would benefit from a user interface that can embed the Nips VM as an
Eclipse plug-in. JPF makes use of the reflection language feature of Java. TheNipsVM would
benefit from a reflective layer that can be used for meta-programming and supports introspection and intercession not only for immediate debugging purposes, but also for dynamic partial order reduction in the long run.
2.4.2
Debugging Information
Is there a debugging information format, discussed in Section 2.2, that is suitable to be used
with the NipsVM in order to provide general, reusable debugging support? If not, then what
can be learned from the approaches and formats?
but also different modeling languages, the debugging information should be tailored to support common modeling structures and data types. More generally, it should focus on the abstract meta-modeling of the memory encoded by state vectors that are produced by explicit state model checkers and the source level elements of the used modeling languages. This includes mainly the
types of static structures of Nips run-time components and source information. We prefer a
high level debugging information language over a low level description because the goal of the language is to be used for modeling the memory of running programs. Therefore the design of the language should be separate from the low level implementation or object file format. The debugging information language must be clearly defined and not a vague standard of which the specification is adjusted for various projects without documentation. It should not be the case that implementing a debugging information format costs an excessive amount of effort in terms of programming. The different debugging information formats are discussed with respect to these requirements.
Stabs. The stabs format consists of formatted Strings of type information. Though stabs is
extensible to support modeling languages a problem with stabs is that it is not standardized and
can be complex and occasionally cryptic [10]. Therefore stabs will not be used withNips.
Spin. Like stabs theSpindebugging information consists of formatted Strings of type
informa-tion, but it is not extensible. It can only define symbol table information that can be extracted fromPromelamodels. Although it is simple and could easily be documented in Section 2.3.1
by reverse engineering the format, the Spin debugging information is not sufficiently general
to describe run-time memory models of programs in languages other than Promelaand will
therefore not be used.
Dwarf. In contrast to stabs andSpindebugging information,Dwarfdebugging information is
block structured, such that each entry (except the top level entry) is contained within another
entry and trees of information are easily represented at run-time. The Dwarf documentation
[15] describes in detail how to support different facets of debugging such as describing data
types, but also memory location expressions and source location mappings. We favor Dwarf
over stabs as because of its uniform standard, its block structure, its clear specification and its
expressiveness. However providing complete support for Dwarf for the Nips VM is difficult
and unnecessary, because Dwarf is tailored towards procedural programming languages and
not towards modeling languages, such asPromela, that are used with theNipsVM.
GDBAn implementation of a debugger forNipsin GDB is deemed impractical because of the
features it supports and the large amount of programming required to add a new language to it
[39]. We do not wish to restrictNipstoPromelaand we do not wish to have to extend GDB’s
feature set with non-deterministic languages.
Javaclassfile format. The Javaclassfile format is used by JPF and by the Bogor Bytecode-to-BIR compiler as an intermediate representation of models and to store debugging information. The format is well documented and extensible via the using new attributes [25]. However its description is strongly tied to the implementation of Java virtual machines and the Java pro-gramming language and therefore its design is not high level or easily reusable. The format is