DOI:10.1051/epjconf/20159402023 c
Owned by the authors, published by EDP Sciences, 2015
Microstructure and local mechanical property evolution during
high strain-rate deformation of tantalum
Shraddha J. Vachhani1,a, Nathan Mara1,2, Veronica Livescu1, and Ellen Cerreta1
1Materials Science and Technology, Los Alamos National Laboratory, Los Alamos, NM 87544, USA 2Center for Integrated Nanotechnologies, Los Alamos National Laboratory, Los Alamos, NM 87544, USA
Abstract. Shear localization is often a failure mechanism in materials subjected to high strain rate deformation. It is generally accepted that the microstructure evolution during deformation and the resulting heterogeneities strongly influence the development of these shear bands. Information regarding the development of local mechanical heterogeneities during deformation is difficult to characterize and as such, constitute is a critical missing piece in current crystal plasticity models. With the recent advances in spherical nanoindentation data analysis, there is now an unprecedented opportunity to obtain insights into the change in local mechanical properties during deformation in materials at sub-micron length scales. In this work, we quantify the evolution of microstructure and local mechanical properties in tantalum under dynamic loading conditions (split Hopkinson pressure bar), to capture the structure- property correlations at the sub-micron length scale. Relevant information is obtained by combining local mechanical property information captured using spherical nanoindentation with complimentary structure information at the indentation site measured using EBSD. The aim is to gain insight into the role of these microstructural features during macroscopic deformation, particularly their influence on the development of mechanical heterogeneities that lead to failure.
1. Introduction
Shear localization is often a failure mechanism in materials subjected to high strain rate deformation. It is generally accepted that the microstructure evolution during deformation and the resulting heterogeneities strongly influence the development of these shear bands. However, current crystal plasticity models [1–3] fail to effectively capture the heterogeneous plastic deformation. One critical missing piece in these models is the information on the development of local structural heterogeneities during deformation. Consideration of local microstructure evolution through electron back scattered diffraction (EBSD) measurements [4,5] constitutes only one aspect of the characterization of a deformed material. Another equally important attribute, which is somewhat difficult to capture, is change in local mechanical properties at the sub-micron length scale that this microstructural evolution causes.
With the recent advances in spherical nanoindentation data analysis [6,7], there is now an unprecedented opportunity to obtain insights into the change in local mechanical properties during deformation in materials at sub-micron length scales. Recent advances in in-strumentation (e.g., the availability of the continuous stiffness measurement (CSM)) [8,9] have now made it possible to convert the measured load-displacement data from spherical nanoindentation into highly reproducible and consistent indentation stress-strain (ISS) curves [6]. This ISS data allows one to follow the local elastic, yield and post elastic behavior of materials during the
aCorresponding author:Shraddha@lanl.gov
indentation process. With this new characterization tool at our disposal, we are now in a position to gain insights into the grain-scale evolution of microstructure during the deformation of polycrystalline metals. In recent work, the use of ISS curves for nanoindentation data analysis has demonstrated tremendous promise in providing new insights into material behavior, including the role of crystal orientation [10] and grain boundaries during macroscale deformation in metals [11], buckling behavior of carbon nanotube forests [12], and lamellar level properties in bone [13].
In this work, evolution of microstructure and local mechanical properties in dynamically deformed (strain rates ∼103); high-purity tantalum was investigated. More specifically, a novel combination of spherical nanoindentation and EBSD was used to characterize changes in the local slip resistance in deformed, polycrystalline samples of tantalum. The indentation yield strength (Yi nd) extracted from ISS curves is influenced by both local crystal orientation and the local dislocation density. To decouple the two contributions, a two-step procedure presented in [14] is followed. In the first step, the effect of local crystal orientation on Yi nd is accounted for by focusing on annealed samples (negligible dislocation density) of the material system of interest. The attention is shifted to deformed samples in the second step. However, the knowledge gained in step-1 is extremely important to accurately relate the Yi nd measured in the deformed samples to the changes in the slip resistance caused by the increased dislocation density.
The paper is organized as follows: Sect. 2 provides a brief overview of the indentation data analysis protocols
used in this work. The details of the materials and experimentation methodologies used in this study are provided in Sect. 3. In Sect. 4, we describe the experimental observations and discuss the results. The concluding remarks are presented in Sect. 5.
2. Indentation stress-strain (ISS) curves
The raw nanoindentation load-displacement data was converted into ISS curves following the procedures developed by Kalidindi and Pathak [6]. A brief summary of the same is provided here. This procedure follows a two-step approach consisting of (i) the determination of an effective zero point followed by (ii) the calculation of the contact radius used for computing the indentation stress and strain values. The aim of the first step is to determine the effective point of initial contact, i.e., a clear identification of a point that makes the measurements in the initial elastic loading segment consistent with the predictions of Hertz’s theory [15,16]. Typically, the default protocols in the vendor-provided analyses software do not perform adequately in this respect, mostly resulting in the overestimation of the sample surface [4]. The problem is often made worse by surface roughness issues, non-ideal geometry of the indenter and the effects of the surface preparation techniques [17]. The load and displacement corrections (P∗ and h∗ respectively) are calculated by performing a linear regression analysis of the expected relationship between the measured load signal, ˜P, the measured displacement signal, ˜h, and the continuous stiffness measurement, S. For the initial elastic loading segment in the spherical indentation of a flat isotropic sample surface this relationship is given by Hertz theory as:
S= 3P 2he =
3( ˜P−P∗)
2( ˜he−h∗)· (1) In the second step, Hertz’s theory is recast in the following set of equations to calculate the contact radius, a, and indentation stress,σi nd, and indentation strain,εi nd, values:
a= S
2Ee f f σi nd =Ee f fεi nd,
(2) σi nd =
P
πa2, εi nd=
4 3π
he a ≈
he 2.4a·
Here, he is the elastic indentation depth, S is the elastic stiffness described earlier, a, the radius of the contact boundary at the indentation load P, the effective radius and the effective stiffness of the indenter and the specimen system, Re f fand Ee f f respectively are given by the following equations:
1 Ee f f =
1−νs2
Es +
1−νi2 Ei
(3) 1
Re f f = 1 Ri +
1 Rs
where ν and E are the Poisson’s ratio and the Young’s modulus, R refers to the radius and the subscripts s and i refer to the specimen and the indenter, respectively.
Note that the protocols described above rely on the CSM to obtain a continuous estimate of the radius of contact, a, at every point on the load-displacement curve. It has been shown [18] that the most reliable (ISS) curves can be obtained using the CSM at 45 Hz oscillation frequency and a 2 nm oscillation amplitude. These test conditions were utilized in all of the measurements reported here.
3. Materials and methodology
High-purity tantalum was used in this investigation to reduce the number of factors that can influence the evolution of microstructure during deformation such as second phases, twinning, and inclusions. The details of this tantalum plate material (chemistry, texture, grain size) can be found elsewhere [19]. Right, cylindrical compression samples were cut from the as-received plate of tantalum (5mm in diameter by 5mm in height). A split Hopkinson pressure bar (SHPB) was used to dynamically (strain rates ∼1800/s) impart predetermined levels of strain into the tantalum specimens. A typical stress-strain response for tantalum is shown in Fig. 1. Also marked in Fig. 1 are the strains to which interrupted compression tests were performed. Characterization, presented here focused on the as-annealed state and then again of the compression cylinder deformed to 20% strain. The other samples (intermediate strain levels) will be the focus of future work and are included here only to illustrate the evolution in the microstructure. All specimens tested in the SHPB were sectioned along the compression axis and mounted in epoxy. Since a high quality surface finish is critical for both nanoindentation [17] and EBSD, mechanical grinding was followed by polished using alumina and subsequently silica suspensions. The samples were then lightly etched using a mixture of water (10 ml), nitric acid (10 ml), hydrochloric acid (10 ml) and hydrofluoric acid (5 ml).
Grain orientation maps for the samples were obtained using orientation imaging microscopy (OIM), which is based on the automatic indexing of EBSD patterns. Orientation at each point was denoted using the Bunge-Euler angles [20], an ordered set of three angles (ϕ1, , ϕ2), which describe the rotations for the
transformation from the sample reference frame to the crystal reference frame. Inverse pole figure (IPF) maps as well as grain orientation spreads maps for the tantalum samples are also shown in Fig.1.
Nanoindentation tests were then performed at pre-selected locations on these samples using the MTS nanoindenter XPRequipped with the CSM attachment.
0
0.05
0.1
0.15
Strain
0
200
400
600
800
1000
(
ss
er
t
Sa
P
M)
g
Figure 1. Typical stress-strain response for high purity polycrystalline tantalum deformed in a split Hopkinsin bar at a strain rate of
∼1800/s. Inverse pole figure maps and grain orientation spreads for samples after a strain of 0, 3, 10 and 20% strain are also shown. The samples with 0 and 20% strain were used for mechanical characterization using spherical nanoindentation.
40
30
20
10
0
0.75
0.5
0.25
0
Indentaon Strain 139 GPa
147 GPa
Yind
In
d
e
n
ta
o
n
St
re
ss
(
G
P
a
)
Displacement (nm)
Load (
m
N)
Grain A Grain B
) b ( )
a
( 0 50 100 150 200 0 0.01 0.02
Figure 2. Representative (a) load-displacement and (b)
corresponding indentation stress-strain response for two grains in the as received tantalum sample show that the nanoindentation response is strongly influenced by the local crystal lattice orientation. The inset in (a) shows the IPF map which indicates the orientation of the grains with respect to the indentation axis. The dashed vertical lines in (b) show the segment of the stress-strain curve used for the back extrapolation.
and 0.017. This protocol was standardized for all the tests reported in this paper.
4. Results and discussion
Representative load displacement curves and correspond-ing ISS curves for two orientations tested in the as-received condition are presented in Fig. 2. The inset in Fig.2(a) shows the orientations of grains A and B plotted on the standard [001] inverse pole figure (IPF) map. Specifically, the position of grains A and B on the IPF map represent the crystal direction in the grain that is parallel to the indentation direction. Note that since we use an axisymmetric indenter tip, in plane rotations of the crystal orientation do not alter our indentation response. Consequently, only two (,ϕ2) of the three Bunge-Euler
angles used to represent the crystal orientation have an effect on the indentation response.
In Fig.2, grain A is close to the [001] corner of the IPF map, meaning that the [001] crystal direction is parallel
to the indentation axis and grain B is close to the [111] corner of the IPF map and has the [111] crystal direction almost parallel to the indentation axis. The misorientation between these two orientations is close to the maximum possible value for cubic materials and as expected, the two orientations show a very large difference in their nanoindentation response.
While the nanoindentation response for only two orientations is shown in Fig. 2, a total of 160 orientations were tested. The local crystal anisotropy affects both the elastic and plastic response. The values of Es were found to be in the range of 139 to 150 GPa and the Yi nd values range from 240 to 400 MPa. Values for both Es and Yi nd are the lowest for orientations close to [001] and highest close to the [111] crystal direction.
Figures 3 and4 are contour plots showing the effect of crystal orientation on Es and Yi nd, respectively. The contour plots were created by interpolating between the measured Es and Yi nd using generalized spherical harmonics (GSH) [20]. The contour plot in Fig. 4, henceforth referred to as the indentation yield surface, is of tremendous value in the studies on deformed samples as it provides a baseline and helps decouple the effects of orientation and local dislocation density on the measured Yi nd in deformed materials. Using this map, Yi nd for any given orientation in high-purity tantalum can now be estimated. Having established a quantitative relationship between local crystal orientation and Yi nd, we focus our attention now on the deformed tantalum sample.
E
s(GPa)
[001]Figure 3. Contour plot generated by interpolating between the
Es values extracted for about 160 orientations in the as received condition. The black circles represent the positions of the tested orientations on the standard IPF plot.
Y
ind(GPa)
[001]Figure 4. Contour plot generated by interpolating between the
Yind values extracted for about 160 orientations in the as received condition. The black circles represent the positions of the tested orientations on the standard IPF plot.
were performed and EBSD was used to determine the local crystal orientation at the indentation site. Yi nd values were extracted using the back-extrapolation method, as in the previous case. Figure 5 shows the difference in the nanoindentation response for four grains, two tested in the as received condition (same data as Fig. 2) and two in the 20% deformed sample. As seen from the inset in Fig. 5(a), grains A2 and B2, tested in the deformed condition are almost the same orientation as grain A and B respectively, which were tested in the as received condition. As seen here, the increment in the Yi nd due to the imposed deformation can be as high as 60% depending on the location of the indent.
For each of the grains tested in the deformed condition, the Yi nd in the as received condition was predicted using the indentation yield surface presented in Fig.4. This is the Yi ndthat would have been measured for the orientations in question, if they were tested in the as received condition.
0 20 40
0 100 200
0 0.4 0.8 1.2
0 0.01 0.02
Grain A
Grain B
Grain A2 Grain B2
139 GPa 147 GPa 40
20
0
1.2
0.8
0.4
Indentaon Strain
In
denta
o
n
S
tress
(GP
a
)
Displacement (nm)
Loa
d
(mN
)
) b ( )
a
( 0 50 100 150 200 0 0.01 0.02
0
Figure 5. (a) The load-displacement data, and (b) corresponding
indentation stress-strain curves for two pairs of almost identically oriented grains showing the effect of deformation on the ISS response. For each pair, one grain was tested in the as received condition (Grain A and B) and the other grain was tested after the sample was deformed by 20% (Grain A2 and Grain B2).
It is important to accurately establish this value since the Yi nd can vary by as much as 40%, even in the as received condition, depending on the local crystal lattice orientation at the indentation site. A reliable estimate of the increment in the indentation yield strength (Yi nd) for any given orientation can then be determined as the difference between the measured indentation yield point in the deformed condition (Yi nd(g,d)) and the estimated indentation yield point in the fully annealed condition Yi nd (g,0) and is given as
Yi nd(g, ε)=Yi nd(g,d)−Yi nd(g,0) (4)
where εrefers to the amount of deformation- 20% strain under dynamic loading conditions and g refers to the local crystal lattice orientation at the indentation site.
The simplest relationship that one can establish between the increment in the indentation yield point (Yi nd) and the local dislocation content (ρ) is through the increment in the critical resolved shear strength (τcr ss) of the slip system. In a highly simplified manner, this relationship can be expressed as
Yi nd=M (, φ2)τcr ss (5)
τcr ss∝ √
ρ (6)
and
M =
γ
ε (7)
where M is a Taylor factor that depends only on the grain orientation with respect to the indentation direction (in this case, only two of the three Bunge-Euler angles describing local crystal orientation), τcr ss is the average critical resolved shear stress in the crystal, τcr ss is the increment in the local averaged critical resolved shear strength between the annealed and deformed conditions, andρis the local dislocation density.γ is the sum of the shears on all the slip planes and ε is the imposed macroscopic strain.
Combining Eqs. (4) and (5), the percentage increase in the critical resolved shear stress is given as
Yi nd Yi nd(g,0) =
τcr ss
80
70
60
50
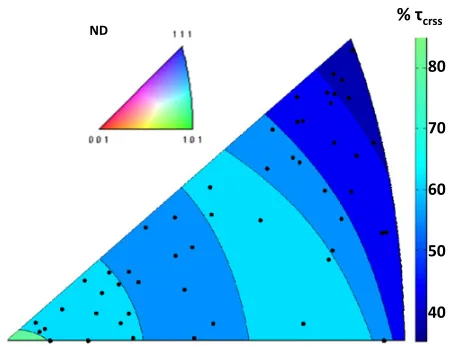
40 % crss
ND
Figure 6. Contour plot generated by interpolating between
the change in slip resistance values extracted for about 70 orientations in the 20% deformed sample. The black circles represent the positions of the tested orientations on the standard IPF plot.
Since the change in the average critical resolved shear stress in the crystal can be related to the local dislocation density (Eq. (5)), the percentage increase in Yi nd provides an indirect measure of the local dislocation content at the indentation site.
A total of about 50 orientations were tested in the 20% deformed sample and the %Yi nd (or %τcr ss) was computed in each case. It is seen that the computed %τcr ss is highly non-uniform across all the tests and varies significantly depending on the grain orientation. The variation of increment in the local critical resolved shear strength as a function of crystal orientation is plotted in Fig.6. It is seen from this figure that the highest values for %τcr ssoccur for orientations close to the [001] orientation. It has been hypothesized that orientations with a lower Taylor factor (soft grains) develop lower dislocation densities compared to grains with a higher Taylor factor (hard grains) and that for a given increment of imposed plastic strain, the increment in local dislocation density is directly proportional to the Taylor factor. The relevant Taylor factor, in this case is that for uniaxial compression, and is not to be confused with the Taylor factor for nanoindentation, referred to in Eq. (4). Taylor factor is a parameter frequently used for indicating slip activity for a particular orientation, during a given deformation mode and is defined in Eq. (7). Thus, an orientation with a lower Taylor factor is expected to undergo a lower amount of slip activity in order to accommodate the imposed strain, as compared to an orientation with the higher Taylor factor. Consequently, an orientation with a lower Taylor factor is expected to have a lower amount of stored dislocations. This hypothesis [14] has been verified using the approach described here on large grained (2–4 mm), high-purity, aluminum samples tested under quasi-static conditions, when nanoindentation tests were performed in the middle of the grains and well away from grain boundaries. At grain boundaries however, it has been shown that the soft grains, when present next to hard grains, show a hardened layer close to the boundary, as a result of grain
interactions [21]. This hardened layer was seen to be up to 20µm thick.
It the present study however, the highest values for %τcr ss are seen for orientations close to the [001], which is a soft orientation and the highest values are seen close to the [111] orientation, which is a hard orientation. The trends observed are opposite to those seen for grain interiors in the case of aluminum. In other words, they are the trends that were seen close to grain boundaries for aluminum. Note that the hardened layer in the case of aluminum extended up to 20µm from the grain boundary. And, in the case of the tantalum samples used in the present study, the grain size is ∼40µm. It appears that smaller grain size causes the grain interactions to dominate the local mechanical response within entire grains in the deformed sample, unlike the case of aluminum, where the effect of grain interactions was limited to a relatively thin (as compared to the grain size) layer and the grain interiors deformed as per Taylor predictions.
5. Concluding remarks
A novel approach to characterize the percentage increase in the slip resistance during dynamic deformation of tantalum is presented in this work. This two-step process combines local mechanical property information obtained using spherical nanoindentation with corresponding structure information gathered using EBSD at increasing levels of strain. The increase in the local slip resistance (due to the dynamic deformation) can then be linked to the change in Yind. It was seen that for the tantalum studied here, with grain sizes of ∼40µm, grain interactions dominated the change of local slip resistance. While only one sample, deformed to 20% strain was characterized in this work, characterization of samples strained to intermediate levels (5% and 10%) will be done in the future and is likely to shed more light into the evolution of slip resistance and its dependence on crystal orientation. This work will also serve to establish an initial, comparative basis for future studies focused on quantifying the strength of dynamically damaged tantalum.
References
[1] Kalidindi, S.R., A. Bhattacharya, and R. Doherty, Detailed Analysis of Plastic Deformation in Colum-nar Polycrystalline Aluminum Using Orientation Image Mapping and Crystal Plasticity Models. Proceedings of the Royal Society of London: Mathematical, Physical and Engineering Sciences., 2004. 460(2047): p. 1935–1956.
[2] Asaro, R.J., Crystal Plasticity. Journal of Applied Mechanics, 1983. 50(4b): p. 921–934.
[3] Kalidindi, S.R. and L. Anand, An Approximate Procedure for Predicting the Evolution of Crystal-lographic Texture in Bulk Deformation Processing of Fcc Metals. International Journal of Mechanical Sciences, 1992. 34(3): p. 309–329.
Proceedings of the 1996 6th Conference on Frontiers in Electron Microscopy in Materials Science, Jun 4-7 1996, 1997. 67(1-4): p. 11–17.
[5] Adams, B.L. Measurement and representation of polycrystalline microstructure. in Winter Annual Meeting of the American Society of Mechanical Engineers, Nov 8–13 1992. 1992. Anaheim, CA, USA: Publ by ASME, New York, NY, USA.
[6] Kalidindi, S.R. and S. Pathak, Determination of the effective zero-point and the extraction of spherical nanoindentation stress-strain curves. Acta Materialia, 2008. 56: p. 3523–32.
[7] Pathak, S., J. Shaffer, and S.R. Kalidindi, Deter-mination of an effective zero-point and extraction of indentation stress-strain curves without the continuous stiffness measurement signal. Scripta Materialia, 2009. 60: p. 439–42.
[8] Li, X. and B. Bhushan, A review of nanoindentation continuous stiffness measurement technique and its applications. Materials Characterization, 2002. 48(1): p. 11–36.
[9] Fischer-Cripps, A.C., Study of analysis methods of depth-sensing indentation test data for spherical indenters. Journal of Materials Research, 2001. 16: p. 1579–84.
[10] Pathak, S., D. Stojakovic, and S.R. Kalidindi, Measurement of the local mechanical properties in polycrystalline samples using spherical nanoinden-tation and oriennanoinden-tation imaging microscopy. Acta Materialia, 2009. 57: p. 3020–8.
[11] Pathak, S., et al., Studying grain boundary regions in polycrystalline materials using spherical nano-indentation and orientation imaging microscopy. Journal of Materials Science, 2012. 47(2): p. 815– 823.
[12] Pathak, S., et al., Viscoelasticity and high buckling stress of dense carbon nanotube brushes. Carbon, 2009. 47: p. 1969–1976.
[13] Pathak, S., et al., Assessment of lamellar level properties in mouse bone utilizing a novel spherical nanoindentation data analysis method. Journal of the Mechanical Behavior of Biomedical Materials, 2012. 13(0): p. 102–117.
[14] Vachhani, S.J. and S.R. Kalidindi, Grain-Scale Measurement of Slip Resistances in Aluminum Polycrystals using Spherical Nanoindentation Acta Materialia, 2015. accepted.
[15] Hertz, H., Miscellaneous Papers. New York: MacMillan and Co., Ltd, 1896.
[16] Johnson, K.L., Indentation Contact Mechanics. 1985: Cambridge University Press, Cambridge. [17] Pathak, S., et al., Importance of surface preparation
on the nano-indentation stress-strain curves mea-sured in metals. Journal of Materials Research, 2009. 24: p. 1142–55.
[18] Vachhani, S.J., R.D. Doherty, and S.R. Kalidindi, Effect of the continuous stiffness measurement on the mechanical properties extracted using spherical nanoindentation. Acta Materialia, 2013. 61(10): p. 3744–3751.
[19] T. Bucchiet E.K. Cerreta, L.D., S.R. Chen, J. Michael, Characterization of Tri-Lab Tantalum. Sand2014-17645.
[20] Bunge, H.-J., Texture analysis in materials science. Mathematical Methods. 1993, G¨ottingen: Cuvillier Verlag.