c
Owned by the authors, published by EDP Sciences, 2015
The
ln A
study with the Muon tracking detector in the KASCADE-Grande
experiment – comparison of hadronic interaction models
P. Łuczak11,a,b, W.D. Apel1, J.C. Arteaga-Vel´azquez2, K. Bekk1, M. Bertaina3, J. Bl¨umer1,4, H. Bozdog1, I.M. Brancus5,
E. Cantoni3,6,c, A. Chiavassa3, F. Cossavella4,d, C. Curcio3, K. Daumiller1, V. de Souza7, F. Di Pierro3, P. Doll1, R. Engel1,
J. Engler1, B. Fuchs4, D. Fuhrmann8,e, H.J. Gils1, R. Glasstetter8, C. Grupen9, A. Haungs1, D. Heck1, J.R. H¨orandel10,
D. Huber4, T. Huege1, K.-H. Kampert8, D. Kang4, H.O. Klages1, K. Link4, M. Ludwig4, H.J. Mathes1, H.J. Mayer1,
M. Melissas4, J. Milke1, B. Mitrica5, C. Morello6, J. Oehlschl¨ager1, S. Ostapchenko1,f, N. Palmieri4, M. Petcu5, T. Pierog1,
H. Rebel1, M. Roth1, H. Schieler1, S. Schoo1, F.G. Schr¨oder1, O. Sima12, G. Toma5, G.C. Trinchero6, H. Ulrich1,
A. Weindl1, J. Wochele1, and J. Zabierowski11
1 Institut f¨ur Kernphysik, KIT - Karlsruher Institut f¨ur Technologie, Germany 2 Universidad Michoacana, Instituto de F´ısica y Matem´aticas, Morelia, Mexico 3 Dipartimento di Fisica, Universit`a degli Studi di Torino, Italy
4 Institut f¨ur Experimentelle Kernphysik, KIT - Karlsruher Institut f¨ur Technologie, Germany 5 Horia Hulubei National Institute of Physics and Nuclear Engineering, Bucharest, Romania 6 Osservatorio Astrofisico di Torino, INAF Torino, Italy
7 Universidade S˜ao Paulo, Instituto de F´ısica de S˜ao Carlos, Brasil 8 Fachbereich Physik, Universit¨at Wuppertal, Germany
9 Department of Physics, Siegen University, Germany
10 Deptartment of Astrophysics, Radboud University Nijmegen, The Netherlands 11 National Centre for Nuclear Research, Department of Astrophysics, Ł´od´z, Poland 12 Department of Physics, University of Bucharest, Bucharest, Romania
Abstract. With the KASCADE-Grande Muon Tracking Detector it was possible to measure with high accuracy directions of EAS muons with energy above 0.8 GeV and up to 700 m distance from the shower centre. Reconstructed muon tracks allow investigation of muon pseudorapidity (η) distributions. These distributions are nearly identical to the pseudorapidity distributions of their parent mesons produced in hadronic interactions. Comparison of theη distributions from measured and simulated showers can be used to test the quality of the high energy hadronic interaction models. The pseudorapidity distributions reflect the longitudinal development of EAS and, as such, are sensitive to the mass of the cosmic ray primary particles. With various parameters of theηdistribution, obtained from the Muon Tracking Detector data, it is possible to calculate the average logarithm of mass of the primary cosmic ray particles. The results of theln Aanalysis in the primary energy range 1016eV–1017eV with the 1stquartile and the mean value of the distributions will be presented for the QGSJet-II-2, QGSJet-II-4, EPOS 1.99 and EPOS LHC models in combination with the FLUKA model.
1. Introduction
1.1. Muon tracking in KASCADE-Grande
The KASCADE-Grande experiment [1] was an air shower ground-based detector system located in Germany at Karlsruhe Institute of Technology (KIT – Campus North). At the end of 2012 the active data acquisition of all the experiment components stopped, however, the collaboration continues the detailed analysis of nearly 20 years of high-quality air-shower data.
aCorresponding author
be-mail:[email protected]
cNow at: Istituto Nazionale di Ricerca Metrologia, INRIM,
Torino
dDLR Oberpfaffenhofen, Germany
eNow at: University of Duisburg-Essen, Duisburg, Germany fNow at: Stanford University (CA)
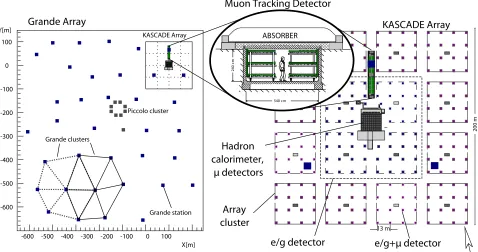
The KASCADE-Grande experiment (Fig.1) contained several detector systems. The most important for the presented analysis are the KASCADE Array, the Grande Array and the large area Muon Tracking Detector (MTD). The KASCADE Array was situated in the North-East corner of the experimental setup. It was an array of 252 detector stations, covering an area of 200 m × 200 m. The stations were placed on a square grid with 13 m spacing and were organized in 16 clusters. Each station was equipped with scintillation counters registering the electromagnetic shower component (Et hr=5 MeV), and in the outer 12 clusters, also the muonic part of EAS (Et hr
µ =230 MeV).
A second major part of KASCADE-Grande is the
Grande Array, being an extension of the KASCADE
Array. It consisted of 37 detector stations organized in a grid of 18 clusters of overlapping hexagons, covering an area of 0.5 km2. In the centre there was a small
13 m
Hadron calorimeter,
µ detectors
Array cluster
e/g+µ detector Muon Tracking Detector
KASCADE Array Grande Array
200 m
e/g detector
Grande clusters
Grande station
-600 -500 -400 -300 -200 -100 0 100 X[m] 100
0
-100
-200
-300
-400
-500
-600 Y[m]
Piccolo cluster KASCADE Array
540 cm
240
c
m
ABSORBER
Figure 1. Layout of the KASCADE-Grande experiment distributed over the KIT – Campus North area. The KASCADE Array is situated
in the North-East corner of the Campus; note the position of the Muon Tracking Detector.
trigger array of plastic scintillation stations, called Piccolo, built to provide additional fast triggers for some of the KASCADE detector components. Extended information about the KASCADE Array and Grande Array can be found in [1] and [2].
1.2. Design of the MTD
The large area Muon Tracking Detector was located in the northern part of the KASCADE Array (as shown in Fig.1) and housed 16 muon telescopes made of streamer tubes. The telescopes were placed in a 5.4×2.4×44 m3
concrete tunnel, additionally buried under an absorber made of iron plates separated with sand. This shielding corresponds to an equivalent of 18 radiation lengths and absorbed most of the low-energy electromagnetic particles, thus allowing the identification of the tracks from muons with an energy larger than 800 MeV. The streamer tubes in each muon telescope were grouped in four 2×4 m2
detector modules, three horizontal and one vertical (Fig.1). The horizontal modules were separated by 820 mm. The middle module was located 1.7 m below the level of the KASCADE scintillator array. The total area for detection of vertical muons was 128 m2.
An extended description of the design, performance and tests of the MTD can be found in refs. [3,4] and [5].
2. The mass sensitivity of the EAS muon
pseudorapidity
The directional data obtained with the MTD enables to investigate the longitudinal development of the muonic component in air showers which is a signature of the development of the hadronic EAS core, being in turn
Figure 2. Definition of radial (ρ) and tangential (τ) angles.
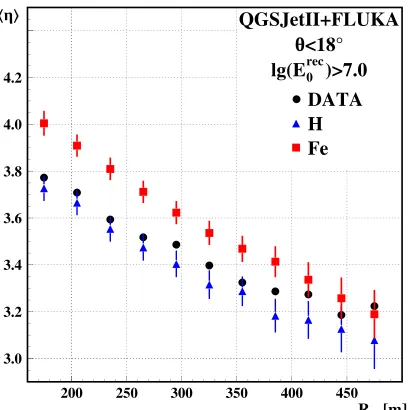
Figure 3. Lateral distribution of mean muon pseudorapidity in
the limited distance range (see text) measured in KASCADE-Grande and compared with the CORSIKA simulation values for proton and iron CR primaries. Separation between distributions obtained with simulated and measured showers is clearly visible.
Table 1. Rµdistance ranges for each analysed energy range.
Er ec
0 /107GeV Rµ[m]
1.34±0.01 250–370
2.07±0.01 250–370
2.69±0.01 280–400
5.34±0.02 280–430
7.15±0.07 280–430
the plane parallel to the shower axis at the position of the detector and perpendicular to the radial plane.
In the KASCADE-Grande experiment muons have been registered up to 700 meters from the shower core. For the presented analysis, the muon-to-shower-axis (Rµ) distance ranges (Table 1) were limited to the distances where the mass composition of the detected showers is constant in each energy range, not being affected by experimental inefficiencies. The selection of showers by their mass composition was done by taking into account the lg(Nµ)/lg(Ne) ratio which depends on the mass of the CR primary particle [5,9].
In this analysis EAS initiated by proton and iron primary CR particles were simulated with the CORSIKA code using QGSJet-II-2 [10] and QGSJet-II-4 [11] as the high energy hadronic (HE) interaction models and FLUKA [12] as the low energy (LE) hadronic interaction model. The QGSJet models were used to simulate hadronic interactions of particles with energy above 200 GeV while the FLUKA model was used to simulate those below this energy. In the measured and simulated data only showers with zenith angle up to 18◦are analysed.
It was shown in [5,13], where the QGSJet-II-2 and EPOS1.99 [14] in combination with FLUKA were used, that the pseudorapidity of EAS muons is a parameter sensitive to the mass of the primary cosmic ray particles and can be used to calculate ln A of CRs. It was
Figure 4. Test of the linear dependence of mean EAS muon
pseudorapidity on the logarithm of primary mass. Triangles – simulatedηvalues for H,C and Fe versus true ln A on the x-axis. A full circle –ln Acalculated for carbon, using itsη value obtained with the simulations.
observed that theηdistributions from the measured data are bracketed by the distributions from simulated showers and thatln Aandηare related linearly.
In Fig. 3 the lateral distribution of the mean η, experimental results are compared with simulations for two primary CR particles, H and Fe. Separation of theη for H and Fe initiated showers is clearly visible.
The results of the linearity check are shown in Fig.4. Here, ln A was calculated from the η distribution for simulated carbon initiated showers and compared with the known value ln 12=2.49. The mean value of the calculated ln A differs here by less than 1% from the true value for carbon primaries, justifying the use of the mean muon pseudorapidity for the determination of ln A of cosmic rays above 1016eV.
In the investigation of the muon production height (hµ) [6] it has been found that the measured values of hµ above 4 km, where the interactions are described by the HE interaction model are not well described by the simulations. This is not the case for hµ<4 km, where the interactions are described by the LE interaction model, and where the measurements are compatible with the simulations.
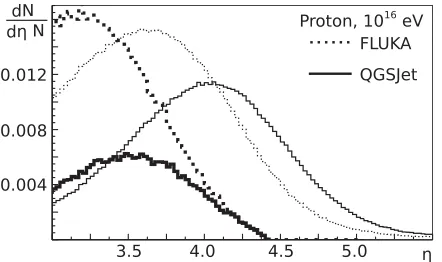
Figure 5. Comparison betweenηdistributions from HE (solid lines, QGSJet) and LE (dotted lines, FLUKA) muon sample before (thin) and after (bold) the angular cuts – see text.
The differences in the LE and HE muon sample contributions suggest that the calculation ofln Awith the 1stquartile of the distribution, where LE interaction model
dominates, will limit the influence of the HE interaction model. However, the value of the quartile is affected by the tail from the HE muon sample and the analysis is biased. To minimize this bias it is necessary to apply the angular cuts on the radial and tangential angle values. An example of the effect of such angular cuts is depicted in Fig.5. Here theηdistributions from the QGSJet-II-2 (solid lines) and FLUKA (dotted lines) muon sample are compared before (thin solid and dotted lines,−0.5◦< ρ <17◦ and |τ|< 17◦) and after (bold solid and dotted lines, 1.4◦< ρ <17◦ and 0.8◦<|τ|<17◦) the angular cuts. However, in the experiment conditions, it is necessary to take into account the statistics of available simulated and measured data. That is why it was not possible to eliminate the tails from the HE muon sample, as efficiently as shown in Fig.5.
The angular cuts which provide an as small as possible decrease in muon statistics and suppress tails from the HE sample without significant distortion of the shape of the pseudorapidity distribution are: 0.75◦< ρ <17◦ and 0.2◦<|τ|<17◦.
3. Results and conclusions
The results of the ln A calculation are presented in Figs.6,7and8.
In the presented analyses we use as a reference the ln A values derived from the analysis of the EAS electrons and muons measured in KASCADE experiment interpreted with the QGSJet01+FLUKA model combination [15,16].
In Fig. 6 the results of the ln A analysis obtained with η for the 2+FLUKA and QGSJet-II-4+FLUKA model combinations are shown.
The main conclusion from the analysis with the QGSJet-II-2+FLUKA model combination was thatln A is increasing with the energy, but its values are lower than expected in the energy range 1016eV – 1017eV [17,18].
The reason for this are the distortions of theηdistributions in simulations caused by the large number of highηmuons that are shifting theηof the distributions towards higher values. As a result of this shift, the distributions from
Figure 6. Results of theln Aanalysis obtained with theηwith QGSJet-II-2 ( ) and QGSJet-II-4 () models in combination with the FLUKA model, compared with the KASCADE results (⊗) as a reference.
Figure 7. Results of the ln Aanalysis obtained with the first quartile with QGSJet-II-2 () and QGSJet-II-4 (
•
) models in combination with the FLUKA model, compared with the KASCADE results (⊗) as a reference.the measurement are close to these from proton initiated showers. This behaviour is caused by the QGSJet model which provides too many high η muons that reach the observation level.
In the case of the QGSJet-II-4+FLUKA model combination there is a trend of ln A towards higher values in comparison with the previous version of the QGSJet model. However, the analysis requires larger statistics of simulated showers (work in progress).
In Fig. 7 the results of the ln A analysis obtained with the first quartile of the η distributions for the QGSJet-II-2+FLUKA and QGSJet-II-4+FLUKA model combinations are presented. From this analysis we can conclude that the results obtained with both models are compatible with the KASCADE and Grande results. This suggests that this method can be used to investigate the mass composition using pseudorapidity of muons.
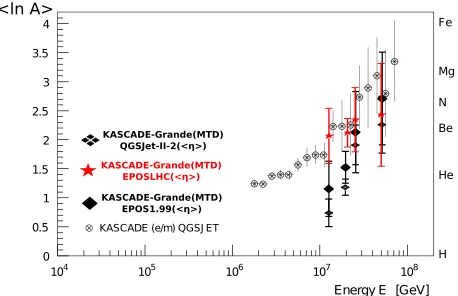
Figure 8. Comparison of theln Avalues obtained withηwith QGSJet-II-2 ( ), EPOS1.99 () and EPOS-LHC(o) models in combination with the FLUKA model, compared with the KASCADE results (⊗) as a reference.
lower that KASCADE results. A comparison between the EPOS1.99+FLUKA and EPOS-LHC+FLUKA model combinations shows that ln A from the latter model combination has higher values. The increase in ln A values is especially visible in the first three presented energy points, despite relatively large statistical errors. In the other energy ranges theln Avalues are similar within statistical errors. The results of theln Aanalysis for the EPOS-LHC model are compatible with the KASCADE and Grande results, they have similar values which rise with the primary energy at a similar rate. This is a significant improvement with respect to the previous version of EPOS model, where the ln A values were lower than those from KASCADE analysis.
In conclusion, the changes introduced into the latest versions of the HE hadronic interaction models have noticeable effects onto the calculation of ln A using muon pseudorapidity distributions. The most significant improvement with respect to the previous version of EPOS model can be seen in the results obtained with the EPOS-LHC model [19]. Now, theln A values are at the same level as those from the KASCADE analysis. In case of the QGSJet-II-4 model [11], there is a trend of theln A towards higher values, in comparison with the previous version of the QGSJet model. However, the analysis requires larger statistics of simulated showers (work in progress).
From theln Aresults obtained with the first quartile we can conclude that the results obtained with both QGSJet models are compatible with the KASCADE and Grande results which suggests that this method can be used to investigate the mass composition using the pseudorapidity of muons.
The authors would like to thank the members of the engineering and technical staff of the KASCADE-Grande collaboration, who contributed to the success of the experiment. The KASCADE-Grande experiment is supported in Germany by the BMBF and
by the Helmholtz Alliance for Astroparticle Physics – HAP funded by the Initiative and Networking Fund of the Helmholtz Association, by the MIUR and INAF of Italy, the Polish Ministry of Science and Higher Education, and the Romanian Authority for Scientific Research UEFISCDI (grants PNII-IDEI 271/2011 and RU-PD 17/2011).
References
[1] W.D. Apel et al. (KASCADE-Grande Collaboration), Nucl. Instrum. Meth. A 620, 202 (2010)
[2] T. Antoni et al. (KASCADE Collaboration), Nucl. Instrum. Meth. A 513, 490 (2003)
[3] P. Doll, W. Bartl, C. B¨uttner, K. Daumiller, K. Kampert, H. Klages, D. Martello, R. Obenland, L. Pentchev, J. Zabierowski, Nucl. Instrum. Meth. A 488, 517 (2002)
[4] J. Zabierowski, P. Doll, Nucl. Instrum. Meth. A 484, 528 (2002)
[5] P. Łuczak, Ph.D. thesis, National Centre for Nuclear Research, Poland (2012), http://www. ncbj.gov.pl/node/1951
[6] W.D. Apel et al. (KASCADE-Grande Collaboration), Astropart. Phys. 34, 476 (2011)
[7] J. Zabierowski, T. Antoni, W. Apel, F. Badea, K. Bekk et al., Nucl. Phys. Proc. Suppl. 151, 291 (2006)
[8] J. Zabierowski, K. Daumiller, P. Doll, Nucl. Phys. Proc. Suppl. 122, 275 (2003), astro-ph/ 0211568
[9] J.H. Weber et al. (KASCADE Collaboration), “The
electron/muon ratio in EAS at and above the “Knee” region”, in Proceedings of the 25t h ICRC (Durban, South Africa, 1997), hE 2.1.4
[10] S. Ostapchenko, Nucl. Phys. Proc. Suppl. 151, 143 (2006),hep-ph/0412332
[11] Ostapchenko, S., EPJ Web of Conferences 52, 02001 (2013)
[12] A. Ferrari, P.R. Sala, A. Fasso, J. Ranft, Tech. rep., CERN (2005), CERN-2005-010
[13] J. Zabierowski, P. Łuczak, P. Doll et al. (KASCADE-Grande Collaboration), “On the primary mass
sensitivity of muon pseudorapidities measured with KASCADE-Grande”, in Proceedings of the 32nd ICRC (Beijing, China, 2011), Vol. 1, p. 220
[14] M. Hladik, H. Drescher, S. Ostapchenko, T. Pierog, K. Werner, Phys. Rev. Lett. 86, 3506 (2001),
hep-ph/0102194
[15] J.R. H¨orandel, Adv. Space Res. 41, 442 (2008) [16] T. Antoni et al. (KASCDE-Grande Collaboration),
Astropart. Phys. 24, 1 (2005)
[17] W.D. Apel et al. (KASCADE-Grande Collaboration), Phys.Rev.Lett. 107, 171104 (2011)
[18] W.D. Apel, et al., Astroparticle Physics 47, 54 (2013) [19] Pierog, T. and Karpenko, Iu. and Katzy, J.M. and Yatsenko, E. and Werner, K. (2013),