Available online: https://pen2print.org/index.php/ijr/ P a g e | 295
Performance Analysis Of Wavelet Transform Based Image
Denoising For Real Time Communication System
V.Lavanya& M Laxmi Prasanna Rani
1Dept.of ECE, MVGR College of Engineering, Vizianagaram, Andhra Pradesh, India,
2Dept.of ECE, MVGR College of Engineering, Vizianagaram, Andhra Pradesh, India,
Abstract:
One of the most important advantages of
the digital transmission systems for voice,
data, and video communications is that
they are highly reliable. But the major
obstacle to higher reliability and high data
transmission rate is noisy channel. By this
noise, the quality of the images can be
reduced and diagnosis becomes critical in
case of medical images. In this paper,
different test and medical images are
transmitted through an channel and the
noisy images are denoised by using
different wavelet transform techniques
(Haar, Daubechies, Coiflet, Symmlet,
bi-orthogonal). From the results it is found
that the bi-orthogonal wavelet transform
technique performs better in terms of the
performance metrics like PSNR, MSE and
SSIM compared to other wavelet
transforms.
Keywords: Wavelet, Image Denoising,
PSNR, MSE and SSIM.
Introduction
Now a day’s digital images play a vital
role in day today life and also in different
areas of research and technology. Noise is
unwanted information that interferes with
the original image and it degrades its
visual quality. There are different sources
of noise in digital images such as
imperfect instruments, data acquisition
process, interference, transmission and
compression. The images can be distorted
when they are acquired or transmitted
through a channel. By this, noise is
introduced and the quality of the images
can be reduced. So it is necessary to
reduce this noise to get error free images
for better analysis without reducing the
essence of the image. Image denoising is
removal of noise from digital image to
maintain visual quality. In case of medical
Images, denoising is a crucial step for
Available online: https://pen2print.org/index.php/ijr/ P a g e | 296 Thus, it is necessary to design some
effective techniques for denoising of
digital images. There are conventional
techniques of spatial domain and transform
techniques like frequency and wavelet
domain are used for denoising of images.
The spatial domain techniques used to
reduce noise in an image are filtering like
median filters, mean filters and etc. The
transform techniques of image denoising
are DFT, DCT, DWT and etc. The
techniques of image denoising have been
developed after a lot of research and
mainly based on thresholding Discrete
Wavelet Transform (DWT) coefficients of
the image [1]. For denoising of high noise
density images, image preprocessing
toolkit has to be applied to these images so
that essence of the image is retained.
In this paper different digital images are
transmitted through channel. The received
image is a noisy image which consists of
Gaussian noise. This noisy image is
denoised using different wavelet
transforms with non adaptive universal
threshold method. This paper is organized
as follows: section II about communication
system model to transmit and receive
image. Section III about the process of
denoising this received image from a
communication system, section IV about
results and discussion.
II. Communication system model:
The communication system model
considering channel is shown below.
Different images are considered and these
images are transmitted through the
channel. For this image is converted into
data and then the data is grey coded and it
is modulated using different modulation
techniques. Here QPSK modulation
technique is considered. As the image is
transmitted through channel, Gaussian
noise is added to it. Gaussian noise is
uniformly distributed over the image. Each
pixel of image noise is the sum value of
true pixel and a value of Gaussian noise
randomly distributed. The probability
density function [PDF] of the Gaussian
noise follows normal distribution and is
known as the Gaussian distribution.
Fig.1.Communication system model
Channel is clearly more favourable than
the Rayleigh fading channel since there is
a large performance degradation
experienced in the Rayleigh channel. Still
Available online: https://pen2print.org/index.php/ijr/ P a g e | 297 or image transmitted through it. Noise
modeling depends on several factors such
as data collection instruments,
transmission media, and Image
quantification discrete radiation sources.
Depending on the noise model, different
algorithms can be used. Various noises
have their own characteristics and are
inherent in the images of different ways.
At the receiver side demodulation,
decoding and data to image reconversion
takes place.
III. Process of denoising the
received image from a
communication system
The received noisy image is denoised
by implementing different wavelet
transforms. The block diagram for process
of denoising the received noisy image
using wavelet transform is as follows.
Fig 2: Block diagram of Image Denoising
using universal thresholding.
Wavelet Transform (WT):
The wavelet transform is a powerful tool
to de-noise an image. The wavelet
transform of a noisy image is a
combination of the wavelet transform of
the image and noise and this noise is
spread among all the wavelet coefficients.
The aim of noise reduction is to
approximate the original image by
reducing the value of Mean Square Error
(MSE).The wavelet transform basis
functions are compact in time compared to
Fourier sine and cosine functions. So the
wavelet transform provides time
information about a signal in addition to
frequency information.
Using DWT the image is decomposed into
4 sub bands; HH, HL, LH, and LL [3]. The
diagonal coefficients of the image are
given by the sub band HH, the horizontal
details are given by sub band HL and the
vertical coefficients are given by the sub
band LH. The LL sub band is the
approximation coefficients of low
frequency components and this sub band is
further divided into different sub bands in
higher levels of decomposition.
There are an infinite number of possible
Available online: https://pen2print.org/index.php/ijr/ P a g e | 298 the Haar wavelet (Daubechies order 2
wavelet), the Daubechies order 8 wavelet,
the Coiflet order 5 wavelet, and the
Symmlet order 8 wavelet and biorthogonal
wavelets of order 3.5 and 3.7. The
smoothness of the wavelet is indicated by
the order of the wavelet. As the order of
the wavelet increases it provides better
smoothness but it also means less
compactness in time. The selection of type
and order of the wavelet depends on the
dominant features of the image.
Wavelet Thresholding:
Thresholding technique for image
denoising has been proposed in the
wavelet domain by Donoho and Johnstone
[6, 7]. Image denoising using wavelet
threshold is based on the comparison of
transform domain coefficients with
threshold value. Wavelet coefficients of
the image have strong correlation at the
corresponding positions, while the
coefficients of the noise are weak. In the
fixed threshold denoising method, it will
not change with the wavelet coefficients,
which leads the inevitably error on the part
of the wavelet coefficients. When the
threshold is properly selected, most error
coefficients will appear in the
neighborhood of threshold. There will be
less error wavelet coefficients in the
adjacent region of the threshold. So the
selection of threshold becomes crucial to
get denoised image. The thresholding
techniques are of two types i.e., soft
thresholding and hard thresholding with
different thresholding of non-adaptive and
adaptive.
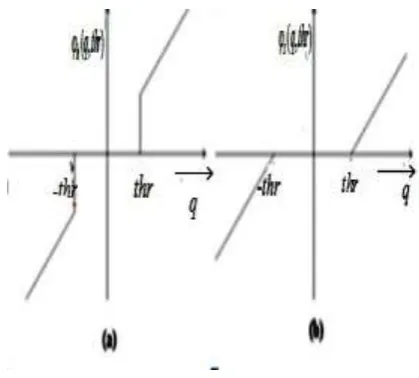
The hard and soft thresholding functions
are shown in figure. 3.
Fig 3:(a) Hard thresholding function. (b)
Soft thresholding functions
Image Denoising Using Non adaptive
Universal Thresholding
For image denoising, using the technique
of non-adaptive thresholding, the selection
of a particular threshold is the important.
The reconstructed image will remain
noisy, if the value of threshold is too less.
Available online: https://pen2print.org/index.php/ijr/ P a g e | 299 distort, if the threshold value is too large.
So the selection of threshold value is
important to get accurate results.
The steps involved in the method of
universal threshold [1] for image denoising
are explained below.
1. Discrete Wavelet Transform is
applied to the received image from
a communication system which is
passing through channel and get
the approximation, vertical,
horizontal and diagonal
coefficients by process of Wavelet
Decomposition.
2. Universal threshold is applied to all
detail coefficients of horizontal,
vertical and diagonal coefficients,
where universal threshold is
Where
Where N is the number of pixels in
an image; σ is standard deviation of
noisy image and x is the detail
coefficients of an image.
3. Apply the Inverse Discrete Wavelet
Transform to the all the threshold
coefficients and get an denoised
image.
In the wavelet domain only few
coefficients contain the energy of an image
and all the coefficients have the noise
energy. This is the fundamental idea of the
wavelet thresholding. Therefore,
non-linear wavelet soft thresholding is used to
reduce the noise coefficients to zero and
get larger coefficients representing the
image.
IV. Performance Metrics:
The performance of denoising of image
non adaptive universal threshold technique
can be obtained by calculating PSNR
(Peak Signal to Noise Ratio), MSE (Mean
Squared Error) and SSIM (Structural
Similarity Index Measurement.
MSE is another parameter that measures
the excellence of the image by estimating
the difference between original and
reconstructed images [7].
) ) ) , ( ) , ( ((
1 1 2
0 1 0
M x N y y x s y x p MN MSE (1)Where p(x,y), s(x,y )are original and
reconstructed images with size of MXN.
The excellence of the image can be
determined by the value of PSNR. High
PSNR value resembles that the
Available online: https://pen2print.org/index.php/ijr/ P a g e | 300 low PSNR value gives that reconstructed
image quality is low.
MSE I
PSNR max
2
10
log
10 (2)
Where Imax is the maximum possible
pixel values of the image.
SSIM considers image degradation as
perceived change in structural information,
while the luminance masking and contrast
masking terms are also considered.
Structural information gives strong
inter-dependencies of pixels when they are
spatially close. These dependencies give
important information about the structure
of the objects in the visual scene. The
phenomenon of image distortions tend to
be less visible in bright regions is called
Luminance masking, while contrast
masking is a phenomenon where there is
significant activity or "texture" in the
image, distortions become less visible.
The Structural Similarity (SSIM) Index
quality assessment index is based on the
computation of three terms, namely the
luminance term, the contrast term and the
structural term. The overall index is a
multiplicative combination of the three
terms.
(3)
Where
Where μx, μy, σx,σy, and σxy are the local
means, standard deviations, and
cross-covariance for images x, y. If α = β = γ = 1
(the default for Exponents), and C3 = C2/2
(default selection of C3) the index
simplifies to:
IV. Results and discussions:
This paper presents non adaptive
universal thresholding technique of
different wavelet transforms. The
thresholding is applied to the medical
images like MRI of brain, X-ray images
and a test image of lena and cameraman
processed through a channel. This
technique is implemented with the
wavelets of the Haar, Daubechies order 8
wavelet, the Coiflet order 5, Symmlet
order 8 and biorthogonal wavelets of
order 3.5 and 3.7. Performance of this
Available online: https://pen2print.org/index.php/ijr/ P a g e | 301 transforms is evaluated using the
parameters of Peak Signal to Noise Ratio
(PSNR), Mean Squared Error (MSE) and
SSIM. The following are Original, noisy
and denoised images of MRI of brain,
ultrasound image, lena and cameraman.
Fig 4: original, noisy, denoised of MRI
of brain image
Fig 5: original, noisy, denoised of ultra
sound image
Fig 6: original, noisy, denoised of lena
image
Fig 7: original, noisy, denoised of
cameraman image
The performance metrics of above
images using different wavelet transform
techniques are tabulated as follows
Table1. MSE, PSNR and SSIM of MRI
IMAGE using different wavelet transforms
Wavelet MSE PSNR SSIM
dB1(haar)
37.6281 32.3757 0.8414
Db8
20.2193 35.0731 0.9327
Boir 3.5
2.2130 44.6809 0.9922
Boir 3.7
0.0347 62.7277 0.9999
symlet 0.8820 48.6761 0.9955
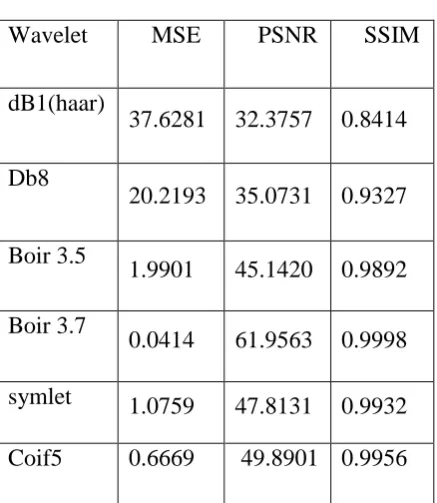
Available online: https://pen2print.org/index.php/ijr/ P a g e | 302 Table 2 MSE, PSNR and SSIM of
Ultrasound Image using different wavelet
transforms.
Wavelet MSE PSNR SSIM
dB1(haar)
37.6281 32.3757 0.8414
Db8
20.2193 35.0731 0.9327
Boir 3.5
1.9901 45.1420 0.9892
Boir 3.7
0.0414 61.9563 0.9998
symlet 1.0759 47.8131 0.9932
Coif5 0.6669 49.8901 0.9956
Table 3: MSE, PSNR and SSIM of Test
image (Lena) using different wavelet
transforms.
Wavelet MSE PSNR SSIM
dB1(haar) 34.0559 32.8089 0.8029
Db8 25.7980 34.0150 0.8737
Boir 3.5 6.8166 39.7951 0.9681
Boir 3.7 0.3879 52.2435 0.9976
symlet 3.0620 43.2707 0.9820
coif 1.3900 46.7006 0.9913
Table 4: MSE, PSNR and SSIM of Test
image(Cameraman) using different
wavelet transforms.
Wavelet MSE PSNR SSI
M
dB1(haar) 18.1223 35.5487 0.8829
Db8 15.6461 36.1868 0.9024
Boir 3.5 2.6067 43.9699 0.9819
Boir 3.7 0.0675 59.8404 0.9994
symlet 0.9217 48.4848 0.9920
coif 0.5332 50.8615 0.9952
Conclusions:
This paper progressed with non adaptive
universal thresholding technique of
different wavelet transforms of Haar,
Daubechies order 8, Coiflet order 5,
Symmlet order 8 and biorthogonal
wavelets of order 3.5 and 3.7. The values
of PSNR , MSE and SSIM are compared
for different images with different wavelet
Available online: https://pen2print.org/index.php/ijr/ P a g e | 303 biorthogonal wavelet exhibits better less
MSE, more PSNR and better SSIM values
for medical images compared to test
images which in turn reconstructs the
original image without reducing the image
quality. From the testing outcomes, it
could be concluded that the this technique
is successful and capable than prevailing
strategies in phrases of PSNR, MSE and
SSIM with biorthogonal wavelet tranform.
References
[1]. Abdullah Al Jumah: Denoising of an Image Using Discrete Stationary Wavelet
Transform and Various
ThresholdingTechniques, Published
Online February 2013 Journal of Signal and Information Processing, pp 33-41(2013),
[2]. Portilla, V. Strela, M. Wainwright and E. Simoncelli: Image Denoising Using Gaussian Scale Mixtures in the Wavelet Domain, IEEE Transactions on Image Processing, Vol. 12, No. 11, pp. 1338-1351,(2003)
[3]. P. Hedaoo and S. S. Godbole: Wavelet
Thresholding Approach for Image
Denoising, International Journal of Network Security & Its Applications, Vol. 3, No. 4, pp. 16-21(2011).
[4]. S.Roy, N. Sinha& A. K. Sen: A New
Hybrid Image Denoising method,
International Journal of Information Technology and Knowledge Management, vol. 2, no. 2, pp. 491-497(2010).
[5]. Nezamabadi-pour M and H Nasri : Image denoising in the wavelet domain
using a new adaptive thresholding function, Neuro Computing, 72, pp. 1012-1025((2009).
[6]. Martin Vetterli, S. Grace Chang and Bin Yu: Adaptive Wavelet Thresholding for Image Denoising and Compression, IEEE Transactions On Image Processing, Vol. 9, No. 9, (2000).
[7]. Bahendwar Y.S., Sinha G.R: A Comparative Performance Analysis of
Discrete Wavelet Transforms for
Denoising of Medical Images. In: Mandal D.K., Syan C.S. (eds) CAD/CAM, Robotics and Factories of the Future. Lecture Notes in Mechanical Engineering. Springer, New Delhi((2016).
[8]. Donoho D: De-noising by soft- thresholding., EEE Transactions on Inform Theory, 41(3):6l2-627(1995).
[9]. Hong-qiangShang,Rui-peng GAO and WANG, Chun-yang: An improvement of wavelet shrinkage denoising via wavelet coefficient transformation, Journal of Vibration and Shock, pp 165-168(2011). [10].Xiao-Ping Zhang: Thresholding Neural