Scholarship@Western
Scholarship@Western
Electronic Thesis and Dissertation Repository
12-3-2018 1:10 PM
The Role of TBX3 In Early Breast Cancer Progression
The Role of TBX3 In Early Breast Cancer Progression
Milica Krstic
The University of Western Ontario
Supervisor Tuck, Alan B.
The University of Western Ontario Joint Supervisor Chambers, Ann F.
The University of Western Ontario
Graduate Program in Pathology and Laboratory Medicine
A thesis submitted in partial fulfillment of the requirements for the degree in Doctor of Philosophy
© Milica Krstic 2018
Follow this and additional works at: https://ir.lib.uwo.ca/etd
Part of the Neoplasms Commons, Pathology Commons, and the Translational Medical Research Commons
Recommended Citation Recommended Citation
Krstic, Milica, "The Role of TBX3 In Early Breast Cancer Progression" (2018). Electronic Thesis and Dissertation Repository. 5971.
https://ir.lib.uwo.ca/etd/5971
This Dissertation/Thesis is brought to you for free and open access by Scholarship@Western. It has been accepted for inclusion in Electronic Thesis and Dissertation Repository by an authorized administrator of
TBX3 is a transcriptional regulator involved in embryonic development and in tumorigenesis of several cancer types. There are two isoforms of TBX3 (TBX3iso1 and TBX3iso2) with different DNA binding domains. The large-scale functional roles of TBX3iso1 and TBX3iso2 were characterized in a breast cancer context. Both TBX3 isoforms induced invasiveness and an epithelial-to-mesenchymal (EMT) phenotype. Coupling data from genome-wide ChIP-array and RNA-Seq studies provided a novel list of genes regulated by each isoform. Both TBX3 isoforms regulate expression of several EMT-related genes, including SLUG and TWIST1. Importantly, TBX3 is a direct regulator of SLUG, and SLUG expression is required for TBX3-induced migration and invasion.
Assessing TBX3 expression in early stage breast cancers by immunohistochemistry (IHC) revealed high expression in low-grade lesions. Within a second non-high-grade cohort, there was an association between TBX3 expression in the pre-invasive ductal carcinoma in situ (DCIS) and size of the invasive focus. Additionally, there was a positive correlation between TBX3/SLUG, and TBX3/TWIST1 expression by IHC in the invasive carcinoma. Pathway analysis of transcriptomics data revealed altered expression of several proteases and their inhibitors, consistent with the ability of tumor cells to degrade basement membrane. These findings strongly suggest the involvement of TBX3 in the promotion of invasiveness and progression of early stage pre-invasive DCIS to invasive carcinoma through the low-grade molecular pathway.
In conclusion, I have found evidence for a role of TBX3iso1 and TBX3iso2 in direct modulation of EMT and invasiveness, and a role for TBX3iso1 in inducing angiogenesis. Together these, along with previous work showing anti-senescence and pro-proliferative activities of TBX3, suggest multiple potential activities for promotion of malignancy of breast cancer.
Keywords
Breast cancer
Breast cancer progression
Transcriptional regulation
Alternative splicing
DCIS (ductal carcinoma in situ)
IDC (invasive ductal carcinoma)
EMT (epithelial-mesenchymal transition)
Angiogenesis
T-box 3 (TBX3)
SLUG (SNAI2)
Osteopontin (OPN)
Co-Authorship Statement
Chapter 2 in this dissertation has been published (Krstic et al. 2016, BMC Cancer). The experiments were conceived and designed by myself and a previous graduate student within the laboratory, Connor MacMillan, with input from my supervisors Dr. Alan Tuck and Dr. Ann Chambers. Connor and I performed the experiments, acquired, and interpreted the data. Specifically, Connor MacMillan, Hon Leong, Allen Clifford, and Lesley Souter were involved in generating the TBX3 expression vectors used for TBX3 overexpression studies, along with generation of lentiviral particles for TBX3 knockdown prior to me joining the lab. I performed the 3D Matrigel cultures, immunofluorescence, migration and invasion assays, and qRT-PCR experiments (including the arrays). David Dales and Carl Postenka conducted the immunohistochemistry of the 21T cell pellets. The manuscript was written by myself, Connor MacMillan, and Alan Tuck.
Chapter 3 in this dissertation is under review. The experiments were conceived and designed by myself, with input from my supervisors Dr. Alan Tuck and Dr. Ann Chambers. I performed the experiments, acquired, and interpreted the data with the help of my supervisors. Joseph Andrews conducted sequencing alignments for RNA-Seq and ChIP-array data, along with helping to generate gene lists for downstream analysis. Bart Kolendowski helped with bioinformatics analyses, including assessment of conserved T-box binding sites in theSLUG(SNAI2) gene, integration and analysis of ENCODE data, and integration of grade information for the TCGA BRCA cohort. Haider Hassan conducted a portion of the western blots in SLUG knockdown cell lines. Connor MacMillan aided in development of methodology for in vivo invadopodia formation assays. Karla Williams conducted in vitro invadopodia formation assays. Hon Leong provided us with CAM models. The manuscript was written by myself, with support from Alan Tuck, Bart Kolendowski, and Joseph Torchia.
Dedication
Ово је за моју породицу.
Не бих могла да завршим сав овај
напоран рад без моје мајке и оца.
Acknowledgements
I have learned so much over the past five years of my PhD journey, and have grown so much personally and scientifically. I know all of the skills that I have gained will be instrumental in my path forward, and my supervisors, Dr. Alan Tuck and Dr. Ann Chambers deserve a very big thank you for their support and encouragement in getting me here. Thank you for the hours spent proof-reading my applications and papers, the numerous one-on-one meetings, and providing valuable advice when I had difficulties. Thank you for always being available to help and advise me scientifically, but also giving me the freedom to explore on my own.
To my advisory committee members: Within the first few weeks of starting grad school, I asked Dr. Joe Mymryk to serve as one of my advisors. He has been extremely helpful right from the beginning, and was always available to speak with me whenever I needed help on any topic. To Dr. David Rodenhiser, a newer advisor – thank you for coming to my rescue towards the end of my PhD, and being there to oversee my completion. I’m thankful for both of your kind gestures, and especially for telling me to relax when I put together a paper with nearly 100 figure panels. I really needed that.
Thank you to the Department of Pathology, which I am very happy I chose to do my PhD work in. Every single staff and faculty member that I have come in contact with has been extremely knowledgeable and caring – particularly Tracey Koning, Dr. Zia Khan, and Dr. Chandan Chakraborty. You guys are all wonderful and your work does not go unnoticed.
My lab members, including David Dales, Carl Postenka, Joe Andrews, Pieter Anborgh, have been great as well. I’m glad that I made those outings with the “old man’s club”, where I could listen to Carl talk about more ridiculous things and always have a few laughs.
The friends that I’ve met throughout grad school have become some of my closest friends. In particular I would like to acknowledge Cecilia Kwok, Kate Cousteils and Amber Harnett. Thank you to my best friend since grade school, Tijana Lozo, who has been there for me from day one.
Table of Contents
Abstract ... i
Co-Authorship Statement ... iii
Dedication ... iv
Acknowledgements ... v
List of Abbreviations ... x
List of Tables ... xiv
List of Figures ... xiv
List of Appendices ... xv
1 Introduction ... xviii
1.1 Breast Cancer ... 1
Histopathology of breast cancer progression ... 2
Columnar cell lesions (CCLs) ... 5
Atypical ductal hyperplasia (ADH) ... 7
Ductal carcinoma in situ (DCIS) ... 9
Biomarkers for progression to invasive carcinoma ... 13
Experimental Models of Breast Cancer Progression ... 16
1.2 TBX3 ... 20
Mechanisms of transcriptional regulation by TBX3 ... 23
TBX3 in Cancer ... 25
TBX3 and Cellular Senescence – p14ARF / p53 / p21CIP1 Pathway ... 29
TBX3 and the TGF-ß Pathway ... 30
TBX3 and the FGF Pathway ... 31
TBX3 and the Wnt / ß-Catenin Pathway ... 32
TBX3 and the PTEN / PI3K / AKT Pathway ... 32
Regulation of TBX3 by miRNAs ... 33
1.3 Alternative Splicing in normal and neoplastic cells ... 34
Alternative Splicing of T-box genes ... 36
1.5 Angiogenesis ... 43
Osteopontin and Angiogenesis ... 44
Hyaluronan and Angiogenesis... 46
1.6 Summary of Objectives ... 48
1.7 References ... 50
Examination of functional and phenotypic changes associated with modulation of TBX3 levels at various stages of breast cancer progression ... 77
2.1 Introduction ... 78
2.2 Methods... 80
2.3 Results ... 86
TBX3iso1 and TBX3iso2 are differentially expressed in the 21T cell lines. ... 86
TBX3 expression is increased in DCIS-like 21NT cells after stable transfection. ... 88
TBX3 overexpression promotes progression of 21NT (DCIS) cells. ... 91
TBX3 knockdown reduces some characteristics of an aggressive phenotype in 21MT-1 (IMC) cells. ... 95
Up-regulation of TBX3 in 21NT (DCIS) cells results in alterations in expression of key regulatory and EMT/invasion associated genes. ... 98
2.4 Discussion ... 102
2.5 References ... 105
TBX3 promotes progression of pre-invasive breast cancer cells by inducing EMT and directly up-regulating SLUG ... 108
3.1 Introduction ... 109
3.2 Methods... 111
3.3 Results ... 126
TBX3 overexpression is associated with an invasive and EMT phenotype. ... 126
TBX3 overexpression leads to an alteration of mesenchymal transcript levels and direct up-regulation of SLUG. ... 130
SLUG up-regulation by TBX3 is essential for increased migration and invasion. ... 134
TBX3 expression is elevated in low-grade, hormone-receptor positive invasive breast cancers and associated precursor lesions. ... 136
3.4 Discussion ... 145
3.5 References ... 148
Isoform-specific promotion of breast cancer tumorigenicity by TBX3 involves induction of angiogenesis ... 153
4.1 Introduction ... 154
4.2 Methods... 156
4.3 Results ... 162
TBX3iso1 possesses enhanced tumorigenic potential in nude mice. ... 162
TBX3iso1 promotes angiogenesis in vivo and in vitro. ... 165
Osteopontin is specifically up-regulated by TBX3iso1. ... 168
TBX3iso1 overexpression leads to increased HAS2 levels and pericellular hyaluronan retention. ... 171
Cancer progression involves transcriptional changes resulting in an increase in the TBX3iso1/TBX3iso2 ratio. ... 173
4.4 Discussion ... 175
4.5 References ... 178
General Discussion ... 185
5.1 Promotion of invasiveness by TBX3 ... 187
5.2 Transcriptional targets of TBX3 – Cell Cycle Control ... 188
5.3 Transcriptional targets of TBX3 – EMT Regulation ... 191
5.4 TBX3 in precursor lesions – CCLs and DCIS ... 193
5.5 TBX3 in IDC ... 197
5.6 Future Studies ... 199
5.7 References ... 201
Appendices ... 210
6.1 Chapter 3 – Supplementary Data... 210
6.2 Chapter 3 – Immunohistochemistry Quality Control ... 216
List of Abbreviations
ADH atypical ductal hyperplasia AKT protein kinase B
ALH atypical lobular hyperplasia ANOVA analysis of variance
AR androgen receptor B-RAF B-Raf proto-oncogene BCL2 B-cell lymphoma 2
BRCA1 breast cancer 1, early onset BRCA2 breast cancer 2, early onset BSA bovine serum albumin CAM chorioallantoic membrane CCC columnar cell change CCH columnar cell hyperplasia CCL columnar cell lesion
CCLE Cancer Cell Line Encyclopedia (database) CCND1 cyclin D1
CCNE1 cyclin E1 CD
CD31
cluster of differentiation
CD31 antigen, platelet and endothelial cell adhesion molecule CD44 CD44 antigen, cell-surface glycoprotein
CDC25A cell division cycle 25 homolog A CDH1 E-cadherin
CDH2 N-cadherin
CDK cyclin dependent kinase
CDKN2A cyclin-dependent kinase inhibitor 2A (encodes p14ARF and p16INK4A)
CGH comparative genomic hybridization
ChIA-PET chromatin interaction analysis by paired-end tag sequencing ChIP chromatin immunoprecipitation
CK cytokeratin
CMFDA 5-chloromethylfluorescein diacetate (green fluorescent dye) COX cyclooxygenase
CSC cancer stem cell CST6 cystatin E/M
CTCF CCCTC-binding factor dbEMT EMT database
DCIS ductal carcinoma in situ
DHS DNase I hypersensitivity DNMT DNA methyltransferase DOC deoxycholic acid
dTTP deoxythymidine triphosphate dUTP deoxyuridine triphosphate E2F E2F transcription factor
ECL enhanced chemiluminescence ECM extracellular matrix
EDTA ethylenediaminetetraacetic acid EGFR epidermal growth factor receptor EGTA ethylene glycol tetraacetic acid ELISA enzyme-linked immunosorbent assay EMSA electromobility shift assay
ENCODE Encyclopedia of DNA Elements (database) ER estrogen receptor
EV empty vector
FBS fetal bovine serum FDR false discovery rate FEA flat epithelial atypia FGF fibroblast growth factor
FGFR fibroblast growth factor receptor FISH fluorescence in situ hybridization FN1 fibronectin 1
FOXA1 forkhead box protein A1 G418 Geneticin
GAPDH glyceraldehyde-3-phosphate dehydrogenase GATA GATA binding protein
GEO Gene Expression Omnibus (database) GJA1 gap junction protein alpha 1 (connexin 43)
GO gene ontology
GRO-Seq global run-on sequencing GST glutathione S-transferase
GTEx Genotype Tissue Expression (database) H&E hematoxylin and eosin histological stains
H2A histone 2A
HA hyaluronan
HAS2 hyaluronan synthase 2 HAse hyaluronidase
HCC hepatocellular carcinoma HDAC histone deacetylase
HDMEC human dermal microvascular endothelial cells HEPES 4-(2-hydroxyethyl)-1-piperazineethanesulfonic acid
HER2 human epidermal growth factor receptor 2
HG high grade
HIF1α hypoxia-inducible factor 1 alpha
HNSCC head and neck squamous cell carcinoma HPA Human Protein Atlas (database)
HPF high power field
HRAS H-Ras proto-oncogene
hrOPN human recombinant osteopontin HRP horseradish peroxidase
ICGC International Cancer Genome Consortium (database) IDC invasive ductal carcinoma
IG intermediate grade IgG immunoglobulin G
IGV Interactive Gene Viewer (software) IHC immunohistochemistry
IL1RN interleukin 1 receptor antagonist IL6 Interleukin 6
IV intravenous
JDP2 jun dimerization protein 2
JUN jun proto-oncogene, AP-1 transcription factor subunit KRT8 keratin 8, type II
LCIS lobular carcinoma in situ
LEF1 lymphoid enhancer binding factor 1
LG low grade
LN lymph node
LOH loss of heterozygosity LUC luciferase
MALDI-TOF-MS matrix assisted laser desorption/ionization time of flight mass spectrometry MAPK mitogen-activated protein kinase
MDM2 mouse double minute 2 proto-oncogene MET mesenchymal-epithelial transition MKI67 marker of proliferation Ki67
MLH1 MutL homolog 1, colon cancer, nonpolyposis type 2 MMP matrix metallopeptidase
MMTV mouse mammary tumor virus
MYC MYC proto-oncogene, BHLH transcription factor Nanog homeobox transcription factor Nanog
NBF neutral buffered formalin Nkx2-5 NK2 homeobox 5
NFKB nuclear factor kappa light chain enhancer of activated B cells
NLS nuclear localization sequence NMD nonsense-mediated mRNA decay
NOD/SCID non-obese diabetic severe combined immunodeficiency Nppa natriuretic peptide A
NR3C1 nuclear receptor subfamily 3, group C, member 1 glucocorticoid receptor NSCLC non-small-cell lung cancer
OPN osteopontin
p14ARF p14 alternative reading frame tumor suppressor
p16INK4A p16 inhibitor of cyclin-dependent kinase 4 tumor suppressor
p21CIP1 p21 cyclin dependent kinase inhibitor protein 1
p53 p53 tumor suppressor protein p63 p63 tumor protein
PBS phosphate-buffered saline PCA principal component analysis PDB Protein Data Bank (database) PDGF platelet derived growth factor PGS Partek Genomic Suites (software) PI3K phosphoinositide 3-kinase
PIK3CA phosphatidylinositol-3-kinase catalytic subunit alpha PKC protein kinase C
PLAU plasminogen activator, urokinase (uPa) PLCε phospholipase C epsilon
Pol II RNA polymerase II POLR2A RNA polymerase II A PR progesterone receptor
PRDM2 PR domain zinc finger protein 2 PTEN phosphatase and tensin homolog PVDF polyvinylidene difluoride
Ras Ras proto-oncogene, GTPase Rb retinoblastoma
RGD arginine-glycine-aspartate integrin binding domain RHAMM receptor for hyaluronan-mediated motility
RIPA radioimmunoprecipitation assay buffer
RPKM reads per kilobase of transcript per million mapped reads RPLP0 ribosomal protein lateral stalk subunit P0
RTK receptor tyrosine kinase SBR Scarff-Bloom-Richardson SCC squamous cell carcinoma SCR scramble (control)
SDS-PAGE sodium dodecyl sulfate polyacrylamide gel electrophoresis SERPINE1 serpin peptidase inhibitor, clade E, member 1
SFN stratifin
shRNA short hairpin RNA
SLUG Snail family transcriptional repressor 2
SMAD suppressor of mothers against decapentaplegic
SNAI1 snail family transcriptional repressor 1 (encodes SNAIL protein) SNAI2 snail family transcriptional repressor 2 (encodes SLUG protein) SPP1 secreted phosphoprotein 1 (encodes OPN protein)
SRC Src proto-oncogene TBE T-box element TBS tris-buffered saline
TBX T-box
TBX3 T-box 3, with two isoforms: TBX3iso1 and TBX3iso2 TCF T-cell specific transcription factor
TCGA The Cancer Genome Atlas (database) TDLU terminal duct lobular units
TET2 ten-eleven translocase methylcytosine dioxygenase 2 TGF-ß transforming growth factor beta
TNM staging system; T = tumor size, N = positive lymph nodes, M = metastasis TSS transcription start site
TWIST1 twist family BHLH transcription factor 1 UMS ulnar-mammary syndrome
UTR untranslated region
VEGF vascular endothelial growth factor
VEGFR vascular endothelial growth factor receptor
VIM vimentin
Wnt wingless/integrated
List of Tables
Table 3.1 – Primer sequences utilized for qRT-PCR in mRNA studies. ... 119
Table 3.2 – Primer sequences utilized for ChIP-qPCR validation studies. ... 121
Table 3.3 – Publicly-available datasets utilized for analysis. ... 123
Table 3.4 – Clinicopathologic variables for patients entered into this study. ... 138
Table 4.1 – Primer sequences utilized for qRT-PCR in mRNA studies. ... 157
List of Figures
CHAPTER 1 – Introduction
Figure 1.1.1 – Histology of normal breast epithelium. ... 2
Figure 1.1.2 – Detailed breast cancer progression pathway of LG and HG breast cancers. ... 4
Figure 1.1.3 – Columnar cell lesions (CCLs) of the breast. ... 5
Figure 1.1.4 – Atypical ductal hyperplasia (ADH) of the breast. ... 7
Figure 1.1.5 – Ductal carcinoma in situ (DCIS) of the breast. ... 9
Figure 1.1.6 – Characteristic growth patterns of 21T cell lines in 2D, 3D, and in mouse xenografts. ... 19
Figure 1.2.1 – Full-length TBX3 protein structure. Adapted from Willmer et al., 2017. ... 21
Figure 1.2.2 – TBX3 mRNA expression by tissue type. ... 22
Figure 1.2.3 – TBX3 mRNA expression by cancer type. ... 26
Figure 1.2.4 – Cancer-related TBX3 signaling pathways. ... 28
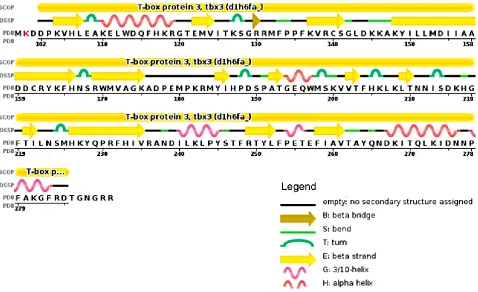
Figure 1.3.1 – TBX3 Protein Sequence Secondary Structure. ... 38
Figure 1.5.1 – OPN protein structure and interactions. ... 45
CHAPTER 2 – Examination of functional and phenotypic changes associated with modulation of TBX3 levels at various stages of breast cancer progression Figure 2.3.1 – TBX3iso1 and TBX3iso2 are differentially expressed in the 21T cell lines. ... 87
Figure 2.3.2 – TBX3 expression is increased in 21NT cell transfectants. ... 90
Figure 2.3.3 – TBX3 overexpression in DCIS-like 21NT cells results in a more aggressive phenotype in 3D Matrigel. ... 93
Figure 2.3.4 – TBX3 overexpression increases migration and invasion of 21NT cells. ... 94
Figure 2.3.5 – TBX3 knockdown results in a less aggressive phenotype of IMC-like 21MT-1 cells in 3D Matrigel. ... 97
CHAPTER 3 – TBX3 promotes progression of pre-invasive breast cancer cells by
inducing EMT and directly up-regulating SLUG
Figure 3.3.1 – TBX3 overexpression is associated with an invasive and EMT phenotype. ... 128
Figure 3.3.2 – TBX3 overexpression leads to an alteration of mesenchymal transcript levels
and direct up-regulation of SLUG. ... 133
Figure 3.3.3 – SLUG up-regulation by TBX3 is essential for increased migration and invasion. ... 135
Figure 3.3.4 – TBX3 expression is elevated in low-grade, hormone-receptor positive invasive
breast cancers and associated precursor lesions. ... 140
Figure 3.3.5 – Elevated TBX3 levels are associated with poor prognosis of breast cancer,
and are highly correlated with SLUG expression. ... 143
Figure 3.3.6 – TBX3 promotes progression of pre-invasive breast cancer cells by inducing
EMT and directly up-regulating SLUG. ... 144
CHAPTER 4 – Isoform-specific promotion of breast cancer tumorigenicity by TBX3
involves induction of angiogenesis
Figure 4.3.1 – TBX3iso1 possess enhanced tumorigenic potential in nude mice. ... 164
Figure 4.3.2 – TBX3iso1 promotes angiogenesis in vitro and in vivo. ... 167
Figure 4.3.3 – Osteopontin is specifically up-regulated by TBX3iso1. ... 170
Figure 4.3.4 – TBX3iso1 overexpression leads to increased HAS2 levels and pericellular
hyaluronan retention. ... 172
Figure 4.3.5 – Cancer progression involves transcriptional changes resulting in an increase
in TBX3iso1 to TBX3iso2 ratio. ... 174
CHAPTER 5 – General Discussion
List of Appendices
Appendix 1 – TBX3 protein expression in 21NT transfectant and 21MT-1 transductant cell lines. ... 210
Appendix 2 – Phenotypic assessment of TBX3 overexpressing cell lines. ... 212
Appendix 3 - Effect of TBX3 overexpression on invasiveness in cell lines representing other breast cancer molecular subtypes. ... 213
Appendix 4 – Assessment of EMT markers in TBX3 overexpressing cell lines. ... 214
Appendix 5 – Protein class analysis of direct transcriptional targets of TBX3. ... 215
Appendix 6 – TBX3 expression in nuclear and cytoplasmic fractions of 21T cells. ... 219
Appendix 7 – ImmunoRatio analysis of TBX3 expression in benign and columnar breast epithelium. 221 Appendix 8 – ImmunoRatio analysis of TBX3 expression in DCIS and IDC. ... 223
Appendix 9 – Quality control of TBX3 staining by immunohistochemistry. ... 225
Appendix 10 – Expression of VEGFR2 by qRT-PCR. ... 226
Appendix 11 – TBX3 expression in stable transfectant cell lines. ... 227
Chapter 1
1.1
Breast Cancer
Recent statistics from the Canadian Cancer Society has revealed that 1 in 2 Canadians will develop cancer in their lifetime, and 1 in 4 Canadians will die of cancer (Canadian Cancer Society, 2017). Leading the list of cancer prevalence for Canadian women is breast cancer, with 1 in 8 women expected to develop breast cancer in their lifetime (Canadian Cancer Society, 2017). This accounted for 10,100 diagnoses of breast cancer in 2017, of which 1,900 succumbed to the disease (Canadian Cancer Society, 2017). While breast cancer incidence rates rose in the 1990s (likely due to increased opportunistic mammography screenings), mortality rates have been declining at a rate of approximately 2.3% per year between 1992 and 2012 (Canadian Cancer Society, 2017). This decline is likely due to a combination of screening mammograms and more effective adjuvant systemic therapies (Canadian Cancer Society, 2017). Similar reductions in mortality rates have been observed in the United States, United Kingdom, and Australia (Bray et al., 2004).
The current public health strategy for breast cancer is one of early detection; at this early stage, treatment generally has a high success rate compared to metastatic diagnosis. In addition to surgical management, treatment for patients with early-stage breast cancer can include systemic therapy, such as chemotherapy (i.e. taxanes, anthracyclines) and/or hormone therapy (i.e. tamoxifen, aromatase inhibitors), which are tailored to the characteristics of the tumour (Esteva and Hortobagyi, 2004). Once the cancer has spread to distant organs, however, survival is greatly reduced.
Histopathology of breast cancer progression
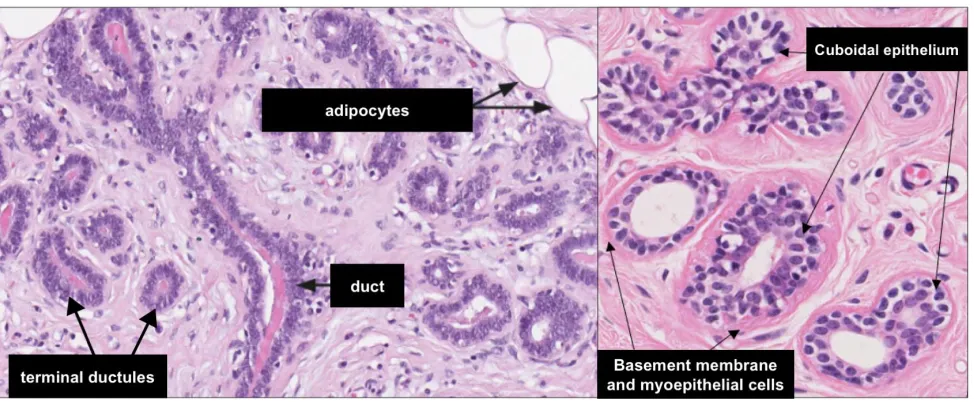
Figure 1.1.1 – Histology of normal breast epithelium.
Obtained from breast histology slides in The Human Protein Atlas, available at
www.proteinatlas.org/learn/dictionary/normal/breast
Normal breast histology (depicted in Figure 1.1.1) must be appreciated in order to diagnose pathological conditions. Histologically, the breast is made up of several ductal-lobular structures. The lactiferous duct is located beneath the nipple, and branches out into several progressively smaller ductal structures, eventually terminating at the terminal ductules and lobules (Mills, 2007). The epithelium within these ductal-lobular structures consists of two distinct cell layers. The inner (luminal) layer is composed of cuboidal to columnar epithelial cells, with an outer (basal) layer composed of flattened myoepithelial cells (Mills, 2007). The terminal ducts and their corresponding lobules are collectively referred to as the terminal duct lobular unit (TDLU), and represents the structural and functional unit of the breast (Mills, 2007). A layer of type IV collagen and laminin surrounds the ductal-lobular structures, separating them from the surrounding stroma (Mills, 2007). The stroma immediately adjacent to the mammary glands is composed of loose fibrovascular tissue, with dense interlobular stroma composed of collagen, fibroblasts, and adipose tissue surrounding the aforementioned structures (Mills, 2007).
The two most common histological subtypes of invasive breast cancer include infiltrating ductal carcinoma (IDC) and infiltrating lobular carcinoma (ILC). While both arise from the TDLUs, they present quite different histologically (Wellings and Jensen, 1973, Wellings et al., 1975). A majority of breast cancers have the morphology of ductal epithelial cells (DCIS, IDC), representing approximately 80% of diagnoses (Kumar et al., 2013). Lobular morphologies, including atypical lobular hyperplasia (ALH), lobular carcinoma in situ (LCIS), and invasive lobular carcinoma (ILC), are less common than their ductal counterparts (Kumar et al., 2013). The more common pathways, related to IDC, are discussed below.
The IDC breast cancer progression model is often simplified into a series of phenotypic histological stages, beginning with benign epithelial cells and sometimes transitioning to columnar cell lesions including flat epithelial atypia (FEA), atypical ductal hyperplasia (ADH), ductal carcinoma in situ (DCIS), and ultimately invasive and metastatic breast carcinoma (Burstein et al., 2004, Bombonati and Sgroi, 2011). FEA, ADH and DCIS are considered to be non-obligate precursors for the development of invasive breast cancer, meaning that not all cases exhibiting the aforementioned precursor lesions will progress to invasive carcinoma (Bombonati and Sgroi, 2011). Epidemiological, histological, immunohistochemical, loss of heterozygosity (LOH), comparative genomic hybridization (CGH), and later high-throughput mutational studies have shed light on the intricacies of this process, and highlighted the presence of divergent low-grade and high-grade pathways (Thorat et al., 2007, Formenti et al., 2011, Bombonati and Sgroi, 2011, Sagara et al., 2015).
These findings suggest that high-grade breast cancers (basal-like and HER2-enriched) do not arise from low-grade breast cancers (Bombonati and Sgroi, 2011).
Immunohistochemical studies of FEA, ADH and LG DCIS has revealed high expression levels of estrogen receptor (ER) and progesterone receptor (PR), along with lack of HER2 expression (Buerger et al., 2001). Additionally, these precursor lesions frequently express high levels of the proliferation marker Ki67, luminal cytokeratins CK8/18/19, B-cell lymphoma 2 (Bcl2), cyclin D1, and are negative for basal cytokeratins CK5/6 (Schnitt, 2003, Abdel-Fatah et al., 2008, Ahmad, 2013). Genetic analysis of FEA, ADH and LG DCIS has revealed comparable loss of 16q, which is an early hallmark genetic change in LG lesions; the degree of genomic instability, however, increases with further progression (O'Connell et al., 1998, Moinfar et al., 2000, Simpson et al., 2005, Larson et al., 2006, Gao et al., 2009). Genes which may function as tumor suppressors that are subsequently lost with 16q deletions have been assessed, and include E-cadherin (CDH1) and CCCTC-binding factor (CTCF), with reduced expression reported in LG lesions, as assayed by PCR and immunohistochemistry (Bürger et al., 2013). The detailed breast cancer progression pathways of the LG and HG molecular pathways is depicted in Figure 1.1.2.
Figure 1.1.2 –Detailed breast cancer progression pathway of LG and HG breast cancers.
Columnar cell lesions (CCLs)
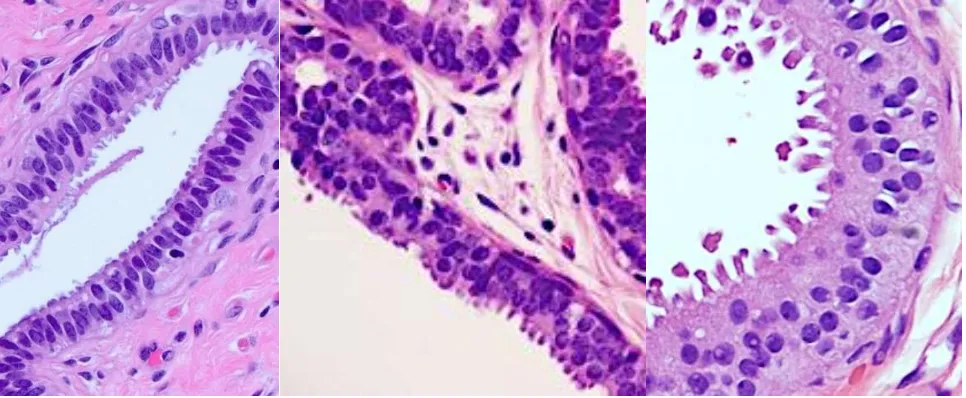
Figure 1.1.3 – Columnar cell lesions (CCLs) of the breast.
Columnar cell change (CCC), columnar cell hyperplasia (CCH), and flat epithelial atypia
(FEA) of the breast (left to right).
Columnar cell lesions (CCLs) are among the most common abnormalities observed in breast biopsies (Turashvili et al., 2008). CCLs are generally divided into columnar cell change (CCC) and columnar cell hyperplasia (CCH), consisting of one or several layers of pseudostratified ductal epithelial cells, respectively, which have taken on a columnar phenotype (depicted in Figure 1.1.3) (Dabbs et al., 2006). CCLs present with frequent exaggerated apical blebs or snouts, often resulting in intraluminal secretions that can calcify, and are thus often detected as abnormalities on mammographic screening (Lerwill, 2008). CCC and CCH with the aforementioned histological patterns can be further subdivided, depending on the presence or absence of atypia (Turashvili et al., 2008, Go et al., 2012).
2008). Interestingly, CCLs with HG atypia tend to progress to comedo DCIS (associated with necrosis and higher rates of invasive recurrence), whereas FEA with LG cytologic atypia is thought to progress to LG DCIS (Azzopardi et al., 1979), further providing evidence for the divergent LG and HG progression pathways. Additionally, CCLs were reported to coexist in 76% of LG and 10% of HG breast cancers (Abdel-Fatah et al., 2008). Coexisting CCLs, ADH and DCIS lesions often exhibit near identical cytological morphologies, with the differences typically being size and architecture-related (Go et al., 2012).
Atypical ductal hyperplasia (ADH)
Figure 1.1.4 – Atypical ductal hyperplasia (ADH) of the breast.
1992, Ahmad, 2013). Additionally, ADH is usually small and focal, measuring less than 2 mm; if larger and more extensive, a diagnosis of DCIS is typically made (Pinder and Ellis, 2003). LOH and CGH-based studies of ADH have revealed frequent loss of the 16q chromosomal region (Lakhani et al., 1995, O'Connell et al., 1998, Amari et al., 1999). Additionally, microsatellite analysis has revealed that 60% of IDC and DCIS showed concurrent ADH that was clonal in origin (Larson et al., 2006), with copy number alterations and documented at early stages of ADH (Crissman et al., 1990, Eriksson et al., 1992, Stomper et al., 1992, Ruiz et al., 1999, Niu et al., 2013, Kader et al., 2018).
Marked transcriptional changes have been identified at the ADH stage relative to adjacent benign ductal epithelium (Ma et al., 2003), including up-regulation of several oncogenes such as FOXA1 and GATA3 (Brunner et al., 2014). Several studies have therefore proposed that alteration in expression of genes at the early stages of progression, including ADH and DCIS, may be critical for progression to invasive breast cancer, as expression of several transcripts is maintained throughout progression (van de Vijver et al., 2002, Paik et al., 2004). In fact, transcriptional studies have shown that ADH and LG DCIS possess near-identical gene expression profiles (Bombonati and Sgroi, 2011).
Ductal carcinoma in situ (DCIS)
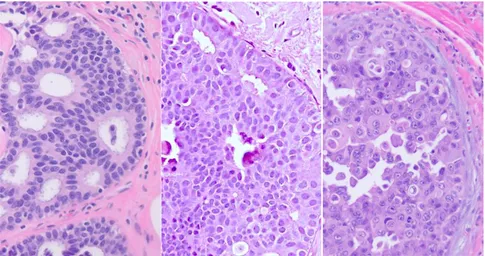
Figure 1.1.5 – Ductal carcinoma in situ (DCIS) of the breast.
Low-grade DCIS, intermediate-grade DCIS, and high-grade DCIS (left to right); all neoplastic
cells of the DCIS are confined to the duct and possess an intact basement membrane.
1.1.4.1
Histopathology of DCIS
larger than those of adjacent normal epithelial cells (Figure 1.1.5, left panel) (Pinder and Ellis, 2003). HG DCIS is associated with an increase in the nuclei to cytoplasm ratio, coarse chromatin, prominent nucleoli, loss of polarization, frequent mitoses, and pleomorphism from cell to cell (Figure 1.1.5, right panel) (Lester et al., 2009). The architecture is variable (i.e. solid, cribriform, micropapillary, and/or papillary), although solid is frequently observed, often with central zone necrosis which may undergo calcification (Pinder and Ellis, 2003). The diagnosis of IG DCIS is quite subjective, and is made if nuclear pleomorphism exhibits an intermediate between LG and HG DCIS with some degree of polarization (Pinder and Ellis, 2003). On this note, a recent study using integrative bioinformatic analysis of the Cancer Genome Atlas (TCGA) breast cancer cohort reported that patients with IG IDC could be re-classified into LG-like and HG-like IDC based on a 22 gene tumor aggressiveness classifier (Aswad et al., 2015), suggesting that this subgroup consists of both LG and HG lesions (Bombonati and Sgroi, 2011).
1.1.4.2
Clinical Management of DCIS
It is estimated that 25-50% of DCIS (depending on the DCIS characteristics) will progress to invasive carcinoma during the lifetime of the patient, generating potentially life-threatening disease (Page and Dupont, 1993, Fitzgibbons et al., 1998, Sanders et al., 2005, Ahmad, 2013, Sagara et al., 2015). Local recurrence rates for patients with DCIS are 5-25% with lumpectomy (Fisher et al., 1993, Warneke et al., 1995, Ernster et al., 1996, Fowble et al., 1997, Habel et al., 1998, Boyages et al., 1999, Hetelekidis et al., 1999), and 1-2% for mastectomy in the absence of radiation therapy (Silverstein et al., 1995a, Warneke et al., 1995, Boyages et al., 1999). This risk of non-invasive or invasive recurrence further depends on characteristics of the DCIS, including the nuclear grade, extent and presence or absence of necrosis.
The natural history of DCIS is for the most part unknown since routine treatment includes surgical excision (Bartlett et al., 2014). Prior to the 1980s, most patients with DCIS underwent a mastectomy (Waldman et al., 2000). Such radical surgical practices have been replaced by breast-conserving surgery (lumpectomy), often combined with radiation therapy, regardless of grade (Waldman et al., 2000, Mokbel and Cutuli, 2006). The higher rates of local recurrence for DCIS patients treated with lumpectomy suggest that the recurrent DCIS arises from residual tumor cells missed by surgery (Waldman et al., 2000). Work by Waldman et al. reported that recurrent DCIS lesions exhibited the same histologic architecture as the initial DCIS, and CGH analysis revealed that the initial and recurrent DCIS were clonally related (Waldman et al., 2000).
They noted that the risk of invasive recurrence is greatest within the first fifteen years after diagnosis (Sanders et al., 2005). Omission of surgical excision for patients with LG DCIS therefore leaves a percentage of women at risk for recurrence.
Randomized control trials have concluded that the addition of radiation therapy to lumpectomy reduces recurrence rates for early breast cancers by approximately 50%, similar to that of mastectomy (Fisher et al., 1998, Bijker et al., 2001, Fisher et al., 2001, Fisher et al., 2002, Bijker et al., 2006, Holmberg et al., 2008, Correa et al., 2010, Cuzick et al., 2011, Wapnir et al., 2011). Clinical records, however, show that only half of women treated by lumpectomy receive radiation therapy (Baxter et al., 2004, Jackson et al., 2008, Hughes et al., 2009). Several studies have also reported that approximately 30% of patients do not receive any significant benefit from radiation therapy (Lagios et al., 1989, Schwartz et al., 1992, Zafrani et al., 1994, Silverstein et al., 1995b, Silverstein et al., 1996).
Biomarkers for progression to invasive carcinoma
Breast cancers are now being diagnosed earlier, but this lead-time has not resulted in significant reductions in diagnosis of invasive carcinoma after DCIS (Kerlikowske, 2010, Miller et al., 2014). While up to 50% of DCIS lesions are expected to progress to IDC in the lifetime of the patient (Sagara et al., 2015), there is a high degree of variability in terms of latency (Muggerud et al., 2010). Indeed, some patients with DCIS progress to invasion quickly, while others remains relatively unchanged over 20 years (Porter et al., 2003, Schuetz et al., 2006). Previous studies have reported that traditional clinical and pathologic criteria are not sufficient to consistently and accurately define DCIS risk groups (Porter et al., 2003, Solin et al., 2013, Rakovitch et al., 2015). Conventional markers which are routinely assessed by immunohistochemistry in invasive breast cancers (ER, PR) are also of limited value in DCIS (Bartlett et al., 2014). The lack of reliable markers for risk stratification of patients diagnosed with DCIS results in identical treatment for almost all patients (Bartlett et al., 2014). There is therefore a pressing need for the development of novel diagnostic approaches for risk stratifications of patients with DCIS in order to optimize treatment strategies.
al., 2015). These findings are consistent with early LOH and CGH-based studies showing that similar genetic abnormalities associated with DCIS and IDC are already present at the ADH stage (Zhuang et al., 1995, Deng et al., 1996, O'Connell et al., 1998, Allred et al., 2001).
Van’t Veer et al. established a poor-prognosis signature associated with a 28-fold increased risk for the development of metastasis over a 5-year period (van 't Veer et al., 2002). Based on their 70-gene approach, they concluded that even small primary tumors displaying a poor prognosis signature are already programmed for a metastatic phenotype (van 't Veer et al., 2002). Taken together, these studies suggest that since DCIS and IDC possess very similar transcriptional profiles, and a poor prognosis signature can be established from the primary IDC, the same may hold true for DCIS.
The assessment of biomarkers for DCIS is still in its infancy. As highlighted by Bartlett et al., 60 DCIS biomarker studies were published during the 2004-2014 period, with 90% of the published studies regarded as statistically under-powered (Bartlett et al., 2014). Additionally, several of these studies remain un-validated (Bartlett et al., 2014).
One DCIS biomarker that has been validated by several groups, however, is HER2 expression (as assessed by immunohistochemistry (IHC) and fluorescence in situ hybridization (FISH)). High HER2 expression in DCIS is associated with non-invasive recurrence (Provenzano et al., 2003, Kepple et al., 2006, Nofech-Mozes et al., 2008, Holmes et al., 2011, Ringberg et al., 2001, Han et al., 2012). Additionally, joint assessment of HER2 and Ki67 expression in DCIS was associated with a 3.22-fold increased risk of non-invasive recurrence (Rakovitch et al., 2012). Kerlikowske et al. reported that patients with DCIS which are ER- and HER2+ with high expression of Ki67 possess the greatest risk (Kerlikowske et al., 2010). The conclusions regarding HER2 expression and invasive recurrence post-lumpectomy are variable. This discrepancy was discussed by Kerlikowske et al. and Rakovitch et al., where they suggested this outcome was dependent on subtype (Kerlikowske et al., 2010, Rakovitch et al., 2012, Bartlett et al., 2014).
proliferation marker Ki67 is indicative of a normal stress response, and protective against progression of DCIS (Gauthier et al., 2007). High p16, and COX2 with elevated Ki67 expression, however, is associated with a 2-fold higher rate of invasive recurrence (Gauthier et al., 2007, Kerlikowske et al., 2010).
Experimental Models of Breast Cancer Progression
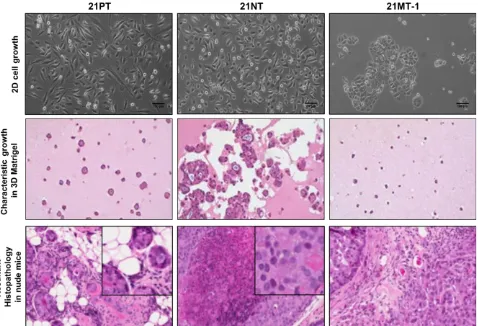
The development of breast cancer is a multi-step process, and our understanding of the underlying molecular events has been hindered due to a lack of suitable models of progression (Liu et al., 1994). Previous studies have demonstrated that mouse-derived pre-malignant lesions are histologically different from those of humans, particularly in transgenic mouse models where the cellular origin of hyperplastic lesions is more often associated with the promoter rather than the transgenes used (Cardiff et al., 2000). The standard method used to determine malignant potential of cells within precursor lesions is transplantation (Cardiff et al., 2000). As described by Cardiff et al., this is similar to “Koch’s Postulates” of tumor biology, including “identification [of cells representing the precursor stage], isolation, transplantation and characterization” (Cardiff et al., 2000). Most human cells lines representing pre-malignant stages do not form any discernible histologic lesions in nude mice, and the majority of existing cell lines used for xenograft assays are of metastatic origin (Band et al., 1990, Miller, 2000). Importantly, only the 21T, HMT-3522, and MCF10AT breast epithelial cell line series have been reported to recapitulate the various histological characteristics of human breast carcinoma within a xenograft model (Santner et al., 2001, Rizki et al., 2008, Souter et al., 2010).
The HMT-3522 human breast epithelial cell lines were derived from a reduction mammoplasty, with the S1 cells isolated from a sample with fibrocystic breast disease (Madsen et al., 1992, Rizki et al., 2008). The S2, S3(A-B) and T4-2 cell lines were established through sub-culturing of cells (in 2D or 3D Matrigel), isolation of colonies with distinct phenotypes characteristic of aggressiveness, along with inoculation of cells into mice and passaging of xenograft cells for T4-2 cells (Madsen et al., 1992, Rizki et al., 2008). The cells represent a model of spontaneous transition and exhibit differential growth patterns and phenotypes in 3D Matrigel, along with varying tumorigenicity in nude mouse xenograft assays (Rizki et al., 2008). The S3 cell lines represent the pre-invasive stage of the human breast cancer progression series, but give rise to a metaplastic phenotype (Rizki et al., 2008). Human metaplastic breast cancers are rare, but also extremely aggressive, sharing similar clinical behavior and markers with basal-like breast carcinomas (Kenny et al., 2007, Rizki et al., 2008).
tumorigenic MCF10AT cell line variants are ER and PR positive, and possess wildtype p53 (Shekhar et al., 1998, Miller, 2000, Hevir et al., 2011).
Figure 1.1.6– Characteristic growth patterns of 21T cell lines in 2D, 3D, and in mouse
xenografts.
1.2
TBX3
TBX3 is a member of the highly conserved family of T-box transcription factors. The 18 T-box genes within mammals are believed to have evolved from tandem duplication of a primordial gene, followed by cluster dispersion (Agulnik et al., 1996, DeBenedittis and Jiao, 2011). Several of the T-box genes are expressed throughout development, with tight temporal and spatial regulation (DeBenedittis and Jiao, 2011). The identification of T-box family members generally occurred through experiments designed to identify genes involved in embryonic development, with lack of expression resulting in developmental defects (Bollag et al., 1994, Bamshad et al., 1999).
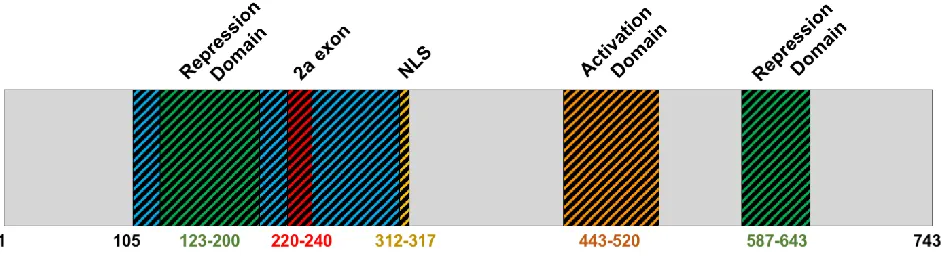
Figure 1.2.1 – Full-length TBX3 protein structure. Adapted from Willmer et al., 2017.
The full-length TBX3 protein is 743 residues in length, containing the T-box domain (residues 105-305), nuclear localization sequence (NLS; residues 312-317), activation domain (residues 443-520) and repression domains (residues 123-200, 587-643) (Smith, 1999, Carlson et al., 2001, Papaioannou, 2001, Willmer et al., 2017) (Figure 1.2.1). Two TBX3 isoforms exist through alternative splicing: TBX3iso1 and TBX3iso2 (which contains the 2a exon). TBX3 isoforms are described in Section 2.3.1.
All T-box transcription factors possess the highly conserved DNA binding domain known as the T-box domain which shares no sequence similarity to other known DNA binding motifs (Wilson and Conlon, 2002). Most of the described T-box domains are approximately 180 amino acids in length (Coll et al., 2002). T-box transcription factors bind to DNA sequences containing the box element (TBE) (Wilson and Conlon, 2002). To date, all T-box transcription factors examined are able to bind to the TBE consisting of bases TCACACCT (Wilson and Conlon, 2002). Coll et al. have proposed a less stringent consensus sequence (5’-xTxxCACxx’-3’; x signifies a less conserved base) for identification of new T-box binding sites (Coll et al., 2002).
et al., 2010). While TBX2 and TBX3 exhibit overlapping and complementary expression patterns in the developing mouse embryo, they were found to have non-redundant roles in developmental processes (Rowley et al., 2004).
TBX3 possesses both activation and repression domains. Most of the existing cancer-related literature focuses on transcriptional repression of target genes by TBX3, while transcriptional activation of target genes has been further characterized in heart development (Boogerd et al., 2011, Lu et al., 2011). The effect of TBX3 on transcription likely depends on interacting partners and target genes (Willmer et al., 2017). Several domains which facilitate protein-protein interaction likely reside outside of the T-box domain, since this area has undergone rapid diversification between T-box genes (Bamshad et al., 1999, Coll et al., 2002). The effect of TBX3 on transcription of downstream target genes as they relate to the process of tumorigenesis is discussed in the next section.
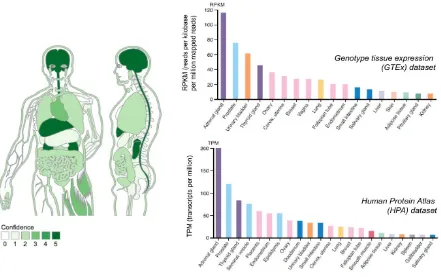
Figure 1.2.2 – TBX3 mRNA expression by tissue type.
Graphical representation of TBX3 mRNA expression across tissue types was obtained from
Jensen TISSUES database (tissues.jensenlab.org), depicting Genotype Tissue Expression
(GTEx) dataset (histogram plot on upper right). TBX3 mRNA expression in normal tissue is also
Mechanisms of transcriptional regulation by TBX3
TBX3 is able to bind several target genes through recognition of the conserved TBE sequence by the DNA binding domain (Wilson and Conlon, 2002). X-ray crystallography studies of TBX3 and Brachyury indicate that there are only two specific contacts within the DNA binding domain per TBE (Müller and Herrmann, 1997, Coll et al., 2002). The binding of TBX3 to the phosphatase and tensin homolog (PTEN) promoter, however, occurs in the absence of a TBE sequence (Burgucu et al., 2012), thereby suggesting that the binding of TBX3 to target sites is likely dependent on: i) DNA specificity and binding to a conserved TBE, ii) interaction with specific DNA binding proteins, iii) interaction with chromatin determinants (Lingbeek et al., 2002, Rodriguez et al., 2008). TBX3 is able to interact with chromatin, and directly binds to histone H2A (Kumar P et al., 2014b), histone deacetylases (HDACs), and DNA methyltransferases (DNMTs) (Yarosh et al., 2008, Dan et al., 2013), leading to transcriptional up-regulation or down-regulation of target genes. Additionally, TBX2, TBX4, TBX5 and TBX6 are able to bind to histone H3 N-terminal tails (Demay et al., 2007), the primary location of histone post-translational modifications (Mersfelder and Parthun, 2006).
Acetylation of histones is associated with active chromatin (Lewin et al., 2011). Histone deacetylases (HDACs) are involved in the removal of acetyl groups from histones, which results in tighter histone-DNA interactions and reduced levels of transcription (Yarosh et al., 2008). As HDACs do not contain a DNA binding domain, they are recruited by DNA-binding transcription factors (Cress and Seto, 2000). TBX3 is able to recruit and directly interact with histone deacetylases (HDACs) in order to epigenetically silence gene promoters (Willmer et al., 2017). This includes direct interaction with HDAC1, HDAC2, HDAC3, and HDAC5 to transcriptionally repress p14ARF in MCF7 cells (Yarosh et al., 2008). HDACs are
administration of HDAC inhibitor was able to block TBX3-induced repression of E-cadherin and TBX3-induced migration in HCC cell lines (Dong et al., 2018).
DNA methylation is associated with transcriptionally inactive DNA (Lewin et al., 2011). ChIP-Seq analysis revealed that TBX3 binds upstream of the DNA methyltransferases DNMT3A and DNMT3B genes, leading to their transcriptional repression (Han et al., 2010). TBX3 overexpression results in a reduction in the global DNA methylation levels, likely through down-regulation of DNMT3B (involved in DNA methylation) and up-regulation of TET2 (involved in DNA de-methylation) (Dan et al., 2013).
TBX3 in Cancer
TBX3 levels are up-regulated in several cancers, including breast (Fan et al., 2004, Lomnytska et al., 2006, Yarosh et al., 2008, Souter et al., 2010), melanoma (Rodriguez et al., 2008), pancreatic (Hansel et al., 2004, Cavard et al., 2009, Begum and Papaioannou, 2011), cervical (Lyng et al., 2006), ovarian (Lomnytska et al., 2006), gastric (Miao et al., 2016), and prostate cancers (Gudmundsson et al., 2010, Witte, 2010). TBX3 expression levels in normal tissues, tumor tissues, and plasma samples have been assessed in several studies described below, using methods ranging from IHC, microarray analysis, qRT-PCR, western blot, and 2D gel electrophoresis coupled to mass spectrometry.
TBX3 PROTEIN IN CANCERS – Assessment of TBX3 expression in pancreatic cancer by IHC revealed that elevated TBX3 expression within tumor samples was an independent prognostic factor for reduced overall survival (Wang et al., 2015). In gastric cancers, elevated TBX3 expression by IHC was significantly associated with advanced TNM (tumor, node, metastasis) stage and higher incidence of relapse (Miao et al., 2016). In colorectal cancer, elevated TBX3 expression by IHC was an independent predictor of poor outcome, and was correlated with tumor size, differentiation, TNM stage and lymph node metastasis (Shan et al., 2015).
Lomnytska et al. assessed differential protein expression within plasma samples of breast and ovarian cancer patients through the use of 2D gel electrophoresis coupled to matrix-assisted laser desorption/ionization time of flight mass spectrometry (MALDI-TOF-MS) (Lomnytska et al., 2006). This study revealed significantly higher levels of TBX3 in plasma of both early stage and advanced stage breast cancer and ovarian cancer patients relative to healthy control patients (Lomnytska et al., 2006).
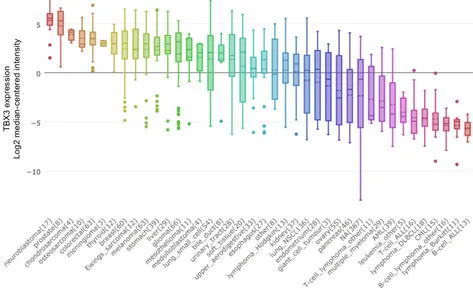
TBX3 mRNA IN CANCERS – TBX3 is overexpressed in a variety of different cancer types (Figure 1.2.3). Microarray analysis revealed that elevated TBX3 mRNA expression was associated with advanced tumor stage, chemo-resistance and an unfavorable prognosis in patients with hepatoblastoma (Renard et al., 2007). Assessment of TBX3 expression by qRT-PCR and western blot in non-small cell lung cancer (NSCLC) patient samples revealed that overexpression of TBX3 was associated with tumor size, TNM stage, differentiation, and recurrence, and was an independent prognostic marker for overall survival (Wu et al., 2017). Additionally, up-regulation of TBX3 has been documented with chronic exposure to carcinogens, including a positive correlation with tobacco smoking status (Wu et al., 2017) and exposure to the environmental toxin DE-71 and liver tumorigenesis (Shimbo et al., 2017).
Figure 1.2.3 – TBX3 mRNA expression by cancer type.
The single published transgenic TBX3-inducible mouse model used a doxycycline-inducible TBX3iso2 expression system under the control of the mouse mammary tumor virus (MMTV) promoter (Liu et al., 2011). Their results showed that overexpression of TBX3iso2 in murine mammary glands resulted in mild focal hyperplasia and importantly no tumor formation (Liu et al., 2011). The effect of inducible overexpression of TBX3iso1 was not examined. Few xenograft studies have been conducted overexpressing either TBX3iso1 or TBX3iso2 (or knockdown of total TBX3 levels) in various cell line backgrounds in order to assess resultant tumorigenicity. TBX3iso1 was overexpressed in SWI1353 chondrosarcoma cells and exhibited enhanced tumor growth (Willmer et al., 2016a). Injection of TBX3-overexpressing non-tumorigenic WM1650 melanoma cells into the flank of nude mice resulted in 6/6 of mice forming tumors compared to 0/6 in the parental control cells (Peres and Prince, 2013). Overexpression of TBX3 in pancreatic cancer cell lines resulted in significantly larger tumors than controls (Perkhofer et al., 2016). The latter two examples did not state which TBX3 isoform was overexpressed. The shRNA-mediated knockdown of TBX3 in tumorigenic ME1402 melanoma cells abolished their ability to form tumors when injected into the flank of nude mice (Peres et al., 2010).
Figure 1.2.4 – Cancer-related TBX3 signaling pathways.
Green lines represent direct transcriptional interactions, while red lines represent direct
TBX3 and Cellular Senescence – p14
ARF/ p53 / p21
CIP1Pathway
The cyclin-dependent kinase inhibitor 2A (CDKN2A) gene encodes the p16INK4A and
p14ARF proteins in humans, with differential promoters and partially overlapping reading
frames (Ruas and Peters, 1998). Both proteins act as tumor suppressors and are important regulators of cellular senescence (Ruas and Peters, 1998). While p14ARF is primarily involved
in stabilization of p53, p16INK4A inhibits the enzymatic activity of cyclin-dependent kinases 4
and 6 (CDK4/6) (Rayess et al., 2012). CDK4/6 binds cyclin D, which then phosphorylates the Retinoblastoma (Rb) protein, resulting in dissociation of Rb and the E2F transcription factor, thereby promoting the G1 to S phase transition (Rayess et al., 2012).
Cellular senescence is a protective mechanism of irreversible growth-arrest resulting in permanent exit from the cell cycle. Senescence can be induced by cellular stresses (accelerated senescence) or telomere shortening (replicative senescence) (Lu et al., 2010). One of the most well described pathways of accelerated senescence is through activation of p14ARF, whereby p14ARF binds to and sequesters mouse double minute 2 (MDM2), preventing
MDM2 from targeting p53 for destruction (Tao and Levine, 1999). High expression of p14ARF
thus stabilizes p53, leading to expression of p53 target genes (Lu et al., 2010). Early studies reported that TBX3 overexpression leads to impaired functioning of the p53-pathway, suppression of apoptosis and facilitation of cell transformation (Carlson et al., 2002). TBX3 was later identified in a senescence screen and described as a potent inhibitor of senescence through inhibition of p14ARF (and p19ARF mouse ortholog), explaining the previously reported
effect on p53 (Brummelkamp et al., 2002). After this initial identification of the powerful anti-senescence effect of TBX3, both TBX3 and TBX2 have been shown to bind to a variant TBE in the human p14ARF promoter matching 13 of 20 nucleotides within the consensus TBE
(Lingbeek et al., 2002). Specifically, TBX3 is able to interact with HDACs 1, 2, 3 and 5, leading to local changes in histone acetylation and subsequent down-regulation of p14ARF expression
in breast cancer cell lines (Yarosh et al., 2008).
carcinoma and human colorectal cancer, later attributed to activation of the p14ARF / p53
pathway (Renard et al., 2007, Zhang et al., 2011a).
The cyclin-dependent kinase inhibitor p21CIP1 is essential for p53-induced cellular
senescence (Waldman et al., 1995). TBX3 was shown to directly bind to the p21CIP1 promoter
and repress gene transcription in a dose-dependent manner in melanoma cell lines (Hoogaars et al., 2008, Willmer et al., 2016b). This was shown by electromobility shift assays (EMSA), luciferase assays, and ChIP qRT-PCR validation (Hoogaars et al., 2008, Willmer et al., 2016b). Repression of both p14ARF and p21CIP1 by TBX3 produces a powerful synergistic
effect, leading to a strong inhibition of senescence (Lu et al., 2010).
Lastly, TBX3 is also able to bypass senescence through down-regulation of p16INK4A
through formation of a co-repressor complex, leading to destabilization of p16INK4A and
inhibition of the Rb pathway (Kumar P et al., 2014a).
TBX3 and the TGF-ß Pathway
TBX3 and the FGF Pathway
The fibroblast growth factor (FGF) signaling pathway is comprised of a group of developmentally-important secreted signaling proteins. Binding of FGF ligands to their signaling receptors (FGFRs) results in activation of their intracellular tyrosine kinase domain, which can activate several intracellular signaling pathways involved in maintenance, repair, regeneration and metabolism of adult tissues (Ornitz and Itoh, 2015).
During development in the mouse, TBX3 is initially expressed in the mammary lineage prior to mammary bud formation at E10.25, which is followed by the first signs of the mammary gland at E10.5 to E11, and expression of several Wnts and FGF ligands (Eblaghie et al., 2004). Eblaghie et al. soaked beads in various FGF proteins, and implanted them into the flank of mice in order to assess expression of downstream genes of interest (Eblaghie et al., 2004). They reported that FGF8 induces expression of TBX3 in an FGFR1-dependent manner (Eblaghie et al., 2004). These early studies showed that TBX3 and FGF ligands are able to interact and influence expression of one another within a developmental context (Eblaghie et al., 2004). Several other studies have reported autoregulation of expression between T-box and FGF family members (Isaacs et al., 1994, Schulte-Merker and Smith, 1995, Casey et al., 1998, Eblaghie et al., 2004).
TBX3 and the Wnt / ß-Catenin Pathway
The Wingless (Wnt) signaling pathway is involved in cellular proliferation and differentiation, and plays a crucial role in development and tissue homeostasis (Giles et al., 2003). Several Wnt proteins are overexpressed in breast cancer cell lines, leading to activation of the canonical Wnt/ß-catenin signaling pathway (Howard and Ashworth, 2006). ß-catenin directly binds to the TBX3 promoter through a T-cell specific (TCF)-binding site, leading to increased proliferation and survival of liver cancer cells (Renard et al., 2007).
TBX3 and Wnt signaling have been extensively studied in the processes of development. Within the developing mammary gland, TBX3 is required for the induction of Wnt signaling, as homozygous TBX3 mutant transgenic mice showed an inability to initiate mammary gland development and lack expression of the earliest markers of this developmental process (Lef1 and Wnt10b) (Davenport et al., 2003, Rowley et al., 2004). Additionally, induction of TBX3 expression in the developing mammary gland requires Wnt signaling (Eblaghie et al., 2004, Douglas and Papaioannou, 2013), suggesting the presence of a feedback loop (Davenport et al., 2003, Eblaghie et al., 2004, Cho et al., 2012). TBX3 overexpression in mammary epithelial cells was additionally reported to coordinate expansion of progenitor cells through induction of Wnt signaling (Arendt et al., 2014).
TBX3 and the PTEN / PI3K / AKT Pathway
The phosphoinositide 3-kinase (PI3K) and protein kinase B (AKT) signaling pathway has been described as an upstream mediator of TBX3 expression in mouse embryonic stem cells (Niwa et al., 2009), melanoma, and head and neck squamous cell carcinoma (HNSCC) (Burgucu et al., 2012, Boyd et al., 2013, Peres et al., 2015). The PI3K/AKT pathway promotes proliferation and cell survival in response to binding of growth factors, cytokines and/or hormone ligands to receptor tyrosine kinases (RTKs) (Cantley and Neel, 1999).
repression of E-cadherin by TBX3, and increased migration and invasion of melanoma cell lines (Peres et al., 2015).
There is also evidence that TBX3 may function upstream of the PI3K/AKT pathway through repression of the tumor suppressor PTEN. PTEN is the main negative regulator of PI3K, thus functioning as a tumor suppressor through its PI3K-dependent inhibition of AKT (Cantley and Neel, 1999). There is an inverse correlation between TBX3 and PTEN expression in HNSCC (Burgucu et al., 2012). TBX3 is able to repress both basal and induced expression of PTEN in HNSCC cell lines, through binding a non-canonical TBX3 binding site in the PTEN promoter (Burgucu et al., 2012). TBX3 was not able to repress PTEN in muscle cells, however, suggesting context-dependent repressive functions (Zhu et al., 2016).
Regulation of TBX3 by miRNAs
MicroRNAs (miRNAs) are non-coding RNAs which are able to modulate gene expression by binding to complementary nucleotides in the 3’ untranslated region (UTR) of target genes (Bartel, 2004). The 3’ UTR of TBX3 extends 1,587 bp beyond the termination codon (Bamshad et al., 1999). Binding sites for several microRNAs have been found in the 3’ UTR of TBX3, including miR-25, miR-32, miR-92, miR-93 (validated), miR-137 (validated), miR-206 (validated), miR-363, and miR-367 (Zhang et al., 2011b, Humtsoe et al., 2012, Jiang et al., 2013, Cioffi et al., 2015, Amir et al., 2016).
1.3
Alternative Splicing in normal and neoplastic cells
Gene expression changes, on their own, cannot fully account for changes in gene functions and cellular phenotype (Venables, 2004). It is estimated that over 90% of human genes are alternatively spliced, adding an enhanced layer of complexity and diversification to genes encoded in the genome (Matlin et al., 2005, DeBenedittis and Jiao, 2011). Cancer cells are able to exploit the process of alternative splicing to produce isoform switches, resulting in enhanced survival, proliferation and invasiveness (Oltean and Bates, 2014, Shen et al., 2016).
Genes are transcribed into pre-mRNA, containing long intervening segments called introns, and protein-coding segments called exons. Alternative splicing refers to the “cutting” of intron-exon boundaries in pre-mRNA and joining the exons together in highly specific arrangements, producing structurally and functionally distinct mRNA and protein variants (Blencowe, 2006). The majority of alternative splicing events occur simultaneously with transcription, with the emergence of pre-mRNA from RNA polymerase II (Bentley, 2005, Blencowe, 2006). Additionally, modifiers of chromatin structure, including histone modifications and nucleosome positioning, affect transcription kinetics and thus alternative splicing decisions (Kornblihtt et al., 2013). This global post-transcriptional mechanism thus allows for cell-specific, stage-specific and stimuli-specific responses (Pajares et al., 2007).
After transcription and pre-RNA processing is completed, mature mRNA is exported from the nucleus to the cytoplasm where it is translated into protein. As a precautionary quality control mechanism, the nonsense-mediated mRNA decay (NMD) pathway leads to cytoplasmic degradation of inappropriately expressed transcripts (Pajares et al., 2007). Sometimes an aberrant transcript is not detected by the NMD pathway and is translated into protein; this is observed in several diseases including cancers (Pajares et al., 2007).
composition of trans-acting splice factors (even in the absence of mutations) has also been documented to alter splicing patterns (Pajares et al., 2007). The documented splicing machinery changes during oncogenesis result in cancer-specific patterns of alternative splicing, leading to the emergence of previously non-existent transcripts and/or aberrant isoform ratios expressed within tumors relative to normal tissues (Pino et al., 2003, Venables, 2004, Ladomery et al., 2007, Pajares et al., 2007).
There are numerous examples of alternatively spliced transcripts having diverse and antagonistic functions (Pajares et al., 2007). A prominent example includes alternative splicing of vascular endothelial growth factor (VEGF); most splice variants are actively pro-angiogenic (Ladomery et al., 2007). Interestingly, the VEGFb splice variant is actively anti-angiogenic, and contains only 6 different amino acids relative to its most similar isoform (Ladomery et al., 2007). A splicing switch from the anti-angiogenic to pro-angiogenic variant is observed both in cancer progression, as well as in diseases such as proliferative diabetic retinopathy (Blencowe, 2006, Ladomery et al., 2007, Pajares et al., 2007). As such, differential expression of VEGF isoforms is associated with significant differences in survival for patients with node-positive breast cancer (Konecny et al., 2004).