Western University Western University
Scholarship@Western
Scholarship@Western
Electronic Thesis and Dissertation Repository
7-13-2018 2:00 PM
Examining Rating Source Differences in Narrative Performance
Examining Rating Source Differences in Narrative Performance
Feedback
Feedback
Kevin Doyle
The University of Western Ontario
Supervisor
Dr. Richard D. Goffin
The University of Western Ontario Graduate Program in Psychology
A thesis submitted in partial fulfillment of the requirements for the degree in Doctor of Philosophy
© Kevin Doyle 2018
Follow this and additional works at: https://ir.lib.uwo.ca/etd
Part of the Industrial and Organizational Psychology Commons, and the Performance Management Commons
Recommended Citation Recommended Citation
Doyle, Kevin, "Examining Rating Source Differences in Narrative Performance Feedback" (2018). Electronic Thesis and Dissertation Repository. 5447.
https://ir.lib.uwo.ca/etd/5447
This Dissertation/Thesis is brought to you for free and open access by Scholarship@Western. It has been accepted for inclusion in Electronic Thesis and Dissertation Repository by an authorized administrator of
i Abstract
The purpose of the present study was to examine the narrative feedback quality
and content of comments from supervisors, peers, and subordinates in a multisource
performance feedback context. Research on performance management interventions
tends to focus on issues such as rater training, scale development, scale formats, and
reducing test and rater bias. However, other components in performance management
interventions have received little attention, including narrative feedback. Narrative
feedback takes the form of written comments describing the ratee’s performance on
different dimensions. The narrative feedback quality variables included favorability,
specificity, goal content, and feedback length. Predictor variables of narrative feedback
quality including rater familiarity, rater acquaintanceship time, and ratee position tenure
were also investigated. The narrative feedback content variables included the amount of
relative content, absolute content, task content and trait content.
The data were collected using a commercial multi-source feedback instrument
which included numeric ratings and narrative feedback from the perspectives of the
ratees’ supervisors, peers and subordinates. A sample of 200 ratees with manager or
director in their title were selected. Each of the 8,967 comments were coded by four
trained research assistants. The results indicated that supervisors provided the highest
quality narrative feedback, peers and subordinates were comparable. Rater familiarity
tended to be positively related to narrative feedback quality, and, interestingly,
acquaintanceship time tended to be negatively related to narrative feedback quality,
suggesting that acquaintanceship time should not be used as a proxy for familiarity. Ratee
ii
relationship was smallest for peers suggesting the use of peer raters for longer-tenured
ratees. The rating source comparisons of the narrative feedback content variables
suggested that all sources used about the same amount of each content type, and that the
relationships between the content variables and narrative feedback quality were
comparable across rating sources. The overall results for relative, absolute, and trait
feedback content suggested that they were related to positive description and included
little actionable content. Task content had the largest positive relationships with narrative
feedback quality, indicating that future rater training should focus on the provision of task
content.
Keywords: narrative feedback; 360 degree feedback; multisource feedback; familiarity;
iii
Acknowledgements
I would like to start by recognizing all the people who put so much time and effort
into making this project succeed. My supervisor, Dr. Rick Goffin, went above and
beyond mentoring and supporting me throughout this project, from idea conception to
reporting the insights. My lab mates Justin Feeney, Kabir Daljeet, and Rebecca Factor
also supported this project by assisting with managing the dataset, developing training for
the coders, and being subject matter experts for scale development.
I would like to thank Dr. Paul Tremblay. His guidance during the dissertation
proposal regarding structuring the dataset and statistical analyses elevated the project. Dr.
Mitch Rothstein’s subject matter expertise was also helpful at the proposal stage of this
project. I would like to thank my departmental defence committee of Dr. Natalie Allen,
Dr. Joan Finnegan, and Dr. Alex Benson. Their input and questions helped make the
dissertation more defensible and prepared me for the senate defence. I would also like to
thank my senate defence committee or Dr. Chet Robbie, Dr. Ann Peng, Dr. Natalie Allen,
and Dr. Joan Finnegan. I really enjoyed speaking with each of you about the project and
appreciated the insight you provided me.
I would like to thank all the faculty that have helped shape my undergraduate and
graduate school experience. Dr. John Meyer was an excellent instructor and mentor both
in the classroom and through RUWP projects. Dr. Susan Pepper introduced me to
Industrial/Organizational Psychology in her undergraduate leadership class in 2008 and
introduced me to my Honours Thesis supervisors, Dr. Tom O’Neill and Dr. Natalie
iv
which helped move me toward graduate studies in Industrial/Organizational Psychology.
Dr. Allen played a very influential role in my education. She taught me during my
undergraduate studies, welcomed me into her teamwork lab, and hired me as a research
assistant while I applied to graduate school. The time and energy she invested really
pushed me to pursue my doctorate. My supervisor, Dr. Rick Goffin played an enormous
role in my development as a researcher and instructor. He pushed me to round out my
skill-set by encouraging me to teach lab courses, act as recruitment lead for the
Industrial/Organizational Psychology area, attend conferences, and get involved in
consulting projects through the RUWP.
I would like to thank my friends in the Industrial/Organizational Psychology
program. Graduate school can be difficult to navigate without a strong support network,
and I had one of the best. Finally, I’d like to thank my family for providing me support
throughout my post-secondary career. Thank you for listening to the ups and downs.
Thank you for being there to listen and celebrate the small wins. I truly appreciate the
v
Table of Contents
Certificate of Examination ...
Abstract ... i
Acknowledgements ... iii
Table of Content ... v
List of Tables ... vii
List of Appendices ... ix
Introduction ... 1
Narrative Feedback Background ... 3
Multisource Feedback Systems ... 5
Narrative Feedback Quality ... 5
Section 1: Overall Differences in Narrative Feedback Quality by Rating Source .... 7
Section 2: Predictor Variables and Narrative Feedback Quality ... 8
Section 3: Narrative Performance Feedback Content and Feedback Quality ... 15
Method ... 23
Participants ... 23
Narrative Feedback Quality Measures ... 25
Rater-Ratee Relationship Variables ... 26
Ratee-Reported Variable ... 27
Narrative Feedback Content Variables ... 27
Narrative Feedback Quality Coding Procedure ... 28
Research Assistant Training ... 30
Statistical Analyses ... 31
Effect Size Interpretation ... 33
vi
Section 1: Overall Narrative Feedback Outcome Comparisons ... 34
Section 2: Predictor Variables and Narrative Feedback Quality ... 36
Section 3: Narrative Feedback Content and Narrative Feedback Quality ... 57
Discussion ... 84
Section 1: Overall Differences in Narrative Feedback Quality by Rating Source .. 84
Section 2: Predictor Variables and Narrative Feedback Quality ... 85
Section 3: Narrative Feedback Content and Narrative Feedback Quality ... 92
Implications ... 99
Limitations ... 102
Study Strengths ... 103
Future Research ... 103
Conclustion ... 106
References ... 108
Appendix A: Leadership Development Instrument Factors and Sample Behaviors . 115 Appendix B: Narrative Feedback Quality Scales ... 117
Appendix C: Sample Rater Comments ... 119
AppendixD: Rater Training Slides... 121
vii List of Tables
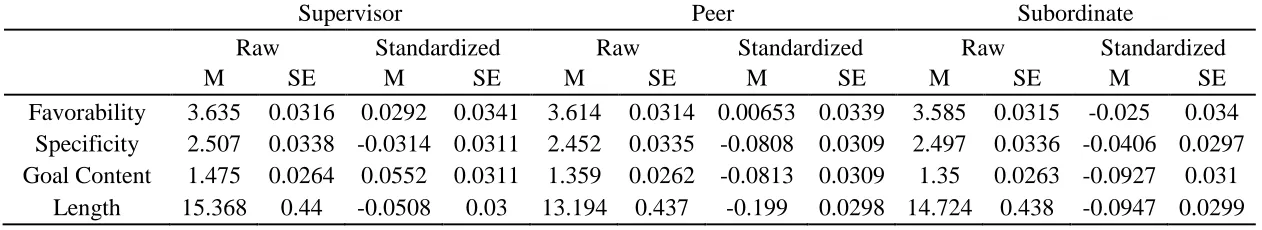
Table 1: Means and Standard Errors of Outcome Variables by Rating Source...35
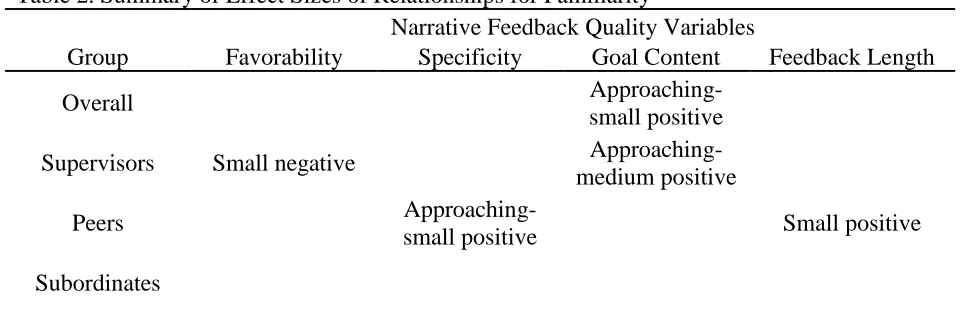
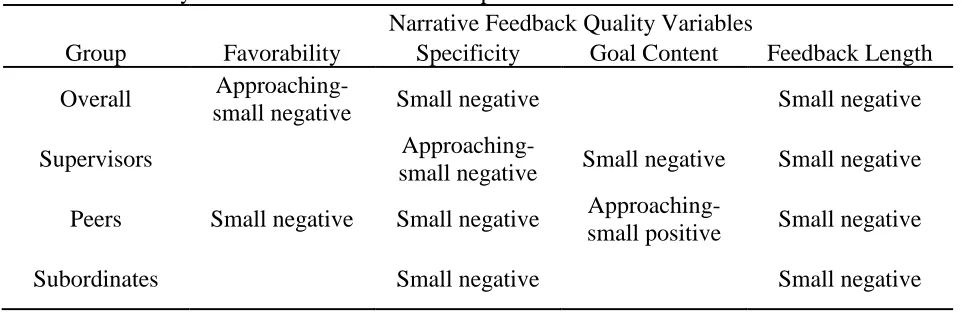
Table 2: Summary of Effect Sizes of Relationships for Familiarity ...38
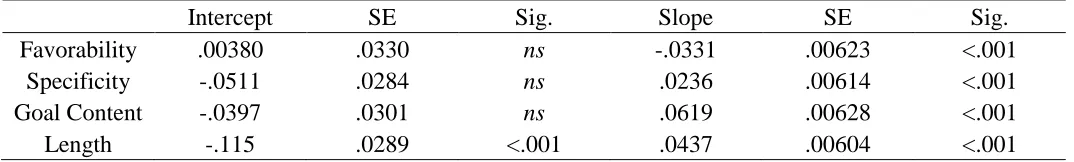
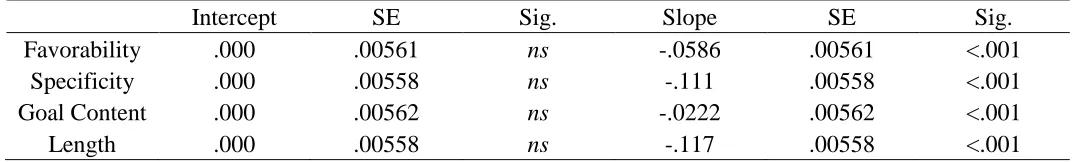
Table 3: Slopes and Standard Errors for Familiarity and Outcome Variables ...39
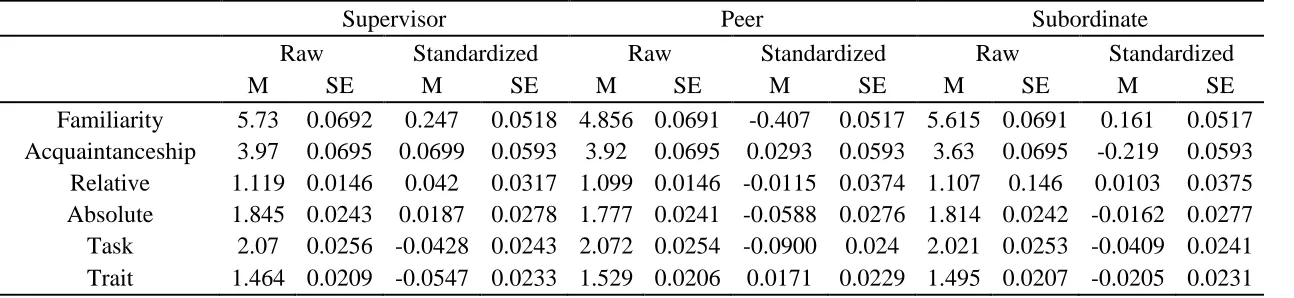
Table 4: Means and Standard Errors of Additional Variables by Rating Source ...41
Table 5: Slopes and Standard Errors for Familiarity and Outcome Variables by Rating Source ...42
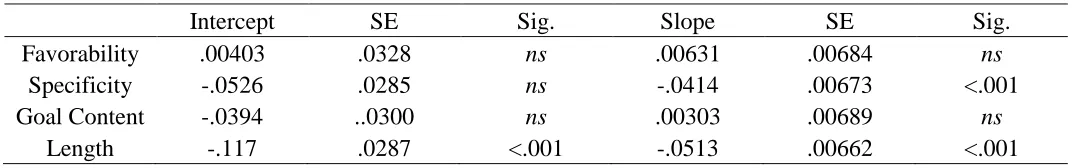
Table 6: Summary of Effect Sizes of Relationships for Acquaintanceship Time ...45
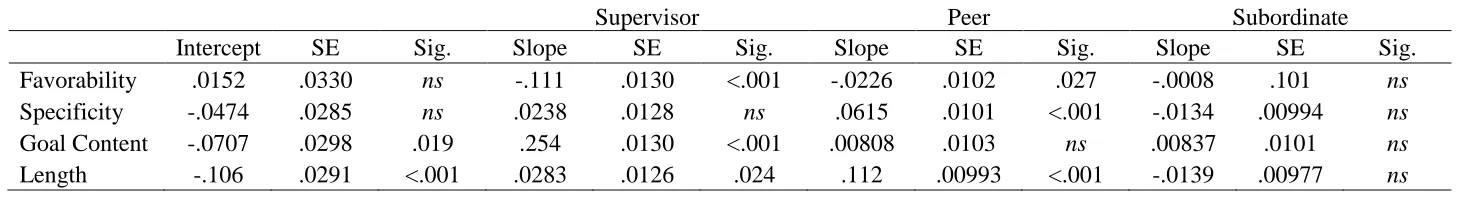
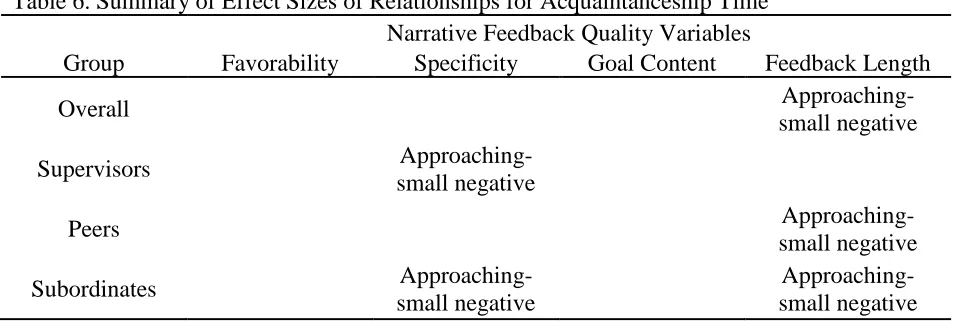
Table 7: Slopes and Standard Errors for Acquaintanceship Time and Outcome Variables ...46
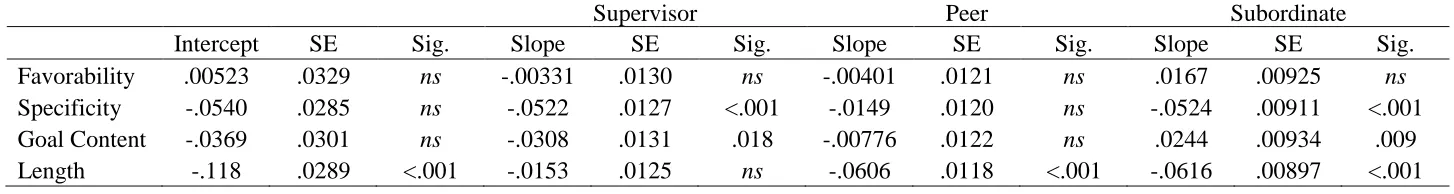
Table 8: Slopes and Standard Errors for Acquaintanceship Time and Outcome Variables by Rating Source ...49
Table 9: Summary of Effect Sizes of Relationships for Position Tenure ...52
Table 10: Slopes and Standard Errors for Tenure in Position and Outcome Variables ...53
Table 11: Slopes and Standard Errors for Tenure in Position and Outcome Variables by Rating Source ...55
Table 12: Summary of Effect Sizes of Relationships for Relative Feedback Content ...58
Table 13: Slopes and Standard Errors for Relative Content and Outcome Variables ...59
Table 14: Slopes and Standard Errors for Relative Content and Outcome Variables by Rating Source ...62
Table 15: Summary of Effect Sizes of Relationships for Absolute Feedback Content ...65
viii
Table 17: Slopes and Standard Errors for Absolute Content and Outcome Variables by
Rating Source ...68
Table 18: Summary of Effect Sizes of Relationships for Task Feedback Content ...71
Table 19: I Slopes and Standard Errors for Task Content and Outcome Variables ...72
Table 20: Slopes and Standard Errors for Task Content and Outcome Variables by Rating
Source ...75
Table 21: Summary of Effect Sizes of Relationships for Trait Feedback Content ...78
Table 22: Slopes and Standard Errors for Trait Content and Outcome Variables ...79
Table 23: Slopes and Standard Errors for Trait Content and Outcome Variables by Rating
Source ...82
ix
List of Appendices
Appendix A: Leadership Development Instrument Factors and Sample Behaviors . 115
Appendix B: Narrative Feedback Quality Scales ... 117
Appendix C: Sample Rater Comments ... 119
1
Performance management can be defined as a “continuous process of identifying,
measuring, and developing the performance of individuals and teams and aligning
performance with the strategic goals of the organization” (Aguinis, 2009, p. 2). The
development of performance management systems begins by identifying key tasks and
skills that are necessary to be effective at a particular job, generally through a process
called job analysis (see Cascio & Aguinas, 2011). The next undertaking is to develop a
set of scales that adequately represent the tasks and skills identified in the job analysis
and to link these with the organizational goals and vision. The set of scales comprises the
annual performance appraisal or performance evaluation. Performance evaluation has two
main purposes, to support administrative functions and to assist in employee
development. Administrative functions include decisions regarding pay raises,
promotion, termination, allocation of rewards, etc. Although administrative functions are
central to the performance management process, the present research looks specifically at
the employee development component. It is believed that by providing an employee with
feedback regarding their performance that they will have a better understanding of their
strengths and weaknesses and change their behavior accordingly.
With employee development being a central tenet in the performance
management literature, it is surprising that one-third of performance feedback
interventions result in decreased performance (Kluger & DeNisi, 1996). The
meta-analysis by Kluger and Denisi (1996) has become highly cited largely because
researchers have yet to fully understand why so many feedback interventions result in
decreased performance. One possible reason is researchers’ fixation on the numeric or
2
Research on performance management interventions tends to focus on issues such as
scale development, scale formats, and reducing test and rater bias (i.e. Austin &
Villanova, 1992; Landy & Farr, 1980; Nowack & Mashihi, 2012). However, other
components common in performance management interventions have received little
attention, including narrative feedback. Narrative feedback generally takes the form of
written comments that explain why particular ratings were given. A recent benchmarking
study indicated that 85% of multisource feedback instruments contain narrative feedback
items (3D Group, 2013), underscoring just how common narrative performance feedback
is (Brutus, 2010). Despite the prevalence of narrative feedback, the overwhelming
majority of performance feedback research has focused on numeric performance ratings
(i.e., Ilgen & Moore, 1987; Ludwig & Goomas, 2009; Vigoda-Gadot & Angert, 2007).
The purpose of the present study was to examine the narrative feedback quality
and content of comments from supervisors, peers, and subordinates in a multisource
feedback context. We were only able to find two studies that have examined narrative
feedback in the context of performance evaluation (David, 2013; Wilson, 2010). Both of
these studies focus solely on narrative performance feedback provided by the supervisor,
leaving important feedback provided by other rating sources unexamined (i.e., peers and
subordinates). Because very little research has focused on narrative performance
feedback, and there are no published findings for peer and subordinate raters, we took an
inductive approach to uncover effects which would in turn lead to theory development.
The approach used, as suggested by Hambrick (2007), involved the generation of results
from a large sample analysis that informed researchers what we need theory development
3
report the observed effects. Thus, we see the present study as the groundwork for many
studies to come. The data were collected using a commercial multi-source feedback
instrument which included numeric ratings and narrative feedback from the perspectives
of the ratees’ supervisors, peers and subordinates.
We next discuss the background of narrative feedback research, followed by a
discussion of multisource feedback systems and rating sources (i.e., supervisors, peers,
and subordinates), and narrative feedback quality. The remainder of the introduction will
address three lines of investigation. The first is the overall differences in the quality of
narrative feedback across the ratings sources. The second is the introduction of predictor
variables and how these might impact the quality of the narrative feedback provided. The
predictor variables included the rater’s familiarity with the ratee’s work behavior, the
acquaintanceship time of the rater with the ratee, and the position tenure of the ratee. The
third is the content of the narrative feedback provided and how the content differentially
related to narrative feedback quality.
Narrative Feedback Background
As previously mentioned, in response to the findings of Kluger and Denisi (1996)
several researchers have turned toward narrative feedback as a means to investigate why
some performance evaluations result in decreased performance. Wilson (2010) was the
first to investigate narrative feedback with regard to performance evaluation. Wilson’s
(2010) study investigated different performance descriptors supervisors utilized when
providing feedback to their subordinates, and potential differences based on ratee
ethnicity. Two researchers developed the dictionary for performance descriptors.
inter-4
rater reliability. The remaining 607 performance appraisals were coded by a single
researcher. Wilson’s (2010) findings indicate that supervisors provided overwhelmingly
positive comments. Further, the positivity of the comments often contradicted the
associated numeric ratings. Finally, Wilson’s (2010) findings suggest that supervisors
emphasized a different set of factors across ethnic groups in arriving at an overall
evaluation.
Following Wilson’s (2010) work, David (2013) set to develop and test a theory of
quality narrative feedback. David (2013) suggested that supervisor feedback that is both
directive (lengthy, specific, and includes goals) and motivational (favorable and high in
interactional justice) would be related to year-lagged performance. David’s (2013)
investigation followed the performance of 1,019 nurses. The data were collected from the
organization’s automated performance appraisal system. Similar to Wilson (2010), David
(2013) had 5 researchers code the first 100 performance appraisals to demonstrate
inter-rater reliability. Following this, David (2013) coded the remaining data herself. David
(2013) found that both favorability and interactional justice had direct and indirect effects
on year-lagged employee performance.
The present study makes new contributions over what has already been
investigated in the domain of narrative performance feedback in a number of ways. First,
we extended our focus beyond the supervisor to also investigate effects for peer raters
and subordinate raters. Second, we adapted David’s (2013) measures of narrative
feedback quality in order to address a number of issues. David’s (2013) scales had an
inconsistent number of scale points and the scale point labels were often categorical
5
researchers to code an initial subset of data in order to calculate inter-rater reliability
statistics, following which the data were coded by a single researcher. We sought a more
rigorous approach, however. We developed a Frame of Reference (FOR; Bernardin,
1979) training program to train our research assistants. Further, each comment was coded
by four trained research assistants, and the author did not code any of the data to remove
the possibility of bias.
Multisource Feedback Systems
Multisource feedback systems are tools that gather information about a target
employee from two or more rating sources (Balzer, Greguras & Raymark, 2005). These
sources may include an employee’s supervisors, peers, subordinates, customers, etc.
Generally, multisource feedback systems lend themselves to management positions that
can take advantage of multiple rating sources and perspectives. Multisource feedback
systems are considered to be primarily developmental tools. In a recent survey, 98
percent of organizations cited employee development as one of the uses of their
multisource feedback system (3D Group, 2013). It has been suggested that ratings from
different sources provide different perspectives on the performance of any given
employee, which can help guide the development and improvement process (i.e., Balzer
et al., 2005). The present study made use of ratings from supervisors, peers, and
subordinates.
Narrative Feedback Quality
Performance feedback that is predominantly numeric provides insufficient context
(David, 2013). Hence, it can be unclear to employees why they received a particular
6
instance, managerial roles tend to be multi-faceted and involve tasks and skills that are
difficult to quantify. As an example, a manager receives a score of 2 on a 5-point scale
measuring facilitating teamwork, where a score of 1 is well below expectations and 5 is
well above expectations. This manager is working to better herself as a leader and wants
to improve her performance, but she is unsure what component of facilitating teamwork
she needs to improve upon. She may interpret her score as an indication that she needs to
conduct team building in order to build comradery. However, the rater may have supplied
the lower score because they find that team tasks are poorly structured and expectations
are not being made clear. The context provided in narrative feedback is necessary for
developing precise goals that drive the development process. Furthermore, evidence
shows that employees pay attention to narrative feedback (Bracken & Rose, 2011), more
than they do the numeric ratings (Ferstl & Bruskiewicz, 2000). Thus, not only do
employees receive important context when they are provided with narrative feedback, but
they are likely to attend to it and internalize it.
David (2013) contends that narrative feedback should be both motivational and
directional to be high quality. Thus, high quality narrative feedback should not only
provide vital information with regard to how the employee should improve their current
performance but also provide the support and encouragement necessary to meet their
improvement goals.
The motivational component of narrative feedback quality. Narrative
feedback tends to be more motivational when it avoids harsh criticism and provides
ample support (DeNisi & Pritchard, 2006). Accordingly, the favorability of narrative
7
support of this, David (2013) found that favorability demonstrated significant direct and
indirect effects on year-lagged performance. Favorability is judged by the degree to
which the feedback is positive rather than negative. David (2013) also included
interactional justice in the motivational component of narrative feedback quality which
captured how the rater treated the ratee with dignity, respect, kindness and consideration
in the feedback provided. During a pre-screening study examining the adapted scales
from David (2013), the interactional justice component and favorability component were
highly correlated (r = .949, p < .001). Therefore, only favorability was retained to reduce
redundancy. The prescreening is further discussed in the methods section.
The directive component of narrative feedback quality. The directive
component assists employee development by affecting the ease to which the ratee can
glean important information regarding their performance and set relevant and specific
goals. Locke and Latham (1984) proposed that specific, detailed, and accepted goals
work best to motivate behavior. As such, the directive component of narrative feedback
quality includes three indices (David, 2013). The first is specificity, defined as the degree
to which the feedback is detailed and supported with behavioral examples. The second is
goal content, defined as the degree to which the rater provides actionable steps to
improve performance. The third is simply the narrative feedback’s length – longer
narrative comments are generally presumed to contribute to higher quality feedback.
Section 1: Overall Differences in Narrative Feedback Quality by Rating Source
We were only able to find two studies that have examined narrative feedback in
the context of performance evaluation (David, 2013; Wilson, 2010). Both of these studies
8
important feedback provided by other rating sources unexamined (i.e., peers and
subordinates). As mentioned, based on David’s (2013) conceptions of narrative feedback
quality, our first line of investigation was to examine possible differences in narrative
quality between rating sources. This is pertinent for two main reasons. First, identifying
the rating sources that provide higher quality narrative feedback would allow researchers
and practitioners to sample more heavily from these sources to ensure that the ratee is
receiving the best information on which to base their professional development. Second,
should we find differences in narrative feedback quality between rating sources, the
results will provide researchers with a base from which to explore why this occurred. For
these reasons we propose:
Research Question 1: Does feedback from different rating sources (supervisors,
peers, and subordinates) vary on the indices of narrative feedback quality (RQ1a:
favorability; RQ1b: specificity; RQ1c: goal content; and RQ1d: feedback length)?
Section 2: Predictor Variables and Narrative Feedback Quality
Understanding the contextual factors related to narrative feedback quality is also
an important endeavor. In particular, by discovering the characteristics of the rater and
ratee that are associated with higher quality narrative feedback, practitioners may be able
to maximize the usefulness of the narrative feedback that is provided to the ratee.
Familiarity with the ratee’s work behavior. In accordance with the Realistic
Accuracy Model (RAM), Funder (1995) suggested that those who are more familiar with
the ratee are more likely to be exposed to relevant cues, detect those cues, and refer to
them when providing ratings. While the RAM model is intended to describe how people
9
providing narrative feedback. Raters familiar with the ratee’s work will likely be able to
recall specific behavioral instances to support their feedback, to create goals that have
relevance to the ratee, and to tailor their feedback so that the ratee is likely to accept and
act on it. Therefore, it is likely that raters more familiar with the ratee’s work behavior
are better equipped to provide high quality narrative feedback. Rater selection is very
important in multisource feedback systems. There are often many peers and subordinates
from whom to choose potential raters. Self-reported familiarity with the ratee’s work
behavior could be a simple and cost-effective criterion for selecting raters to help ensure
that the ratee receives high quality narrative feedback. Based on Funder’s propositions
and in accordance with the RAM (Funder, 1995), we expect that raters who report being
more familiar with the ratee will provide higher quality narrative feedback. Therefore, we
propose the following:
Research Question 2: Will the quality of the narrative feedback (RQ2a:
favorability; RQ2b: specificity; RQ2c: goal content; RQ2d: feedback length) vary
as a function of rater familiarity with the ratee’s work behavior?
It is likely that the level of familiarity with the ratee’s work behavior differs
across rating sources. Supervisors and subordinates are often working with the ratee on a
daily basis and may report higher familiarity than peers. This prompted the following
research question.
Research Question 3: Do the different rating sources (supervisors, peers, and
subordinates) vary on their reported level of familiarity with the ratee’s work
10
The relationship between rater familiarity with the ratee’s work behavior and
narrative feedback quality may not be the same for each rating source. Raters prefer to
provide feedback anonymously largely due to decreased fear of possible retribution once
the feedback has been delivered (e.g., Bracken & Rose, 2011; Nowack & Mashihi, 2012).
Thus, anonymous raters may be less afraid to provide constructive criticism or negative
feedback should it be warranted. This is especially important for subordinate raters whose
outcomes may be dependent on the ratee, their supervisor. Several studies have reported
that when subordinates are not assured of anonymity, ratings are more lenient and the
raters report that they rated differently than they would have if anonymity was ensured
(e.g., Bracken & Rose, 2011; Nowack & Mashihi, 2012). Anonymity is likely to be a less
precious commodity for supervisors because they are less vulnerable to revenge by the
ratee. Moreover, anonymity is often not feasible in the typical situation of a sole primary
supervisor per ratee. Peer raters are likely somewhere in between subordinates and
supervisors with regard to their need of anonymity.
However, the nature of narrative feedback may jeopardize the anonymity
generally provided in multisource feedback systems. High quality narrative feedback is
thought to include specific behavioral examples, which may inadvertently identify the
rater to the ratee. Therefore, it is likely that the higher the narrative feedback quality, the
more identifiable the rater becomes. As a result, subordinate raters may choose to be less
specific and provide less feedback in an attempt to remain anonymous. This would
reduce the variability of the indices of narrative feedback quality, resulting in a smaller
relationship between familiarity and narrative feedback quality for subordinates.
11
associated with quality narrative feedback. This might be to a lesser extent because peers
are less vulnerable than subordinates to the “ratee revenge”, however a disgruntled peer
has greater potential to influence others who are more powerful than would generally be
the case with disgruntled subordinates. Therefore, there is reason to believe that
familiarity with the ratee’s work behavior may be differently related to the quality of the
narrative feedback provided by alternate rating sources, potentially as a function of desire
for anonymity and/or fear of reprisals. This is an important avenue for research because
methods to select raters who are likely to provide high quality narrative feedback may not
be effective for all rating sources, and may actually result in lower narrative feedback
quality. Thus, we ask the following question:
Research Question 4: Does the relationship between rater’s reported familiarity
with the ratee’s work behavior, and quality of narrative feedback (RQ4a:
favorability; RQ4b: specificity; RQ 4c: goal content; and RQ 4d: feedback
length), differ between the rating sources (supervisor, peer, and subordinate)?
Acquaintanceship time. Acquaintanceship time is the amount of time the rater
has known the ratee in their current capacity. Whereas acquaintanceship time is likely
related to rater familiarity with the ratee’s work behavior, it is distinct in that it does not
ask specifically about how familiar the rater is with the ratee’s work behavior. Similar to
familiarity, Funder’s (1995) propositions suggest the notion that the longer the rater has
been acquainted with the ratee in the rater’s current role, the more accurate narrative
feedback they should be able to provide. As with the rater’s familiarity with the ratee’s
work behavior, acquaintanceship time could be used to select raters to ensure the ratees
12
assess than a rater’s familiarity with the ratee’s work behavior, and may prove to be an
expedient proxy for rater familiarity. Therefore, we propose the following:
Research Question 5: Will the quality of the narrative feedback (RQ5a:
favorability; RQ5b: specificity; RQ5c: goal content; RQ5d: feedback length) vary
as a function of acquaintanceship time?
It is likely that the acquaintanceship time of the rater with the ratee differs across
rating sources. On average, supervisors and peer-raters are likely to have known the ratee
in a working capacity for longer are therefore likely to have knowledge of more instances
of behavior from which to provide feedback than would subordinate raters. This
prompted the following research question.
Research Question 6: Do the different rating sources (supervisors, peers, and
subordinates) vary on their reported acquaintanceship time with the ratee?
Funder’s (1995) propositions regarding the RAM suggest that the more familiar
the rater is with the ratee, the more opportunity the rater has likely had to observe the
ratee’s behavior. Certain rating sources likely have acquaintanceship time and their
familiarity with the ratee’s work behavior inextricably tied together. For instance,
subordinates and supervisors are likely to interact with the ratee regularly. However, peer
raters may not interact with the ratee on a regular basis and may interact with them on
only a small range of tasks. It is for this reason we ask the following question:
Research Question 7: Does the relationship between acquaintanceship time and
quality of feedback (RQ7a: favorability; RQ7b: specificity; RQ7c: goal content;
and RQ7d: feedback length) differ between the rating sources (supervisor, peer,
13
Position tenure. Whereas the purpose of investigating the relationship between
the previous variables (familiarity and acquaintanceship time) and narrative feedback
quality was to assist in the selection of raters, the purpose of investigating the relationship
between ratee position tenure and narrative feedback quality was to assist in the selection
of ratees who are likely to receive high quality narrative feedback. Multisource feedback
systems are time consuming and expensive to administer. As a practical concern, it is
important to understand which ratees are likely to receive high quality narrative feedback
to help reduce lost time and money on uninformative reports.
There is a widespread assumption that employees who have been working in the
same position and/or organization for longer are generally better performers than those
who have been in the position and/or organization for less amount of time (i.e., Ng &
Feldman, 2010). The reason this pervasive assumption persists is twofold. First,
employees who have been in the same position for longer amounts of time know how to
do their jobs better than those with less experience (Wagner, Ferris, Fandt, & Wayne,
1987). Second, poorer performing employees are likely to experience voluntary or
involuntary turnover before they spend longer amounts of time in the position (Schneider,
Goldstein, & Smith, 1995). These claims are supported by two theories. Human Capital
Theory suggests that long-tenured workers are better performers because they have
accumulated more job related knowledge over the course of their careers which is likely
to make them better performers (Becker, 1964). Attraction-Selection-Attrition (ASA)
theory suggests that person-organization fit increases with tenure (Schneider, et al.,
1995). Employees who experience high levels of person-organization fit are likely to
14
skills are a good match to the position’s demands (Kristof-Brown, Zimmerman, &
Johnson, 2005). ASA theory also suggests that the selection processes operating in the
development of employee-organization relationships is mutual. Employees are generally
attracted to organizations and positions that reflect their interests. Similarly, organizations
tend to hire only those applicants who fit with their conceptualizations of high performers
(Bretz, Ash, & Dreher, 1989). Additionally, ASA theory suggests that employees will
voluntarily turnover should they perceive a lack of fit, just as organizations will
eventually remove employees who do not have the right set of characteristics and skills.
Therefore, raters may provide less critical feedback to long tenured ratees under the
assumption that those who have spent more time in their current position have garnered
the skills and proficiency to do their jobs well. Therefore, we ask the following:
Research Question 8: Will the quality of the narrative feedback (RQ8a:
favorability; RQ8b: specificity; RQ8c: goal content; RQ8d: feedback length) vary
as a function of ratee position tenure?
Because position tenure is solely a function of the ratee, mean differences
between rating sources were not investigated. Position tenure may impact performance
behaviors in different ways. As one example, accumulating more experience with a
specific role may increase task proficiency on a fairly narrow set of tasks (McEnrue,
1988) and limit the employee’s exposure to different and novel methods being used
elsewhere. Assuming that employees who have been in a position for a longer period of
time are likely higher performers, supervisors will likely be content with their
performance and provide less detailed feedback (i.e., ASA theory; Schneider et al., 1995).
15
to novel methods of completing tasks which may be in conflict with the more traditional
methods of their supervisor. Therefore, subordinate raters may be best situated to provide
high quality narrative feedback because their perspective has been influenced less by
organizational norms. It is likely that peer raters fall somewhere in between supervisor
and subordinate raters.
Alternatively, subordinate raters may view a long-tenured supervisor in high
regard and may be less inclined to provide high quality narrative feedback. Along the
same lines, supervisors may see the long-tenured ratee as someone who has become
comfortable in their current position and provide high quality narrative feedback to
encourage them to develop professionally. Differences in the relationship between ratee
position tenure and narrative feedback quality across rating sources may suggest that
certain rating sources are better at providing narrative feedback to ratees of different
position tenure. This information would allow practitioners to reduce wasted time and
money collecting information from sources that are not likely to provide high quality
narrative feedback. Therefore, we ask the following question:
Research Question 9: Does the relationship between ratee position tenure and the
quality of narrative feedback (RQ9a: favorability; RQ9b: specificity; RQ9c: goal
content; and RQ9d: length) differ between the rating sources (supervisor, peer,
and subordinate)?
Section 3: Narrative Performance Feedback Content and Feedback Quality
The third line of investigation shifts focus to examine what content is associated
with narrative feedback quality. As mentioned, much of the research in the area of
16
of the process (Murphy & Cleveland, 1995). Therefore, the present study draws from the
rating scale line of research to ask questions regarding the content of the narrative
performance feedback. The first distinction is whether the narrative feedback uses
relative or absolute metrics for comparison. Relative feedback content makes use of
social comparison, while absolute feedback content makes use of standards and anchors
prescribed by the organization to describe the level of performance. We will first discuss
relative feedback content, followed by absolute feedback content. The second distinction
is whether the narrative feedback content draws the ratee’s attention to their behavior,
task feedback content, or to their personal characteristics, trait feedback content. Thus,
we will discuss task feedback content followed by trait feedback content.
Relative feedback content. One of the most recent developments in the area of
performance evaluation is the introduction of relative performance scales (i.e., Goffin,
Gellatly, Paunonen, Jackson, & Meyer, 1996). These scales make use of social
comparison by evaluating the ratee against a large referent group, likely employees with
comparable roles and jobs (Goffin, Jelley, Powell, & Johnston, 2009; Kruglanski &
Mayseless, 1990). For instance, the Relative Percentile Method (RPM), asks the raters to
provide percentile ratings of the ratee compared to all others in that position (Goffin et
al., 1996). The scale may ask the rater to evaluate a fast-food cashier by indicating the
percentage of all fast food workers that the employee being rated performs better than.
Relative performance scales have been shown to increase the validity and reduce the
leniency of ratings (Freund & Kasten, 2012). Extending this line of research to narrative
performance feedback, raters may feel inclined to provide feedback that makes use of
17
act on the areas of improvement. An example might include, “Helen is the best leader I
have ever had”. Another is “Compared to the managers here at the plant, Joel’s approach
to team building could use some work”. In the first example, Helen’s performance was
compared to all the leaders the rater has worked with. In the second example, Joel’s
performance was compared to all managers at the plant.
Social comparison theory (SCT; e.g., Festinger, 1954; Kruglanksi & Mayseless,
1990) suggests that people continually evaluate themselves because there is value in
having accurate assessments of one’s own attributes. Furthermore, when suitable
objective criteria for self-evaluation are not available, evaluation takes place through
comparisons with others. For instance, if an employee is wondering how well they are
performing their job, they are likely to compare their perception of their performance
against those with whom they work. Goffin and Olson (2011) suggest that comparative
judgements occur naturally and constantly in our day to day lives. Because people are
constantly comparing themselves to others, relative performance feedback is likely to be
internalized easily and thus acted upon. Therefore, we ask the following question.
Research Question 10: Will the quality of the narrative feedback (RQ10a:
favorability; RQ10b: specificity; RQ10c: goal content; RQ10d: feedback length)
vary as a function of the amount of relative content?
Should relative feedback content prove to be beneficial with regard to the
narrative feedback quality, it will be important to know which sources provide more of it.
18
Research Question 11: Do the different rating sources (supervisors, peers, and
subordinates) vary on the amount of relative content in the feedback that they
provide?
One of the cornerstones of relative performance methodology is a good
representation of the group being used for comparison. Consider the example of a
manager of line workers at a manufacturing plant who is having their performance rated
and is being compared to all other line worker managers. The line worker manager’s
supervisor will likely have more exposure to the performance of other line worker
managers and should be able to effectively use social comparison in their narrative
feedback. Subordinates, however, likely have little exposure to many line worker
managers and may use social comparison less frequently and less effectively than their
managers. Alternatively, subordinates are likely less familiar with organizational policy
regarding performance levels than the ratee’s supervisors. Because they may be unsure if
the ratee’s performance is meeting expectations, subordinates may use social comparison
in lieu of understanding organizational performance benchmarks as suggested by SCT.
Peer raters are likely in the same or similar position as the ratee. Therefore, the peer
rater’s performance is also included in the comparison group when providing relative
narrative feedback. Peer raters may not provide much relative feedback to keep their own
performance from influencing the narrative feedback they provide to the ratee. It is for
these reasons we ask the following questions:
Research Question 12: Does the relationship between relative feedback content
19
goal content, and RQ12d: feedback length) differ between the rating sources
(supervisor, peer, and subordinate)?
Absolute Feedback Content. Whereas relative rating scales require that raters
compare the ratee to a group using social comparison, absolute methods require the rater
to compare the ratee’s performance to standards set by the organization. Examples of
these standards include anchors such as poor, excellent, satisfactory, meeting
expectations, exceeding expectations, etc. When providing narrative feedback to the
ratee, raters may feel inclined to use absolute language to describe the level of
performance and motivate the ratee to improve. Therefore, we ask the following question.
Research Question 13: Will the quality of the narrative feedback (RQ13a:
favorability; RQ13b: specificity; RQ13c: goal content; RQ13d: feedback length)
vary as a function of the amount of absolute content?
Should absolute feedback prove to be beneficial with regard to the narrative
feedback quality, it will be important to know which sources provide more of it in order
to ensure the ratee is receiving the maximal amount of useful feedback. For this reason
we asked the following question.
Research Question 14: Does narrative feedback from different rating sources
(supervisors, peers, and subordinates) vary on the amount of absolute content
provided?
In order to make effective use of absolute feedback content, the rater must be
aware of organizational standards and policy. Understanding what the organization
deems to be effective or ineffective performance in a specific domain will enable the rater
20
organizational standards and policy is likely to differ between rating sources with
supervisors being more exposed, followed by peers and subordinates respectively.
Therefore, we ask the following:
Research Question 15: Does the relationship between absolute feedback content
and narrative feedback quality (RQ15a: favorability, RQ15b: specificity, RQ15c:
goal content, and RQ15d: feedback length) differ between the rating sources
(supervisor, peer, and subordinate)?
Task Feedback Content. Task feedback content focuses the ratee’s attention on
specific behaviors or tasks (Smither & Walker, 2004). Task feedback can be useful to the
employee because it directly addresses the behavior that they exhibit. From this
information, the employee can adjust their behavior in adherence to the narrative
feedback provided which makes it useful in goal setting. An example might be, “Lloyd
should develop agendas and disseminate them prior to team meetings”. This statement
draws the employee’s attention to a behavior that he can do to improve his performance.
Another example is “Candace does a very good job at managing the patient database”.
This statement indicates what Candace is doing well so she can continue performing this
behavior. Therefore, we ask the following question.
Research Question 16: Will the quality of the narrative feedback (RQ16a:
favorability; RQ16b: specificity; RQ16c: goal content; RQ16d: feedback length)
vary as a function of the amount of task feedback?
Should task feedback prove to be beneficial with regard to the narrative feedback
quality, it will be important to know which sources provide more of it. This led to the
21
Research Question 17: Does narrative feedback from different rating sources
(supervisors, peers, and subordinates) vary on the amount of task content
provided?
The effective use of task feedback content is likely to differ between rating
sources. A rater’s ability to effectively address an employee’s behavior and provide
specific examples likely depends on a number of factors. The first is the exposure to the
relevant behavior that is being addressed. In order to provide specific and detailed task
feedback, the rater must be able to draw upon instances of the behavior in question
(Funder, 1995). Therefore, rating sources that work more closely with the ratee will likely
be able to provide more task feedback. Thus, subordinates, as the recipients of leadership
behavior, may be in a good position to provide task feedback. Peer raters may not be as
exposed to the ratee’s leadership behavior, and therefore less able to provide effective
task feedback. The second factor is the rater’s behavioral representation of what is good
and bad performance which may affect their ability to make effective comparisons
(Bernardin, 1979). Supervisors are likely in the best position as they are probably more
exposed to organizational performance standards. Along this line of reasoning, peer raters
likely have less exposure to organizational performance standards than supervisors, and
subordinate raters are likely least exposed. Therefore, based on exposure to ratee
behavior and exposure to organizational performance standards, we expected differences
between the rating sources on the amount of task feedback provided, which prompted the
following questions.
Research Question 18: Does the relationship between task feedback content and
22
content, and RQ18d: feedback length) differ between the rating sources
(supervisor, peer, and subordinate)?
Trait Feedback Content. Narrative feedback can also bring the ratee’s personal
traits or characteristics into focus (Smither & Walker, 2004). Trait feedback addresses
stable characteristics in the employee and is often perceived as less actionable. For
instance, “Susan does not have the leadership ability to properly manage this team”. In
this scenario, the attention was on Susan’s leadership ability and it did not specifically
address a task or behavior. Another example could be, “Barry has the intelligence needed
to succeed in this position”. In this example, Barry was told that he had the capability to
succeed in his position due to his intelligence. Because trait feedback content highlights
personal characteristics of the employee, which are less actionable, it may be associated
with lower narrative feedback quality, however this has yet to be investigated. Therefore,
we asked the following:
Research Question 19: Will the quality of the narrative feedback (RQ19a:
favorability; RQ19b: specificity; RQ19c: goal content; RQ19d: feedback length)
vary as a function of the amount of trait content?
Should trait feedback prove to be beneficial with regard to the narrative feedback
quality, it will be important to know which sources provided more of it. Should trait
feedback prove not to be beneficial with regard to narrative feedback quality it can be
addressed through rater training. This led to the following question:
Research Question 20: Does narrative feedback from different rating sources
(supervisors, peers, and subordinates) vary on the amount of trait content
23
The use of trait feedback is also likely to differ across rating sources. In a similar
vein to task feedback content, it could be that those closest to the employee being rated
will provide more trait content. Raters close to the ratee are likely to know the ratee
personally and thus should be able to provide more nuanced information regarding their
characteristics and disposition. However, it could also be that less familiar ratees use trait
feedback content to describe the employee because they are less familiar with the specific
behaviors they exhibit. In other words, because they cannot comment on specific
behaviors of the employee, they rely on global comments regarding their personality or
ability. Therefore, it is unclear which rating source will provide more trait feedback
content and how trait feedback content relates to indices of feedback quality for the
different rating sources.
Research Question 21: Does the relationship between trait feedback content and
narrative feedback quality (RQ21a: favorability, RQ21b: specificity, RQ21c: goal
content, and RQ21d: feedback length) differ between the rating sources
(supervisor, peer, and subordinate)?
Method
Participants
An archival database of responses to a commercial multisource performance
rating instrument was used for this study. This instrument asked raters to provide numeric
performance feedback on 51 leadership behaviors which are grouped into four factors:
cognitive managerial skills; interpersonal managerial skills; personal managerial skills;
and teamwork, supervision, planning, and productivity (i.e., O’Neill, McLarnon, &
24
found in Appendix A. Ratees were leaders and managers from a range of industries
including manufacturing, healthcare, finance, and information technology. Raters
included the ratees’ supervisors, peers and subordinates. The data were collected as part
of development and succession planning initiatives (i.e., not for formal administrative
decision making). Aside from providing numeric ratings, the raters were also asked to
provide narrative feedback for the leadership behaviors as they saw fit. Therefore, it was
not necessary for raters to provide narrative feedback for any or all leadership behaviors.
The database contained 171,531 narrative comments for 4,385 ratees.
We chose to narrow the scope of our investigation to managers and directors.
Attempts were made to code all the comments provided to the 2,123 ratees who had
director or manager in their job title using the Linguistic Inquiry and Word Count
software (LIWC2015; Pennebaker, Booth, Boyd, & Francis, 2015). Due to the
complexity of the pertinent variables and the inconsistent and often short length of the
comments provided, the use of the software was not successful. Therefore, we chose to
code the narrative comments manually. We selected a random sample of 200 ratees from
the 2,123 ratees who had manager or director in their job title. The sample of 200 ratees
seemed appropriate because the cost associated with hiring and training additional
research assistants would have been excessive. Of the 200 ratees, 111 were male, 65 were
female, and 24 did not provide information regarding their gender. Due to confidentiality
concerns, no information on age or ethnicity was collected. The final sample consisted of
63,423 ratings with 8,967 associated narrative comments. Thus, the narrative feedback
response rate was 12.4 percent. Broken down by rating source, supervisors had a
25
rate of 10.5 percent (26,924 ratings with 3,159 comments), and subordinates had a
response rate of 10.6 percent (28,846 ratings with 3,431 comments).
Of the 8,967 narrative comments, 1,085 were removed because they did not
contain feedback regarding the ratee’s performance. This included statements such as
“not applicable” or “I am not in a good position to be providing feedback on this
dimension”. Other comments were removed because the rater made a mistake. For
instance, some wrote the numeric rating in the narrative feedback field during the
assessment. Each of the narrative comments was coded by four research assistants.
Comments were removed if two or more of the four research assistants coding the
comment agreed that it was not a comment. If only one research assistant thought it was
not a comment, that research assistant’s ratings were removed and that comment was
judged based on the remaining three research assistants. In summary, we studied a total
of 7,882 comments. Each comment was associated with one of 200 ratees and each
comment was coded by 4 research assistants.
Narrative Feedback Quality Measures
The indices of narrative feedback quality (favorability, specificity, goal content,
and length) were adapted from David’s (2013) measure of narrative feedback quality.
These scales were coded by trained research assistants using the procedure described later
in this section.
Favorability. Favorabilitywas defined as the degree to which the feedback was
positive and reflected well on the ratee, or negative and tended to focus on the
26
where 1 was extremely unfavorable, 3 was neutral, and 5 was extremely favorable (see
Appendix B).
Specificity. Specificity was defined as the degree to which the feedback provided
was detailed and supported by behavioral examples (David, 2013). It was measured
using a 5-point Likert scale where 1 was nonspecific, 3 was moderately specific, and 5
was extremely specific (See Appendix B).
Goal Content. Goal content was defined as the degree to which the rater provided
the ratee with actionable steps to improve performance (David, 2013). It was measured
using a 5-point Likert scale where 1 was no goal content, 3 was a moderate amount of
goal content, and 5 was a large amount of goal content (See Appendix B).
Length. Narrative feedback length was operationalized as the total number of
words in the narrative feedback and was measured electronically.
Rater-Ratee Relationship Variables
These rater-ratee relationship variables were a part of the commercial multisource
feedback tool used in the present study. As such, the rater completed these variables
when they completed the instrument itself.
Familiarity with the Ratee’s Work Behavior. Rater familiarity was measured
using a single 7-point Likert scale item asking the rater to indicate “How well are you
acquainted with the work behavior of the target?” where 1 was not at all, 4 was
moderately well, and 7 was extremely well. This information was collected from the
raters at the time they completed the leadership assessment.
Acquaintanceship Time. Acquaintanceship time was measured using a single
27
capacity”. A 6-point scale with the following response options was used: 1 (less than 6
months), 2 (6 months to less than 1 year), 3 (1 year to less than 2 years), 4 (2 years to less
than 5 years), 5 (5 years to less than 10 years), and 6 (10 years or more). This information
was collected from the raters at the time they completed the leadership assessment.
Ratee-Reported Variable
The ratee-reported variable was a part of the commercial multisource feedback
tool used in the present study. As such, the ratee completed this variable when they
completed the instrument itself.
Position Tenure. Position tenure was measured using a single item asking the
ratee “Please indicate how long you’ve been in your current position”. A 6-point scale
with the following response options was used: 1 (less than 6 months), 2 (6 months to less
than 1 year), 3 (1 year to less than 2 years), 4 (2 years to less than 5 years), 5 (5 years to
less than 10 years), and 6 (10 years or more). This information was collected from the
ratees at the time they completed the leadership assessment.
Narrative Feedback Content Variables
The narrative feedback content variables were also coded by trained research
assistants. The coding and training procedures are addressed next.
Relative feedback content. Relative feedback content was defined as the extent
to which the rater provided feedback that made use of social comparison. It was
measured using a 5-point Likert scale where 1 was no relative content, 3 was a moderate
amount of relative content, and 5 was a large amount of relative content (See Appendix
28
Absolute feedback content. Absolute feedback content was defined as the extent
to which the rater provided feedback that made use of adjective descriptors to indicate
performance level. It was measured using a 5-point Likert scale where 1 was no absolute
content, 3 was a moderate amount of absolute content, and 5 was a large amount of
absolute content (See Appendix B).
Task feedback content. Task feedback content was defined as the extent to
which the rater provided feedback that made reference to specific behaviors and tasks. It
was measured using a 5-point Likert scale where 1 was no task content, 3 was a moderate
amount of task content, and 5 was a large amount of task content (See Appendix B).
Trait feedback content. Trait feedback content was defined as the extent to
which the rater provided feedback that made reference to personal qualities of the ratee. It
was measured using a 5-point Likert scale where 1 was no trait content, 3 was a moderate
amount of trait content, and 5 was a large amount of trait content (See Appendix B).
Narrative Feedback Quality Coding Procedure
In the present study we used a deductive approach to qualitative analysis as
suggested by Elo and Kyngas (2008). First, we identified the item-level comment as the
unit of analysis. An item-level comment is the narrative feedback that an individual rater
provided based on one of the 51 dimensions of leadership performance. Examples of
individual narrative comments can be found in Appendix C. Raters were not required to
provide comments for any or all of the performance dimensions.
The second step, as outlined by Elo and Kyngas (2008), was to code the narrative
comments according to the categories and codes. Prior to coding the entire data set, the
29
level of inter-rater reliability. The graduate students all had research experience in the
area of performance evaluation and were familiar with the variables being coded. The
graduate students were trained by acquainting them with the narrative feedback quality
variables and scales. The graduate students went through the same sample of 100
narrative comments and coded them for narrative feedback quality. Once this was
completed, inter-rater reliability statistics were calculated and differences in ratings were
discussed. The Cronbach’s alpha for each of the variables were as follows: favorability
was .897, specificity was .839, goal content was .901, relative content was .933, and
absolute content was .814. The interactional justice scale had a Cronbach’s alpha of .842,
however it was highly correlated with favorability (r = .949, p <.001). Thus, it was
removed to reduce redundancy. Favorability was retained because it demonstrated the
largest effects in David’s (2013) work. These findings suggested that we should continue
with the coding procedure which will be discussed next.
We used paid research assistants to code the data for the present study. We hired
ten third and fourth year students in linguistics as research assistants. We believed that
their knowledge of language was an asset in rating the narrative performance feedback.
We had four research assistants coding each item-level comment. With 8,967 comments
in total, this was a large endeavor. Research assistants were brought in for 3 hour sessions
which occurred four times a week. The number of sessions each coder attended per week
varied according to the research assistants’ schedules and availability. The coding process
lasted 12 weeks, and totaled 376 research assistant hours. Coding took place in a private
room and was supervised by the author. The author was present during each session to
30
during the session. The research assistants were provided with a dataset at the beginning
of each session, and gave that data set back to the author at the end of each session in
order to maintain security over the data.
The research assistants received rater training following the principles of Frame
of Reference training (FOR; Bernardin, 1979). The purpose of FOR training was to help
coders adopt the same metric when it came to providing ratings by reducing
idiosyncrasies in raters’ conceptualization and operationalization of the constructs being
measured. This will be further discussed below.
Research Assistant Training
As mentioned, the research assistant training was based on the principles of FOR
Training (Bernardin, 1979). Two training sessions were offered to a total of 13 research
assistant applicants, of which 10 were retained. Each session lasted two hours, and each
applicant could choose which session worked according to their schedule. The research
assistants were given a training package which included the training slides so they could
follow along and use as a reference when coding. Each session began with a description
of the study and why it was important. Following the introduction, the research assistants
were introduced to the seven variables they would be coding: favorability, specificity,
goal content, relative content, absolute content, task content, and trait content. Each
variable was then expanded upon individually. This involved a definition of the variable,
an introduction to the scale used to code it, and examples of narrative feedback to work
through as a group. When it came to the examples, a written comment taken from the
data set was put up on the projector along with the rating scale used to measure the
31
code that comment. Once everyone had coded the comment, they were encouraged to
share their rating and how they decided on that rating with the group at large. Once the
discussion was over, the expert ratings of each example, as provided by the author and
three other graduate students with knowledge of the area, were shared and words deemed
important to the variable of interest were highlighted in the example. The variables
favorability, specificity, and goal content each had two examples. Relative and absolute
content were introduced and discussed together, as were task and trait content. These
variables were more complex and more difficult to code, thus more examples were
provided. Relative and absolute content had nine examples, while task and trait content
had five.
Following the training, research assistants were asked to code a sample of 100
item-level narrative comments. The 100-item measure was used to show inter-rater
reliability of the research assistants. The Cronbach’s alpha for each of the variables were
as follows: favorability was .966, specificity was .928, goal content was .950, relative
content was .965, absolute content was .889, task content was .879, and trait content was
.919. This was used as an indication that the training had been adopted, that the research
assistants had a similar approach to rating the variables in question, and that we should
continue coding the dataset in its entirety.
Statistical Analyses
All analyses were run using random intercepts mixed models in SPSS. Because
the item-level comment was the unit of interest, this statistical procedure seemed ideal as
it allowed us to control for the ratee while investigating the qualities of individual
32
with multisource ratings which made it impossible to track raters across ratees. Thus, this
analysis accounted for the dependencies associated with the ratee in the dataset. The only
exception to this was the ratee’s position tenure. As this is a ratee level variable, the
effect would not be detected if we also controlled for the ratee.
As mentioned, our analyses clustered at the level of the ratee. We did this because
the item-level comment was the unit of interest and the ratees received an inconsistent
number of comments. In order to justify clustering at the ratee level, several models were
estimated in order to demonstrate the amount of variance accounted for by the ratee for
each of the outcome variables. The intraclass correlation (ICC)(1) value for favorability
was .187 suggesting that the ratee accounted for 18.7 percent of the variance. The ICC(1)
value for specificity was .147 suggesting that the ratee accounted for 14.7 percent of the
variance. The ICC(1) for goal content was .155 suggesting that the ratee accounted for
15.5 percent of the variance. Finally, the ICC(1) value for feedback length was .156
suggesting that the ratee accounted for 15.6 percent of the variance. These values serve as
indications that clustering at the ratee level, and thus controlling for this shared variance,
was justified.
The predictor variables were assessed through simple slopes analyses with the
predictor as the fixed effect for the overall models (familiarity, acquaintanceship time,
position tenure, relative content, absolute content, task content, and trait content), and the
predictor and rating source interaction term as the fixed effect for the moderation models
(i.e. predictor*rating source). The variables were standardized to assist with