Western University Western University
Scholarship@Western
Scholarship@Western
Electronic Thesis and Dissertation Repository
12-7-2018 3:00 PM
Experimental testing and modeling of partial nitrification at
Experimental testing and modeling of partial nitrification at
different temperatures
different temperatures
Xiaoguang Liu
The University of Western Ontario Supervisor
Nakhla, George.
The University of Western Ontario
Graduate Program in Civil and Environmental Engineering
A thesis submitted in partial fulfillment of the requirements for the degree in Doctor of Philosophy
© Xiaoguang Liu 2018
Follow this and additional works at: https://ir.lib.uwo.ca/etd
Part of the Environmental Engineering Commons
Recommended Citation Recommended Citation
Liu, Xiaoguang, "Experimental testing and modeling of partial nitrification at different temperatures" (2018). Electronic Thesis and Dissertation Repository. 5868.
https://ir.lib.uwo.ca/etd/5868
This Dissertation/Thesis is brought to you for free and open access by Scholarship@Western. It has been accepted for inclusion in Electronic Thesis and Dissertation Repository by an authorized administrator of
i
Abstract
Nitrogen in wastewater treatment plant effluents has adverse environmental effects on aquatic
systems. Excessive concentrations of nitrogen in water bodies can result in the depletion of
dissolved oxygen, deterioration of water quality, and shifts of biotic community. Conventional
biological nitrogen removal (BNR) processes consume high energy for nitrification and require
external carbon for denitrification. Alternatively, partial nitrification is of interest as an
emerging technology for its lower need of organic carbon addition and cost savings in aeration.
In this study, the main objectives are: 1- developing a mathematical model involving
operational parameters for the determination of successful partial nitrification conditions; 2-
analyzing the factors affecting the performance of partial nitrification in a sequencing batch
reactor (SBR) using kinetic models at 35oC; 3- investigating the effect of dissolved oxygen
(DO) on nitrification in a sequencing batch reactor (SBR) treating low ammonia wastewater
(40 mg N/L) at low temperature (14oC); 4- investigating the effect of nickel on nitrification in
a sequencing batch reactor (SBR) treating low ammonia wastewater (40 mg N/L) at low
temperature (10oC).
First, a mathematical model based on the minimum DO concentration (DOmin),
minimum/maximum substrate concentration (Smin and Smax), was developed. The model
evaluated the influence of pH (7-9), temperature (10oC-35oC), and solids retention time (SRT)
(5days-infinity) on the minimum/maximum substrate concentration (MSC) values. In addition,
specific application for shortcut nitrification-anammox process at 10oC was analyzed.
ii
and the model prediction fitted experimental data well. The model provides a method to
identify feasible combinations of pH, DO, total ammonium nitrogen (TAN), total nitrite
nitrogen (TNN), and solids retention time (SRT) for successful shortcut nitrification.
Second, to meet objective 2, a sequencing batch reactor (SBR) was operated at 35oC for over
4 months with dissolved oxygen (DO) and influent ammonia concentration as operating
variables to evaluate nitrite accumulation. Stable partial nitrification was observed at two
conditions, influent ammonia concentration of 190 mg N/L and a DO of 0.6-3.0 mg/L as well
as influent ammonia concentration of 100 mg N/L and a DO of 0.15-2.0 mg/L with intermittent
aeration. Kinetic parameters were determined or estimated with batch tests and model
simulation. The kinetic model predicted the SBR performance well.
Third, a sequencing batch reactor (SBR) treating low ammonia wastewater (40 mg N/L) at a
low temperature (14 °C) was operated for 130 days. Three dissolved oxygen levels (5–6 mg
O2/L, 2–3 mg O2/L, and 0.8–1.0 O2/L) were tested. Dissolved oxygen reduction resulted in
lower ammonia oxidizing bacteria (AOB) and nitrite oxidizing bacteria (NOB) activity, with
decreasing ammonia conversion ratio (ACR) and increasing nitrite accumulation ratio (NAR).
The maximum growth rates of AOB and NOB determined in this study (0.28 and 0.38 d-1)
were below the median literature values (0.47 and 0.62 d-1), whereas the oxygen half-saturation
coefficients of AOB and NOB (1.36 and 2.79 mg/L) were higher than those found in the
literature. The kinetic model explained the SBR performance well. Low dissolved oxygen,
together with long solids retention time, was recommended for partial nitrification at a low
temperature.
Lastly, acute and chronic toxicity of nickel to nitrifiers was inverstigated. Chronic toxicity of
iii
SBRs with 1 mg/L nickel dosing either from the beginning or after biomass concentration
decreased to 300 mg/L. Significant nickel inhibition occurred at Ni/MLSS ratio of 2.7 mg Ni/
g MLSS. At a Ni/MLSS ratio of 4-7 mg Ni/g MLSS, ammonia oxidizing bacteria (AOB)
activity was inhibited by 47%-58% after acclimatization. After long-term acclimatization to
nickel at 10oC, high DO(~7mg/L) and SRT of 63-70 days, the µmax, b and Ko of AOB and
NOB were determined as 0.16 d-1, 0.098 d-1 and 2.08 mg O
2/L, and 0.16 d-1, 0.098 d-1 and 2.12 mg O2/L, respectively. Acute toxicity of nickel to nitrification at 10oC, 23oC, and 35oC was
evaluated by short-term batch tests. The nickel inhibition constants based on a modified
non-competitive model for nitrification at 10oC, 23oC, and 35oC were determined. Long-term SBRs
operation and short-term batch tests results were consistent. Short-term nickel inhibition of
nitrifying bacteria was completely reversible.
Keywords
Partial nitrification, biological nitrogen removal, model, dissolved oxygen, temperature,
iv
Co-Authorship Statement
This PhD thesis contains material that is published or “under review” for publication in peer
reviewed journals as listed below.
Chapter 3
Title of the Paper: A model for determination of operational conditions for successful
shortcut nitrification
Authors: Xiaoguang Liu,Mingu Kim, George Nakhla
Status: Published
Journal: Environmental Science and Pollution Research
Reference: Liu, X., Kim, M., & Nakhla, G. (2017). A model for determination of
operational conditions for successful shortcut nitrification. Environmental Science and Pollution Research, 24(4), 3539-3549.
Chapter 4
Title of the Paper: Operational conditions for successful partial nitrification in a
sequencing batch reactor (SBR) based on process kinetics
Authors: Xiaoguang Liu,Mingu Kim, George Nakhla
Status: Published
v
Reference: Liu, X., Kim, M., & Nakhla, G. (2017). Operational conditions for
successful partial nitrification in a sequencing batch reactor (SBR) based on process
kinetics. Environmental technology, 38(6), 694-704.
Chapter 5
Title of the Paper: Performance and kinetics of nitrification of low ammonia
wastewater at low temperature
Authors: Xiaoguang Liu,Mingu Kim, George Nakhla
Status: Published
Journal: Water Environment Research
Reference: Liu, X., Kim, M., & Nakhla, G. (2018). Performance and Kinetics of
Nitrification of Low Ammonia Wastewater at Low Temperature. Water Environment
Research, 90(6), 498-509.
Chapter 6
Title of the Paper: Acute and chronic toxicity of nickel to nitrifiers at low temperature
Authors: Xiaoguang Liu, Mohammad M.I. Chowdhury, Masuduz Zaman, Mingu Kim,
George Nakhla
Status: Submitted
vi
Acknowledgments
First, I would like to express my deepest gratitude to my supervisor, Dr.George Nakhla
(Professor and Salamander Chair in Environmental Engineering, Chemical and Biochemical
Engineering, University of Western Ontario) for his support and guidance throughout my PhD
study in Western. I feel very lucky to work under his supervision as he is knowledgeable,
experienced, and passionate.
Second, I would like to extend my appreciation to Mohammad Chowdhury for his friendship
and support. I would like to thank current and former colleagues: August Wang, Basem
Haroun, Chinaza Akobi, Kai Li, Joseph Donohue, Kyriakos Manoli, Medhavi Gupta, Maritza
Gomez-Flores, Masuduz Zaman, Nan Yang and Dr. Mingu Kim. They all contributed to
creating a very friendly working environment and a highly efficient team. Thanks for being
such great colleagues.
I acknowledge the Clean Technologies for Water Refining and Nutrients and Energy Recovery
(TWNER) - Natural Science and Engineering Research Council (NSERC) – Collaborative
Research and Training Experience (CREATE) Training Program, Canada, for the financial
support.
Finally, I also want to appreciate the tremendous love, support, and encouragement from my
parents, Yizhang Liu and Huiping Yang, as well as my wife, Chuyun Zhang. Without you, I
vii
Table of Contents
Abstract ... i
Co-Authorship Statement... iv
Acknowledgments... vi
Table of Contents ... vii
List of Tables ... xii
List of Figures ... xiv
List of Appendices ... xvii
List of Acronyms ... xviii
Nomenclature ... xx
Chapter 1 ... 1
1 Introduction ... 1
1.1 Rationale ... 1
1.2 Thesis objectives ... 2
1.3 Thesis Organization ... 3
1.4 References ... 5
Chapter 2 ... 7
2 Literature review ... 7
2.1 Introduction ... 7
2.2 Biological nitrogen removal processes ... 8
2.2.1 Conventional BNR process ... 8
2.2.2 Simultaneous Nitrification and Denitrification (SND) ... 11
2.2.3 Partial nitrification-denitrification ... 12
2.2.4 Partial nitrification-anammox ... 14
viii
2.3 Microbiology... 18
2.3.1 AOBs and NOBs ... 18
2.3.2 Key enzymes of AOB ... 19
2.3.3 Key enzymes of NOB ... 21
2.3.4 Kinetics of AOB and NOB ... 21
2.3.5 Anammox bacteria ... 32
2.4 Strategies for achieving partial nitrification ... 32
2.4.1 DO concentration ... 32
2.4.2 Temperature ... 33
2.4.3 pH and free ammonia and nitrous acid concentrations ... 35
2.4.4 Sludge retention time (SRT) ... 38
2.4.5 Real-time control ... 39
2.4.6 Intermittent aeration ... 43
2.5 Partial nitrification in a sequencing batch reactor (SBR) ... 43
2.6 References ... 48
Chapter 3 ... 71
3 A model for determination of operational conditions for successful shortcut nitrification ... 71
3.1 Introduction ... 72
3.2 Methodology ... 73
3.2.1 General MSC equation. ... 73
3.2.2 MSC equation for AOB. ... 74
3.2.3 MSC equation for NOB. ... 74
3.2.4 Effect of pH... 75
3.2.5 Effect of Temperature. ... 77
ix
3.2.7 Integration of Effects. ... 78
3.2.8 Modeling Simulations ... 80
3.3 Results and Discussion ... 82
3.3.1 Impact of pH: Cases 1 and 2. ... 82
3.3.2 Impact of Temperature: Cases 3 and 4. ... 87
3.3.3 Impact of SRT: Cases 5 and 6. ... 87
3.3.4 Special Applications of the DOMSC Curves. ... 88
3.3.5 Analysis of literature results with the MSC model. ... 90
3.3.6 Model use for bioreactor design. ... 93
3.4 Conclusions ... 93
3.5 Acknowledgments... 94
3.6 References ... 94
Chapter 4 ... 100
4 Operational conditions for successful partial nitrification in an SBR based on process kinetics ... 100
4.1 Introduction ... 100
4.2 Materials and methods ... 103
4.2.1 Partial nitrification reactor ... 103
4.2.2 Synthetic Wastewater and Activated Sludge Characteristics. ... 105
4.2.3 Analytical methods ... 105
4.2.4 Batch test ... 106
4.2.5 Model analysis ... 107
4.3 Results ... 107
4.3.1 Start-up performance ... 107
4.3.2 Performance of the SBR ... 108
x
4.4 Discussion ... 118
4.5 Conclusions ... 123
4.6 Acknowledgments... 123
4.7 References ... 123
Chapter 5 ... 129
5 Performance and Kinetics of Nitrification of Low Ammonia Wastewater at Low Temperature ... 129
5.1 Introduction ... 129
5.2 Methodology ... 133
5.2.1 Partial Nitrification Reactor. ... 133
5.2.2 Synthetic Wastewater and Activated Sludge Characteristics. ... 134
5.2.3 Analytical Methods. ... 134
5.2.4 Batch Tests. ... 135
5.2.5 Kinetic Modelling. ... 135
5.3 Results ... 137
5.3.1 Effluent Quality. ... 137
5.3.2 Online Batch Tests. ... 142
5.4 Discussion ... 150
5.4.1 Analyzing the Factors Affecting Nitrification Performance. ... 150
5.4.2 Feasibility of Achieving Nitritation by Low Dissolved Oxygen and LowTemperature. ... 152
5.4.3 Kinetic Rationalization of SBR Performance. ... 154
5.5 Conclusions ... 155
5.6 Acknowledgments... 155
5.7 Reference ... 156
Chapter 6 ... 164
xi
6.1 Introduction ... 164
6.2 Methodology ... 169
6.2.1 Nitrification reactors ... 169
6.2.2 Synthetic Wastewater and Activated Sludge Characteristics. ... 170
6.2.3 Analytical Methods. ... 170
6.2.4 Online batch tests ... 171
6.2.5 Offline batch tests ... 173
6.2.6 Short-term nickel inhibition modelling ... 173
6.2.7 Toxicity Reversibility tests ... 175
6.3 Results and Discussion ... 175
6.3.1 SBR performance ... 175
6.3.2 Online Batch Tests. ... 181
6.3.3 Offline Batch Acute Toxicity Tests. ... 185
6.3.4 Reversibility of acute nickel toxicity ... 193
6.3.5 Comparison of chronic and acute toxicity ... 193
6.4 Conclusion ... 194
6.5 Acknowledgments... 195
6.6 Reference ... 195
Chapter 7 ... 198
7 Conclusions and recommendations ... 198
7.1 Conclusions ... 198
7.2 Recommendations for future work ... 199
Appendices ... 200
xii
List of Tables
Table 2-1. Optimums operational conditions for denitrification process ... 11
Table 2-2. Comparison of N removal processes ... 18
Table 2-3. Characteristics and environmental conditions of different AOB species ... 19
Table 2-4. Characteristics and environmental conditions of different NOB species ... 19
Table 2-5. Summary of AOB kinetic parameters from literature ... 25
Table 2-6.Summary of NOB kinetic parameters from literature ... 29
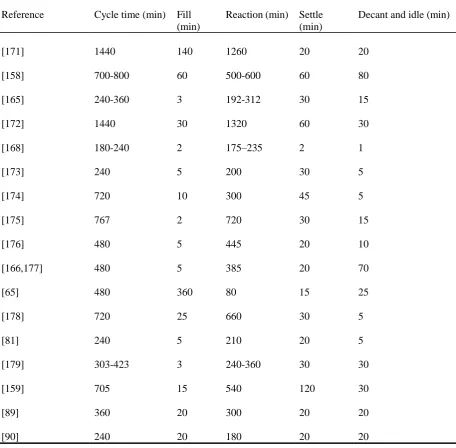
Table 2-7. SBR cycle duration for different partial nitrification studies ... 46
Table 2-8. Operational conditions and control strategies of SBRs for partial nitrifcation ... 47
Table 3-1. Various Kinetic Parameters Selected for the Model Simulation (at 20oC) ... 81
Table 3-2. Operational Conditions for Six Simulation Cases ... 81
Table 3-3. Determination of the Minimum DO Concentration in Short-cut Nitrification Systems ... 91
Table 3-4. Model prediction of Sharon reactors based on specific kinetic values ... 93
Table 4-1. Stable operational conditions and performance of the SBR ... 111
Table 4-2. Summary of Batch Test Conditions and Results (at 35oC) ... 116
Table 4-3. Kinetics Parameters for AOB, T=35oC ... 118
Table 4-4. Calculated growth conditions for AOB and NOB during different periods ... 120
Table 4-5. Comparison between performance and model DO predictions ... 122
xiii
Table 5-2. Performance of the SBR at different dissolved oxygen levels (the average data for
phases I and II were collected from day 20 to day 28, and day 60 to day 100, respectively).
... 141
Table 5-3. Summary of temperature coefficients (θ) for AOB and NOB, from the literature. ... 148
Table 5-4. Recommend SRT range for partial and full nitrification at DOs of 1-5 mgO2/L at 14oC... 152
Table 5-5. Calculated growth rates for AOB and NOB during different phases. ... 153
Table 6-1. Summary of previous studies on nickel inhibition on nitrification ... 167
Table 6-2. Offline batch tests design ... 173
Table 6-3. Performance of the SBRs ... 178
Table 6-4. Nickel inhibition constant for AOB and NOB at 10 oC, 23 oC and 35oC ... 192
xiv
List of Figures
Figure 2-1. Conventional BNR process (adapted from [5]) ... 8
Figure 2-2. Schematic of oxygen concentration profile within a microbial floc. (adapted from [23])... 12
Figure 2-3. Partial nitrification-denitrification process (adapted from [26]) ... 13
Figure 2-4. Mechanism of anaerobic ammonium oxidation.(adapted from [35]). ... 15
Figure 2-5. Partial nitrification-anammox process (adapted from [4]) ... 17
Figure 2-6. Flow of energy and reductants in nitrification through pertinent catabolic modules in AOB and NOB (adapted from [54]) ... 20
Figure 2-7. Effect of temperature on growth rate of AOB and NOB (adapted from [69]) ... 34
Figure 2-8. Relationship between concentrations of free ammonia (FA) and free nitrous acid (FNA) and inhibition to nitrifiers. (adapted from [57]) ... 37
Figure 2-9. Block diagram of the automatic control for partial nitrification to nitrite in biofilm reactors used to ensure the required oxygen-limiting conditions in the biofilm to obtain and maintain continuous full nitritation under stable operating conditions [156]. ... 40
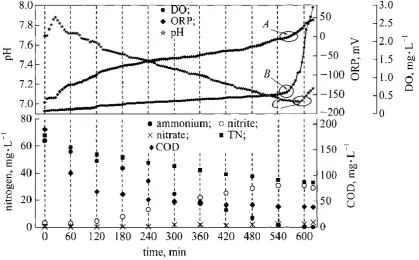
Figure 2-10. Typical pH, ORP and pH profiles with nitrogen and COD in a typical cycle of an SBR (Adapted from [157])... 41
Figure 2-11. Overview of real-time control strategies for partial nitrification(adapted from [47])... 42
Figure 2-12. SBR operation for each tank for one cycle for the five discrete time periods of Fill, React, Settle, Draw, and Idle (adapted From [170]) ... 45
xv
Figure 3-2. DOmin curves by SRT (10-30d) and temperature(10-20oC) for shortcut nitritation to provide an input to the ANAMMOX process. ... 89
Figure 3-3. DOmin curves of AOB and NOB at SRT of 30d, temperature of 20oC, and pH of 8-Effluent NO2-N/NH4-N=1.32 ... 90
Figure 4-1. SBR schematic diagram ... 104
Figure 4-2. Start-up of the SBR ... 108
Figure 4-3. Temporal variation of performance parameters of partial nitrification SBR. .... 110
Figure 4-4. Evolution of biomass concentration during starvation test ... 112
Figure 4-5. Batch test results during period 1 in the reactor ... 115
Figure 4-6. Batch test results during period 3 in the reactor ... 117
Figure 5-1. (A) Effluent ammonia, nitrite, and nitrate concentrations, (B) ammonia
conversion ratio (ACR) and nitrite accumulation ratio (NAR), and (C) MLSS and SRT
change at different dissolved oxygen concentrations (SRT = 10 d; temperature = 14 °C; TN,
total nitrogen; SS, suspended solids.). (Phases I to III with dissolved oxygen range of 5–6
mg/L, 2–3 mg/L and 0.8–1.0 mg/L, respectively.) ... 139
Figure 5-2. First set of batch test results during phase II: (A) ammonia concentration, (B)
nitrate concentration, and (C) relationship between 1/AOR (or 1/NOR) and 1/dissolved
oxygen. ... 144
Figure 5-3. Second set of batch test results during phase II: (A) ammonia concentration, (B)
nitrate concentration, and (C) relationship between 1/AOR (or 1/NOR) and 1/dissolved
oxygen. ... 145
Figure 5-4. Typical pH cycle change during phase I and II. ... 146
Figure 5-5. Comparison of (A) µmax,AOB and (B) µmax, NOB between this study and literature studies (all literature values have been converted to 14 °C using a θ range of 1.023–1.12 for
xvi
Figure 5-6. Relationship between dissolved oxygen and minimum SRT, for AOB and NOB
at 14 °C. ... 154
Figure 6-1. Effluent ammonia, nitrite, and nitrate concentrations and Ni/MLSS ratio of SBR 1 (A) and SBR 2 (B). ... 177
Figure 6-2. MLSS, effluent SS, and SRTs of SBR 1 (A) and SBR 2 (B). ... 180
Figure 6-3. Online batch tests at different DOs in SBR 2 ... 183
Figure 6-4. Evolution of biomass concentration during starvation test. ... 184
Figure 6-5. Specific ammonia oxidation rate (SAOR) and specific nitrite oxidation rate (SNOR) versus Ni/MLSS at 10oC, 23oC and 35oC ... 187
Figure 6-6. 1/SAOR and 1/SNOR versus Ni at 10oC, 23oC and 35oC... 190
xvii
List of Appendices
Appendix A. Supplementary information for Chapter 3 200
xviii
List of Acronyms
ALR ammonia loading rate
AMO ammonia monooxygenase
AOB Ammonia-oxidizing bacteria
AVN ammonia versus nitrate-plus-nitrite
BF blower frequency
BNR Biological nitrogen removal
CASP conventional activated sludge process
CSTR Continuous stirred-tank reactor
HAO hydroxylamine oxidoreductase
HH Hydrazine hydrolase
HZO Hydrazine-oxidizing enzyme
HZS Hydrazine synthase
IBS Immobilised biomass system
MABR Membrane aerated biofilm reactor
MBR membrane biofilm reactor
MBBR Moving bed biofilm reactor
MSC Minimum/maximum substrate concentration
NBP nitrogen break point
NOB Nitrite-oxidizing bacteria
NR Nitrite-reducing enzyme
NXR nitrite oxidoreductase
RSP set-point ratio
xix
SBR Sequencing batch reactor
SBS Suspended biomass system
SND simultaneous nitrification and denitrification
Smax Maximum substrate concentration
Smin Minimum substrate concentration
xx
Nomenclature
Symbol Description Units
ACR Ammonia converstion ratio %
AOR Maximum ammonia oxidation rate mg N/(L∙min)
b Decay coefficient d-1
bAOB Decay coefficient for AOB d-1
bNOB Decay coefficient for NOB d-1
DO Dissolved oxygen mg O2/L
FA Free ammonia mg N/L
FNA Free nitrous acid mg N/L
HRT Hydraulic retention time h
KFA Monod half-saturation concentrations for FA mg N/L
KIFA inhibition concentration for FA mg N/L
KIFNA inhibition concentration for FNA mg N/L
KI,Ni Half-velocity inhibition nickel concentration mg Ni/L
KI, Ni/MLSS Half-velocity inhibition constant based on Ni/MLSS ratio mg Ni/g MLSS
Ko Monod half-saturation concentrations for DO mg O2/L
KTNN Monod half-saturation concentrations for TNN mg N/L
NAR Nitrite accumulation ratio %
NOR Maximum nitrite oxidation rate mg N/(L∙min)
OUR Oxygen utilization rate mg O2/L/hr
ORP Oxidation Reduction Potential mV
pHopt Optimal pH
Q Q is inflow rate L/d
xxi
qNOB Maximum specific substrate utilization rates for NOB mg N/(mg VSS∙d)
SRT Solids retention time d
SAOR Spercific ammonia oxidation rate mg N/g MLSS-hr
SNOR Specific nitrite oxidation rate mg N/g MLSS-hr
SNH Effluent ammonia concentrations mg N/L
SNO2 Effluent nitrite concentrations mg N/L
SNO3 Effluent nitrate concentrations mg N/L
T Temperature oC
TAN Total ammonium nitrogen mg N/L
TNN Total nitrite nitrogen mg N/L
V Volume L
w pH range
XAOB AOB biomass concentration mg VSS/L
XNOB NOB biomass concentration mg VSS/L
YAOB Yield coefficient for AOB mg VSS/mg N
YNOB Yield coefficient for NOB mg VSS/mg N
µmax Maximum growth rate d-1
θKs Temperature coefficient for Ks
θμ Temperature coefficient for 𝜇𝑚𝑎𝑥
1
Chapter 1
1
Introduction
1.1
Rationale
Eutrophication can be stimulated by nitrogen as well as phosphorus. Thus, the discharge
of nitrogen from wastewater treatment plants has been strictly regulated in the last two
decades. Conventional biological nitrogen removal processes, which consist of
nitrification–denitrification, have been applied worldwide. However, there are three
concerns about the conventional BNR process. First, it consumes high amount of energy
for nitrification; second, it requires external organic carbon sources for denitrification;
third, it can release considerable amounts of nitrous oxide (N2O), the carbon footprint of
which is over 300 times greater than CO2 over a 100-year period on climate [1].
Alternatively, new processes including partial nitrification-denitrification and partial
nitrification-anammox have been put forward. Compared with conventional BNR process,
these new processes consume lower energy, require less organic carbon, and produce less
sludge [2,3]. However, the N2O emissions of partial nitrification has been reported as 4 to
14 times higher than full nitrification [4].
One hot topic that recently emerged centers on the feasibility and performance of nitritation
at low temperature and low nitrogen concentration due to the motivation to further apply
nitritation-anammox process for mainstream wastewater, which is characterized by low
2
This topic is more applicable to northern countries like Canada. In southern Ontario, the
wastewater temperature can be as low as 14oC [8].
Several strategies have been adopted to realize partial nitrification. The strategies are: high
temperature, pH, low dissolved oxygen (DO), short sludge retention time (SRT), high free
ammonia (FA), and chemical inhibitors [9–11]. The operational conditions are correlated
to each other. Also, despite the chemical inhibitors, the optimal operational conditions to
realize partial nitrification are determined by microbial kinetics.
1.2
Thesis objectives
The specific objectives of this thesis are as follows:
1) development of a mathematical model involving operational parameters for
determination of successful partial nitrification conditions;
2) analyzing the factors affecting the performance of partial nitrification in a sequencing
batch reactor (SBR) using kinetic models at 35oC;
3) investigating the effect of DO on nitrification in a sequencing batch reactor (SBR)
treating low ammonia wastewater (40 mg N/L) at low temperature (14oC);
4) investigating the chronic and acute effect of nickel on nitrification in a sequencing batch
3
1.3
Thesis Organization
This PhD thesis is written in the article-integrated format specified by the school of
Graduate and Postdoctoral Studies at The University of Western Ontario. The contents of
the seven chapters included in this thesis are presented below:
Chapter 1 presents a general introduction related to the background and motivation for
studying the effect of operational conditions on nitrification at different temperatures. The
research objectives of the thesis are also included in Chapter 1.
A literature review including background on biological nitrogen removal (BNR) is
presented in chapter 2. The research progress related to three generations of BNR processes
(conventional BNR process, partial nitrification-denitrification and partial nitrification-
anammox) is presented.
Chapter 3 is a research article entitled “A model for determination of operational conditions
for successful shortcut nitrification”. In this study, a model based on minimum dissolved
oxygen concentration (DOmin), minimum/maximum substrate concentration (Smin and
Smax), was developed. In addition, the effect of temperature (10-35oC), pH (7-9), and SRT
(5d-infinity) was analyzed. Specific application for partial nitrification-anammox process
at 10oC was analyzed. Comparison of the model predicted DOmin with experimental data
suggested that this model can be a useful and practical tool for shortcut nitrification systems
design and operation.
Chapter 4 is a research article entitled “Operational conditions for successful partial
4
an SBR was operated for 4 months treating synthetic wastewater with ammonia in the range
of 35–200 mg N/L at varying DO concentrations as well as continuous and intermittent
aeration. Stable nitrite accumulation was observed at two conditions. Kinetic parameters
were determined or estimated with batch tests and model simulation. The kinetic model
predicted the SBR performance well.
Chapter 5 is a research article entitled “Performance and kinetics of nitrification of low
ammonia wastewater at low temperature”. In this study, an SBR was operated for over 4
months treating low-ammonia (40 mg N/L) synthetic wastewater at low temperature (14oC)
and an SRT of 10 days. The DO effect was invstestigated at DO levels of 5-6 mg/L, 2-3
mg/L and 0.8-1.0 mg/L. This is the first attempt to directly measure the kinetics of the
nitrifiers which are cultivated at low temperature.
Chapter 6 is a research article entitled “Acute and chronic toxicity of nickel to nitrifiers at
low temperature”. In this study, chronic toxicity of nickel to nitrification of low ammonia
synthetic wastewater was investigated at 10oC in two SBRs with 1 mg/L nickel dosing
either from the beginning or after biomass concentration decreased to 300 mg/L. Acute
toxicity of nickel to nitrification at 10oC, 23oC, and 35oC was evaluated by short-term batch
tests. This is the first study to compare the acute toxicity of nickel to nitrification at
different temperatures and the first study on the chronic toxicity of nickel to nitrification at
10oC.
Chapter 7 includes the main conclusions of the thesis along with scientific contributions,
5
1.4
References
[1] D.J. Griggs, M. Noguer, Climate change 2001: the scientific basis. Contribution of
working group I to the third assessment report of the intergovernmental panel on
climate change, Weather. 57 (2002) 267–269.
[2] M. Beccari, R. Passino, R. Ramadori, V. Tandoi, Kinetics of dissimilatory nitrate
and nitrite reduction in suspended growth culture, J. Water Pollut. Control Fed.
(1983) 58–64.
[3] R. Van Kempen, J.W. Mulder, C.A. Uijterlinde, M.C.M. Loosdrecht, Overview:
full scale experience of the SHARON® process for treatment of rejection water of
digested sludge dewatering, Water Sci. Technol. 44 (2001) 145–152.
[4] J.H. Ahn, T. Kwan, K. Chandran, Comparison of partial and full nitrification
processes applied for treating high-strength nitrogen wastewaters: microbial
ecology through nitrous oxide production, Environ. Sci. Technol. 45 (2011) 2734–
2740.
[5] Z. Hu, T. Lotti, M. de Kreuk, R. Kleerebezem, M. van Loosdrecht, J. Kruit,
M.S.M. Jetten, B. Kartal, Nitrogen removal by a nitritation-anammox bioreactor at
low temperature, Appl. Environ. Microbiol. 79 (2013) 2807–2812.
[6] E.M. Gilbert, S. Agrawal, S.M. Karst, H. Horn, P.H. Nielsen, S. Lackner, Low
temperature partial nitritation/anammox in a moving bed biofilm reactor treating
6
[7] H. De Clippeleir, S.E. Vlaeminck, F. De Wilde, K. Daeninck, M. Mosquera, P.
Boeckx, W. Verstraete, N. Boon, One-stage partial nitritation/anammox at 15 C on
pretreated sewage: feasibility demonstration at lab-scale, Appl. Microbiol.
Biotechnol. 97 (2013) 10199–10210.
[8] X. Liu, M. Kim, G. Nakhla, Performance and kinetics of nitrification of low
ammonia wastewater at low temperature, Water Environ. Res. 90 (2018) 498–509.
[9] J. Surmacz-Górska, A. Cichon, K. Miksch, Nitrogen removal from wastewater
with high ammonia nitrogen concentration via shorter nitrification and
denitrification, Water Sci. Technol. 36 (1997) 73–78.
[10] U. van Dongen, M.S.M. Jetten, M.C.M. Van Loosdrecht, The
SHARON®-Anammox® process for treatment of ammonium rich wastewater, Water Sci.
Technol. 44 (2001) 153–160.
[11] J. López-Fiuza, B. Buys, A. Mosquera-Corral, F. Omil, R. Méndez, Toxic effects
exerted on methanogenic, nitrifying and denitrifying bacteria by chemicals used in
7
Chapter 2
2
Literature review
2.1
Introduction
Nitrogen in wastewater treatment plant effluents has adverse environmental effects on
aquatic systems. Excessive concentrations of nitrogen in water bodies can result in
eutrophication which would translate to accelerated growth of algae and plankton over
other plants, leading to the depletion of dissolved oxygen, deterioration of water quality,
and shifts of biotic community [1,2]. Therefore, most countries apply stringent discharge
standards on organic and ammonium nitrogen.
Most nitrogen in raw municipal wastewaters is in the form of organic nitrogen, and
ammonia with limited nitrate and nitrite concentrations. Ammonia and organic nitrogen
are often combined together, and measured as Total Kjeldahl Nitrogen (TKN). Both
physico-chemical and biological methods have been put forward to eliminate nitrogen from
wastewater [3]. Among all these strategies, BNR, is still the most economically feasible
and effective treatment for municipal and industrial wastewaters [4].
Till now, three generations of biological processes have been put forward: conventional
BNR process, partial denitrification process, and partial
8
2.2
Biological nitrogen removal processes
2.2.1 Conventional BNR process
Conventional biological wastewater treatment process consists of two steps: nitrification
followed by denitrification, as shown in Figure 2-1.
Figure 2-1. Conventional BNR process (adapted from [5])
Nitrification implies an autotrophic oxidation of ammonia to nitrate under aerobic
conditions. Nitrification is conducted in two steps: first, ammonia is oxidized to nitrite by
ammonia oxidizing bacteria (AOB); second, nitrite is further oxidized to nitrate by nitrite
oxidizing bacteria (NOB). Both AOB and NOB are autotrophic bacteria. They use carbon
dioxide as the carbon source and molecular oxygen as an electron acceptor. Ammonia or
9
The stoichiometry of biological nitrification is as follows:
AOBs: 2NH4++3O2→2NO2-+2H2O (Eq.2.1)
NOBs: 2NO2-+O2→2NO3- (Eq.2.2)
Total oxidation reaction: NH4++2O2→NO3-+2H++H2O (Eq.2.3)
Based on the above stoichiometry, complete oxidation of 1g ammonia nitrogen requires
4.57 g O2, with 3.43 g O2 and 1.14 g O2 in each stage, respectively. As acid is generated
alkalinity is needed to neutralize the solution.
The full nitrification reaction can be approximated by Equation 2.4.
NH4++2HCO3-+2O2→NO3-+2CO2+3H2O (Eq.2.4)
In this equation, for each gram of ammonia nitrogen (as N), 7.14g of alkalinity as CaCO3
will be required.
Along with obtaining energy, a portion of the ammonium ion is assimilated into cell tissue.
Equations for the biochemical conversion of ammonia to nitrate with cell synthesis using
a representative measurement of yield and oxygen consumption for AOBs and NOBs are
as follows [3]:
AOBs: 55NH4++76O2+109HCO3-→C5H7O2N+54NO2-+57H2O+104H2CO3 (Eq.2.5)
NOBs: 400NO2-+NH4++4H2CO3+195O2+HCO3-→C5H7O2N+400NO3-+3H2O (Eq.2.6)
10
NH4++1.83O2+1.98HCO3-→0.021C5H7O2N+0.98NO3-+1.041H2O+1.88H2CO3 (Eq.2.7)
In the above equations, yields of AOBs and NOBs are 0.15 mg cells/mg NH4-N oxidized
and 0.02 mg cells/mg NO2-N oxidized, respectively. Oxygen consumption ratios in the
equations are 3.16 mg O2/mg NH4-N oxidized and 1.11 mg O2/mg NO2-N oxidized,
respectively. Also, 7.07 mg alkalinity as CaCO3 is required per mg ammonia nitrogen
oxidized to nitrate nitrogen.
Denitrification is an anoxic process, during which nitrite or nitrate is converted to nitrogen
gas (N2) by heterotrophic denitrifying bacteria. Denitrification utilizes organic matter as
electron donor and nitrite or nitrate as electron acceptor instead of oxygen. Commonly used
carbon source includes acetate, glucose, sugar, methanol and a variety of food and beverage
wastes with the general chemical formula of C10H19O3N [3]. The general reaction of
denitrification is shown below:
C10H19O3N+10NO3-→5N2+10CO2+3H2O+NH3+10OH- (Eq.2.8)
However, for different organic carbons, the specific denitrification reaction are different.
For example, the stoichiometry for acetate is shown in equation 2.9.
5CH3COOH+8NO3-→4N2+10CO2+6H2O+NH3+8OH- (Eq.2.9)
Based on the above equations, contrary to nitrification, alkalinity is produced rather than
consumed in denitrification. For each gram of nitrate reduced, 3.57 gram of alkalinity is
produced, which is half that consumed in nitrification.
11
Table 2-1. Optimums operational conditions for denitrification process
Parameters Value
Temperature (oC) 20-40
Dissolved oxygen (mg/L) <0.2
Free nitrous acid (FNA) (mg N/L) <0.01
pH 7.0-7.5
SRT (d) 3-6
2.2.2 Simultaneous Nitrification and Denitrification (SND)
As nitrification and denitrification are carried out by different microorganisms under
different conditions (aerobic and anoxic), they should be designed and operated in separate
time sequences or spaces, which is common in conventional BNR processes [8]. As a result,
a long retention time or a large volume is required to accomplish complete nitrogen
removal. Conversely, in simultaneous nitrification and denitrification (SND), nitrification
and denitrification occur concurrently in the same reactor [9,10]. Thus, both time and space
are saved greatly. There are two mechanisms involved in SND: physical and biological
[11–13].
Physically, SND occurs as a result of DO concentration gradients within activated sludge
flocs or biofilms due to diffusional limitations (Figure 2.2), which has been confirmed by
microelectrode measurements [14–17]and 15N tracer techniques [18]. The nitrifiers and the
denitrifiers exist in aerobic regions with DO higher than 1-2 mg/L, and in anoxic zones
12
The biological mechanism for SND is very complex. From a microbiological point of view,
SND results from oxidization of ammonia by heterotrophic nitrifiers and the reduction of
nitrate or nitrite by aerobic denitrifiers [18–20]. For example, T. pantotropha was identified as not only a heterotrophic nitrifier but also an aerobic denitrifier, which can carry out the
following reactions sequentially and simultaneously in the presence of a suitable electron
donor (e.g. acetate)[19].
NH4+ NH2OH NO2- N2O N2
SND has significant advantages over conventional processes [21,22]. Not only is the cost
for anoxic tanks saved, but also the overall process design is simplified.
Figure 2-2. Schematic of oxygen concentration profile within a microbial floc.
(adapted from [23])
2.2.3 Partial nitrification-denitrification
Partial nitrification-denitritation process is a partial nitrification to nitrite followed by
13
The reactions involved in this process are shown below [26]:
Partial nitrification:
NH4++1.5O2+2HCO3-→NO2-+2CO2+3H2O (Eq.2.10)
Denitrification:
NO2-+4H++3e-→0.5N2+ 2H2O (Eq.2.11)
Global equation of partial nitrification-denitritation:
NH4++1.5O2+2H++3e-→0.5N2+3H2O (Eq.2.12)
Figure 2-3. Partial nitrification-denitrification process (adapted from [26])
Compared with conventional BNR processes, the main reported advantages of partial
nitrification and denitrification via nitrite are as followed [27–29]:
1) 25% lower oxygen consumption in the aerobic stage.
2) In the anoxic stage, the electron donor requirement is lower (up to 40%).
14
4) 33%-35% lower sludge production in nitrification and 55% lower sludge
production in denitrification, respectively.
2.2.4 Partial nitrification-anammox
An alternative route for biological nitrogen removal is provided by anammox-based
processes. Anammox is the shortcut of ammonia removal cycles, which directly converts
ammonium to nitrogen gas and a small amount of nitrate using nitrite as an electron
acceptor under strict anoxic conditions [30]. Anammox bacteria account for about 50% of
all N2 released into the atmosphere [31]. Anammox bacteria are strict anaerobes and
autotrophs. They are characterized by slow growth rates and have a long doubling time of
10 to 12 days at 35oC [32, 33]. Anammox bacteria utilize CO2 as the sole carbon source
and NO2 as the electron acceptor for ammonium oxidation [34]. The stoichiometry of the
overall anammox metabolic reaction is described below:
NH4++1.32NO2-+0.066HCO3-+0.13H+→1.02N2+0.256NO3-+0.066CH2O0.5N0.15+2.03
H2O (Eq.2.13)
As can be seen in Eq.2.13, anammox bacteria need nitrite as an electron acceptor. Thus,
combination of nitritation and anammox process is a good choice for biological nitrogen
removal. Approximately 55% of the ammonia is converted to nitrite during nitritation and
then the effluent enters the anammox process.
The possible mechanism for anaerobic ammonium oxidation is shown in Fig 2-4 [35]. Part
a in Fig 2-4 depicts the organellelike structure of the anammox microbe in which the
15
occurs. Part b in Fig 2.4 shows the anammoxosome membrane and the anammox reaction
pathway. The nitrite-reducing enzyme (NR) is on the cytoplasm side of the cell membrane.
It catalyzes the reduction of NO2− to hydroxylamine. Hydrazine hydrolase (HH) across the
cell membrane condenses hydroxylamine and ammonia to hydrazine. Hydrazine-oxidizing
enzyme (HZO) is on the anammoxosome side of the cell membrane and catalyzes
hydrazine to nitrogen. The electrons generated from these reactions are transferred back to
NR.
Figure 2-4. Mechanism of anaerobic ammonium oxidation.(adapted from [35]).
In addition to this, it has been proposed that anammox is a three-reaction process (Eqs.
2.14-2.16) [36,37]. NO2- is reduced by nitrite reductase (NirS) to NO, which subsequently
16
finally N2H4 is oxidized to N2 by hydrazine dehydrogenase/oxidoreductase (HDH/HZO).
It should be noted that the reactions only consider chemical mechanisms and neglect
biomass synthesis.
NH2OH+NH3→N2H4+H2O (Eq.2.14)
N2H4→N2+4[H] (Eq.2.15)
HNO2+4[H]→NH2OH+H2O (Eq.2.16)
NH3+HNO2→N2+2H2O (Eq.2.17)
HNO2+H2O+NAD→HNO3+NADH2 (Eq.2.18)
Partial nitrification-anammox process is also called the nitritation-anammox process. First,
around 57% of the ammonia is oxidized to nitrite by AOBs. Second, the remaining
ammonia and the nitrite are converted to nitrogen gas by anammox bacteria. The scheme
17
Figure 2-5. Partial nitrification-anammox process (adapted from [4])
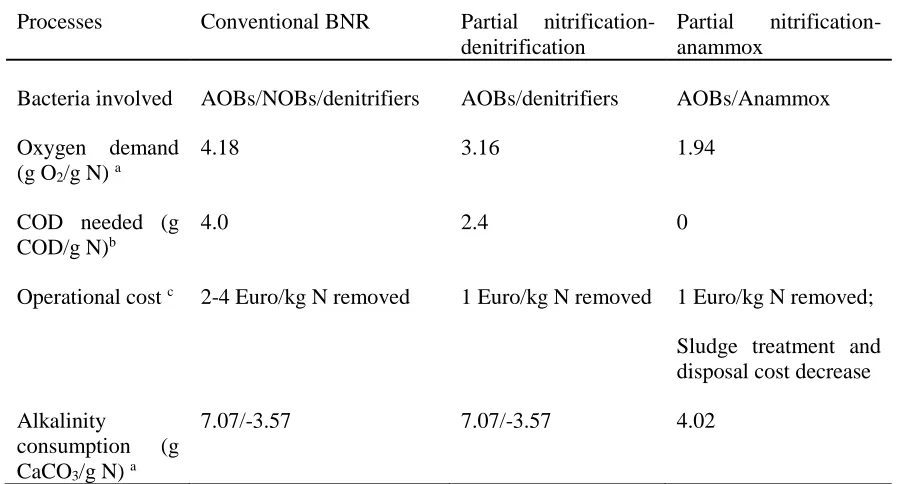
2.2.5 Comparison of N removal processes
The comparison of the three biological nitrogen removal processes is depicted below in
Table 2.2 with respect to bacteria involved, oxygen demand, COD needed, and alkalinity
consumption and operational cost. The operational cost includes the aeration tank cost, i.e.
18
Table 2-2. Comparison of N removal processes
Processes Conventional BNR Partial nitrification-denitrification
Partial nitrification-anammox
Bacteria involved AOBs/NOBs/denitrifiers AOBs/denitrifiers AOBs/Anammox
Oxygen demand (g O2/g N) a
4.18 3.16 1.94
COD needed (g COD/g N)b
4.0 2.4 0
Operational cost c 2-4 Euro/kg N removed 1 Euro/kg N removed 1 Euro/kg N removed;
Sludge treatment and disposal cost decrease
Alkalinity
consumption (g CaCO3/g N) a
7.07/-3.57 7.07/-3.57 4.02
a source:[4]
b source:[38]
c source:[39,40]
2.3
Microbiology
2.3.1 AOBs and NOBs
The most commonly recognized genus of bacteria that carries out ammonia oxidation is
Nitrosomonas while Nitrosococcus, Nitrosopira, Nitrosovibrio, and Nitrosolobus are also able to oxidize ammonia to nitrite.These five recognized genera of AOB can be divided
into two different phylogenetically distinct groups, β- and γ-subclass of Proteobacteria
19
Nitrosovibrio, and Nitrosolobus are grouped in the β- subclass while Nitrosococcus is the only one within the γ-subclass [43,44].
In the nitrite oxidation stage, several genera such as Nitrospira, Nitrospina and Nitrococcus
are known to be involved while the most famous nitrite oxidizer genus is Nitrobacter [4].
Nitrococcus and Nitrobacter are assigned to the α- and γ-subclass of Proteobacteria, respectively [45].The genus of Nitrospira is grouped closely to the δ-subclass [42].
The characteristics and environmental conditions of different autotrophic AOB and NOB
species are presented in Tables 2.3 and 2.4 [46,47].
Table 2-3. Characteristics and environmental conditions of different AOB species
Parameters Nitrosomonas Nitrosococcus Nitrosopira Nitrosolobus Nitrosovibrio Shape
Straight rods Spherical to ellipsoidal
Tightly coiled spirals
Pleomorphic lobate
Slender curved rods Size (µm) (0.7-1.5)× (1.0-2.4) (1.5-1.8)× (1.7-2.5) (0.3-0.8)× (1.0-8.0) (1.0-1.5)× (1.0-2.5) (0.3-0.4)× (1.1-3.0) pH
7.0-8.5 6.0-8.0 6.5-8.5 6.0-8.2 7.5-7.8 Temperature
(oC)
5-40 2-40 20-35 15-30 25-40
Table 2-4. Characteristics and environmental conditions of different NOB species
Parameters Nitrobacter Nitrospina Nitrococcus Nitrospira Shape Pear-shaped/
pleomorphic rods
Slender straight rods
Spherical Loosely coiled spirals
Size (µm) (0.5-0.8)× (1.0-2.0)
(0.3-0.4)× (1.7-6.6)
1.5-1.8 (0.3-0.4)× (0.8–1.0) pH 6.0-7.5 6.5-7.0 6.8-8.0 6.5-7.0 Temperature (oC) 5-30 25-30 15-30 25-30
2.3.2 Key enzymes of AOB
20
oxidoreductase (HAO), catalyze the conversion of ammonia to nitrite via NH2OH. AMO
is a membrane-bound hetero-trimeric copper enzyme, and has broad substrate ranges [48].
It is coded by three gene subunits amoC (31.4 kDa), amoA (31.4 kDa) and amoB (38 kDa)
while only a small portion of amoA acts as a function gene of AOBs [43,49,50].
Compared with AMO, HAO was isolated and studied more extensively. HAO is coded by
the gene clusters of hao (hydroxylamine oxidoreductase, 1710 bp) (Figure 2.6) [43,51].
Three copies of hao gene, that constitute 40% of the c-type heme, are contained in the
genus of Nitrosomonas europaea [52].
NirK is another enzyme found in multiple AOBs. The function of NirK was assumed to be
related to nitrite reduction, which, however, has not been confirmed [53].
Figure 2-6. Flow of energy and reductants in nitrification through pertinent
21
2.3.3 Key enzymes of NOB
The key enzyme involved in the nitrite oxidation to nitrate is nitrite oxidoreductase (NXR)
in Nitrobacter, and nitrite oxidizing system in the genera of Nitrococcus, Nitrospina, and
Nitrospira (Figure 2-6). NXR composition is quite complex. It consistes of subunits such as α-subunit, NorA (115-130 kDa), β-subunit, and NorB (65 kDa) [55]. The function of
NorA might be the acceletration of the nitrite oxidation, while NorB might work effectively
as an channeling protein between NorA and the membrane-integrated
electron-transport chain [55].
2.3.4 Kinetics of AOB and NOB
AOB and NOB kinetics, including maximum growth rate (μmax), decay rate (b), substrate
half saturation constant (Ks), oxygen half saturation constant (Ko), yield coefficient (Y), free
ammonia half-velocity constant (KiFA), and free nitrous acid half-velocity constant (KiFNA)
have been thoroughly studied due to their crucial importance in controlling and optimizing
nitrogen removal processes. However, the reported kinetic values varied in a very wide
range, as summarized in Table 2-5 and 2-6 for AOB and NOB, respectively. The big
differences result from various wastewater characteristics, reactor configurations, as well
as operational conditions.
Influent ammonia concentration affects the KiFA of AOB. In some studies, ammonia
oxidation was observed at relatively low FA concentrations (~10 mg N/L). In the study of
Abeling and Seyfried [56], nitritation inhibition was observed at 7 mg FA/L. Anthonisen
22
of 20oC, TAN of 60-3000 mg N/L). Neufeld et al. [58] and Groeneweg et al. [59] also
reported the beginning of nitritation at a FA concentration of 10 mg N/L (pH of 7-9 and 8,
temperature of 23oC and 30oC, TAN of 20-1500 mg N/L and 100 mgN/L). Jubany et al.[60]
reported a KiFA of around 7 mg N/L (pH 7.5, temperature of 25oC, TAN of 450 mg N/L).
On the contrary, there are some other studies reporting a much higher FA concentration for
nitritation inhibition. For example, nitritation was only observed at concentrations above
300 mg FA/L (pH 8, temperature of 35oC, TAN of 2500 mg N/L)[61]. Hellinga et al. [62]
found no nitritation inhibition up to 93 mg FA/L (pH 7, temperature 40oC, TAN of 5000
mg N/L). Baquerizo et al. [63] determined an FA inhibition coefficient of 116±24 mg
FA/L. The substrate inhibition constant in the study of Pambrun et al. [64] was 241 mg
FA/L (pH 8.25, temperature of 35oC, TAN of 1200 mg N/L). Acclimatization of the AOB
to high ammonia concentrations (500-1000 mg N/L) after 400 days exposure was presumed
to be the reason for the high FA inhibition constant [64]. The highest inhibition coefficient
of 605±87 mg N/L reported by Ganigue´ et al. [65] was attributed to acclimatization of the
biomass to the inhibitory effects of FA due to a long term exposure (160 days) to high
influent ammonia concentrations(518-1440 mg N/L) as well. The tolerance of NOB to FA
may be enhanced by long-term acclimatization to high FA environment. Wong-Chong and
Loehr [66] observed that the Nitrobacter could tolerate FA concentrations as high as 40 mg N/L after acclimatization to high FA for 2-3 weeks, while the unacclimated cultures
were inhibited at a FA concentrations of 3.5 mg N/L.
The effect of reactor configuration on biomass kinetics has not been confirmed yet. In the
study of Carrera et al. [67], with the same influent ammonia concentration of 1000 mg N/L,
23
from a suspended biomass system (SBS) and an immobilised biomass system (IBS) have
different μmax (0.97 vs 0.34 d-1), Ks (11 vs 28 mg N/L) and KiFA (13.9 vs 58.8 mg N/L).On
the contrary, Munz et al. [68] reported the same μmax of 0.45±0.04 d-1 and quite similar b
of 0.08±0.04 d-1 and 0.10±0.06 d-1 for biomass from a membrane biofilm reactor (MBR)
and a conventional activated sludge process (CASP) with the same influent ammonia
concentration of 35±7.7 mg N/L and the same operational conditions (SRT of 20 days,
temperature of 18-20oC and pH of 7.7±0.1 or 7.6±0.1).
Temperature traditionally was regarded as having a clear effect on the ammonia oxidation
in partial nitrification systems. Both AOB and NOB acitivity are enhanced as temperature
increases [69]. Typical temperature coefficients for μmax,AOB and μmax,NOB are 1.072 and
1.063, respectively [70]. The typical temperature coefficient for b of both AOB and NOB
is 1.04[70]. In addition, Weon et al. [71] reported that Ko,AOB andKo,NOB decreased from
1.61 mg O2/L and 1.10 mg O2/L at 5oC to 0.27 mg O2/L and 0.87 mg O2/L at 30oC, which
suggested that both Ko,AOB and Ko,NOB may decrease as temperature increase. pH affects
the activity of nitrifiers directly or indirectly through FA and FNA. The model equations
of direct pH effects on AOB and NOB by Park et al. [72] are depicted below.
μ=𝜇𝑚𝑎𝑥
2 ∙ {1 + cos [ 𝜋
𝑤∙ (𝑝𝐻 − 𝑝𝐻𝑜𝑝𝑡) (|𝑝𝐻 − 𝑝𝐻𝑜𝑝𝑡|<w)) (Eq.2.19)
μ and 𝜇𝑚𝑎𝑥 are, respectively, the maximum specific growth rate at a given pH and at the
optimal pH, d-1. w is the pH range within which the q is larger than one-half of qmax.
Besides, it has been reported that Ks of AOB is also a function of pH and the relationship
24
𝐾𝑠,𝐴𝑂𝐵 = 0.56 ∙ [ 1 1+ [𝐻+]
10−6.96
] ∙ [1 + [𝐻+]
10−9.093] (Eq.2.20)
𝐾𝑠,𝑁𝑂𝐵 = 4.018 ∙ [1 +8.04×10⁻⁹
[𝐻+] ] (Eq.2.21)
25
Table 2-5. Summary of AOB kinetic parameters from literature
Ref SRT (d)
T (oC) Reactor type DO
(mg O2/L)
pH Influent NH4+-N
(mg N/L)
μmax
(d-1)
b (d-1)
Ks (mg N/L)
Ko (mg O2/L)
Y (mg COD/ mg N) KiFA (mg N/L) KiFNA (mg N/L) Biomass type
[74] 3.0 Room CSTR 1.54±0. 87
7.5±0. 1
500 1.1±1.0 0.32±0.3 4
0.15±0. 06
S
[75] 2.4 21±2 CSTR 0.40±0. 05
7.3±0. 1
1100 0.54±0.0 9
0.20±0. 03
S
[76] 30 CSTR 7.5 28 1.45 0.14 S
[67] 23 ± 0.5 SBS 7.5 ± 0.1
1000 0.97 11 13.9 S
IBS 0.34 28 58.8 A
[77] 15 20 ASR 12 0.99 S
[60]
15-25
23±2 CSTR 3.0 7.5 3000 1.21 0.20 0.24 0.74 0.18 7.0 0.55 S
[78]
10-20
20 CSTR 2 7.0-7.5
48 ± 2 0.24 S
[79] 5-40 20 CSTR >4 7.0-7.5
24-96 0.24±0.0 1 0.066±0. 003 0.023±0. 003 S
[80] 20 SBR >2 20-200 2.16 9.3 0.21 S
[68] 20 18-20 MBR 2 7.7±0. 1
35±7.7 0.45±0.0 4
0.08±0.0 4
A 8 18-20 Conventional
activated sludge system
2 7.6±0. 1
35±7.7 0.72±0.2 0.10±0.0 6
S
20 0.45±0.0
4
[81] 5 30±0.5 SBR 3 6.5–8 800 ±50 1.00 5.1±0.4 0.34±0.0 7
S 1 35±0.5 CSTR 3 6.5–
6.7
700 ±50 2.00 5.7±0.4 0.49±0.0 6
26
[62] 1 30 CSTR 1000 2.1 0.47 1.45 0.15 0.21 S
[82] 1.47 35 CSTR 3 7.1-7.3
730 0.9 0.17 0.7 0.25 0.15 0.07 S
[83] 30 CSTR 7±0.2 0.74 2.1 0.24 S
[84] 15 21 SBR 3 50 1.40 0.12 0.80 0.18 S
[85] 2 35 CSTR 1.5-5.0 7.8-8.9
1000 1.75 0.23 0.44 0.34 24.9 0.44 S
[61] 1.54 35 CSTR 6.1 6.83 500-2000 1.0±0.2 0.75±0.0 5 0.94±0.0 91 2.04±0.0 17 S
[86] 26±0.5 SBR 0.5 or 3.5
50-65 0.46 1.4 0.307 0.37 S
[87] 9.2±
2
20 SBR 3.5 7.0 3000 0.5 0.071 1 0.5 S
[88] 22-23 SBR
7.5-8.2
150 0.11-0.28 0.33±0.0 4
S
[89]
10-40
35±2 SBR 0.15-3.0
6.7-8 90-190 0.94-0.99
0.245 0.36 S
[90] 10 14 SBR 1.0-5.5 6.6-7.3
40 0.28 0.10 1.36 S
[91] 30
or 100
30 SBR 7.5±0.
05
250 5 1 for 30
d and 3 for 100 d SRT
S
[64]
16-18
30 SBR
7.5-8.2
500-1000 1.96 0.44 0.5 0.5 0.21 241 0.053 S
[92,93] 1.68 30±1 SBR 2.8-3.3 >6.4 1000 1.02±0.1
7
0.26±0.0 7
0.36±0.0 2
0.40 S
[94] 20 20 MBR 2.5-3.0 7.5 0.13±0.0
5
0.18±0.0 4
27
CAS 0.14±0.1
0
0.79± 0.08
S
[95] 30±1 SBR 8.0 ±
0.2
3790 0.12 66 1.07 0.37 S
[96] 32.1-33.6 MBR-MBBR 0.2-0.5 or >1.5
7.8-8.2
1200-1600 0.445-0.639
A
[97] 30±1 MABR 7.2 ±
0.2
200 1.2
0.16-1.17
A
[98] 30 Biofilm 0.4-2.0 7.5 320 0.71-2.09
0.11-16 0.10-0.47
0.11-0.18
A
[99] 30 Upflow reactor
>3.8 7.3-8.0
1000 0.72 A
[100] 20 20 MBR 2.5-3 7.2±0.
1
0.42±0.1 1
A
CAS 0.65±0.0
15
S
[101] 20 Biofilm 8.8 7.5-8 1.08 18 0.176 0.119 0.271 A
[102] 23±1 Airlift 7.5±
0.1
180 11±5 63.5 ±
26.9
A
[103] 20 1.023 0.15 1.5 0.50 0.47
[104] 20
0.20-0.90
0.05-0.15 0.5-1.0 0.40-0.60
[105] 20 1.0 0.15 1 0.5
[106] 20 20 SBR 18 0.63 0.061 0.5 0.1 S
[107]
10-15
20 AAO 2.5 34 0.48 0.175 S
[108] 122 28-32 SBR >2.0
7.9-8.7
500 and 1000
53 ± 6 1.35 ± 0. 24
S
[109] 10 Airlift reactor 0.5-2.5 8.0 ± 0.1
70 0.63 ± 0.05
2.1 ± 0.7 A
28
[110] CSTR 3.0–3.3 0.42 0.01 3.5 0.10
[111] 12 35±0.5 SBR 0.5- 3.0 >7.2 300 2.04 4 0.15 S
[112,1 13]
31 ± 7
30 SBNR >2.0 or <1.0
8.0 1000 25-33
15.1-22.3
0.168 S
WWTP 37-51 5.0
-5.2
SBR
6.3-8.0
100 24-37
22.0-27.3
[114] 30 MBBR 7.55 ±
0.61
7-8 50 8.8 A
7.64 ± 0.47
1 1.2
[59] 20
and 30
CSTR 8.00±0. 02
392 0.52 0.09 S
[71] 5-30 SBR 2-3 31-335
0.27-1.63
S
[115] 35 Continuous
fermenter
7.5 100-300 0.61-2.5 S
[116] 4, 7 and 10
25 Activated sludge reactor
0.2-1.7 S
[117] Activated
sludge reactor
4 36 S
[65] 5 36±1 SBR 2 6.8-7.1
518-1440 605.48
±87.18 0.49±0.0 9 S [118] 10-40
20 SBR >2.0 6.0-8.0
226-1176 0.32±0.0 5
29
Table 2-6.Summary of NOB kinetic parameters from literature
References SRT (d)
Temperat ure (oC)
Reactor type
DO (mg O2/L)
pH Influent nitrogen concentrat ion (mg N/L)
μmax
(d-1)
b (d-1)
Ks (mg N/L)
Ko (mg O2/L)
Y (mg COD/m g N) KiFA (mg N/L) KiFNA (mg N/L) Bioma ss type
[119] 30 7.6 1.6 0.189 S
[74] 3.0 Room CSTR 1.54±0. 87
7.5±0. 1
500 2.6±2.0 5
1.7±1.9 0.04±0. 02
S
[75] 21±2 SBR 3.0±0.2 5
7.3±0. 1
1000 0.67±0. 03
0.10±0. 01
S
[67] 23 ± 0.5 SBS 7.5 ± 0.1
1000 0.24 1.6 0.06 S
IBS 4.1 0.35 A
[77] 15 20 Activat ed sludge reactor
3.53 1.40 S
[120] 20 “Fed
batch” ferment or
>6 200 0.33 0.14 0.015 S
[78]
10-20
20 CSTR 2 7.0-7.5 48 ± 2 0.08 S
[79] 5-40 20 CSTR >4 7.0-7.5 24-96 0.18±0. 01 0.045±0. 006 0.023±0. 001 S
[80] 20 SBR >2 20-200 2.64 4.85 0.05 S
[68] 20 18-20 MBR 2 7.7±0. 1
35±7.7 0.41±0. 06
0.11±0.0 5
A 8 18-20 CASP 2 7.6±0.
1
35±7.7 0.42±0. 03
0.11±0.0 2
S 20
30
[82] 1.47 35 CSTR 3 7.1-7.3 730 0.7 0.17 0.05 0.5 0.09 1.05 S
[83] 30 CSTR 8 0.86 1.89 0.20 S
[84] 15 21 SBR 3 50 0.65 0.12 0.50 0.06 S
[85] 2 35 CSTR 1.5-5.0 7.8-8.9 1000 0.56 0.04 0.02 0.73 14.8 2.31 S
[87] 9.2±
2
20 SBR 3.5 7.0 3000 0.56 0.08 3 1 S
[88] 3-5 22-23 SBR 7.5-8.2 150 9.59 ± 1.42 0.36±0. 02 S [89] 10-40
35±2 SBR 0.15-3.0
6.7-8 90-190 2.25-2.51
0.245 0.54 S
[90] 10 14 SBR 1.0-5.5 6.6-7.3 40 0.38 0.10 2.79 S
[91] 30
or 100
30 SBR 7.5±0. 05
250 2 1 S
[64]
16-18
30 SBR 7.5-8.2 500-1000 0.67 0.38 1.62 1 0.03 11.1 S
[121,122] 22±1 SBR 2.8-3.3 7.3 1000 0.48±0.
07
0.069±0. 004
1.49±0.0 8
0.018 S
[94] 20 20 CAS 2.5-3.0 7.5 0.17±0.0
6
0.13±0. 06
S
MBR 0.28±0.2
0
0.47±0. 04
A
[96] 32.1-33.6 MBR-MBBR
0.2-0.5 or >1.5
7.8-8.2 1200-1600 0.312-0.575
A
[97] 30±1 MABR 7.2 ±
0.2
200 1
1.15-4.65
A
[98] 30 Biofilm 0.4-2.0 7.5 320 0.43-1.92 0.11-38.28 0.10-0.37 0.11-0.21 A
[100] 20 20 MBR 2.5-3.0 7.5 0.28±0.
05
A
31
07
[101] 20 Biofilm 8.8 7.5-8 1.53 5.04 0.544 0.0208 A
[102] 23±1 Airlift 7.5±
0.1
180 4.1 ± 0.9 0.35 ±
0.04
A
[123] 22 MABR 2.2-5.5
0.28-0.31
0.27-0.39 0.4-0.51
A
[103] 20 1.079 0.15 2.70 0.68 0.12
[104]
0.20-0.90
0.05-0.15 0.5-1.0 0.40-0.60
[105] 1.0 0.15 1 0.5
[106] 20 20 SBR 18 1.05 0.061 0.5 0.14 S
[112,113] 31 ±
7
30 SBNR >2.0 or <1.0
8.0 1000 11.6-11.9
0.19-0.97
S
WWTP 7.8-10.2
0.09-0.11
SBR 6.3-8.0 100 23.3-28.3
0.10-0.32
[114] 30 MBBR 7.55 ±
0.61
7-8 50 2.57 S
7.64 ± 0.47
1 1.34
[71] 5-30 SBR 2-3 31-335
0.87-1.10
S
[118]
10-40
32
2.3.5 Anammox bacteria
Five anammox bacteria, tentatively named Candidatus Brocadia, Candidatus Kuenenia, Candidatus Jettenia, CandidatusScalindua and Candidatus Anammoxoglobus, were found to
carry out anaerobic ammonium oxidation [124].The first three exist commonly in freshwater
ecosystems [125] and bioreactors [126], while the fourth genera is the only marine anammox
[33].
2.4
Strategies for achieving partial nitrification
In the partial nitrification process, nitrite accumulation is required, and the second step must
be restrained to accumulate AOB and washout NOB [127]. To date, researchers have developed
many control methods and strategies to achieve and maintain partial nitrification. These
methods mainly include appropriate regulation of temperature, pH, dissolved oxygen (DO)
concentration, sludge retention time (SRT), operational and aeration pattern, inhibitors, etc
[40,128,129]. These various parameters will be elaborated on below.
2.4.1 DO concentration
In addition to other substrates, like ammonia nitrogen for AOB and nitrite nitrogen for NOB,
DO is also an substrate for both AOB and NOB. With low DO concentration, both AOB and
NOB growth rates are reduced [5]. It is generally accepted the oxygen Monod half saturation
constant for AOB (KO,AOB) is lower than for NOB (KO,NOB) [130,131], which means that AOB
33
of AOB and NOB are 0.2-0.5 mg/l and 0.7-2.0 mg/l, respectively [99,104,132]. Thus, when
competing for DO, NOB are often at a disadvantage. For example, one study reported that the
AOB growth rate was 2.6 times faster than NOB at a low DO level (<1.0 mg/L) [133]. It was
suggested that DO concentration should be maintained about 1.0–1.5 mg/L, considering both
ammonia oxidation rate and nitrite accumulation [26].
However, the suitable DO concentration for achieving partial nitrification varied in a wide
range (0.16-5.0 mg/L) in different studies due to different operational conditions [134].
Yamamoto et al. [135] achieved 93% nitrite accumulation at a high DO of 5 mg/L at 25oC in
an upflow column reactor with carrier media while Chuang et al., [136] reported that over 90%
nitrite accumulation was achieved at a low DO of 0.16-0.2 mg/L at 30 oC in a closed
down-flow hanging sponge reactor . Below 0.5 mg/l of DO, ammonia accumulated and over 1.7 mg/L
complete nitrification to nitrate was achieved [137].
2.4.2 Temperature
With temperature increase, both AOB and NOB growth rates increase. Nitrification usually
proceeds better in warmer seasons. The ammonia removal efficiency was more than 80% at 25
°C decreasing to below 30% at 15 °C and lower [138]. It has been reported that AOB could
outcompete NOB at higher temperature while NOB are able to oxidize nitrite much faster at
lower temperature [139]. The typical growth rate curves of AOB and NOB with temperature
were developed by Zhu et al. [69], as depicted in Figure 2-7. Nitrite accumulation in an
34
raising temperature to a range between 20 °C and 25 °C enhanced the ammonia oxidation
activity while decreasing the nitrite oxidation activity [141]. Besides, a decrease in nitrate
concentration was observed with a simultaneous increase in the nitrite concentration in an
inverse turbulent bed reactor upon increasing the temperature from 30 °C to 35 °C [142]. It
should be noted that partial nitrification could still be achieved at low temperatures if the
operational conditions for AOB to outcompete NOB, i.e. DO, pH, FNA, FA, were prevalent
[47].
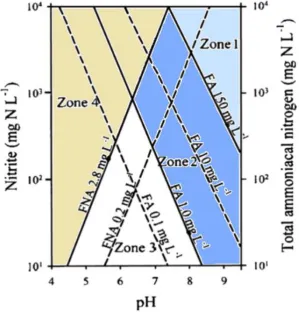
35
2.4.3 pH and free ammonia and nitrous acid concentrations
pH affects the activities of AOBs and NOBs directly by changing the enzymatic reaction
mechanism [72] or indirectly through free ammonia (FA) and free nitrous acid (FNA) [62,112].
The optimum pH for both AOBs and NOBs lies between 7 and 8. The growth rate of NOBs
decreased from 0.17 d-1 at pH 7 to 0.02 d-1 pH 8 while the variation in the growth rate of AOBs
at these pH values was negligible [143]. Thus, pH control is commonly used as a strategy to
achieve partial nitrification.
The direct pH effect on the maximum specific substrate utilization rate of AOB or NOB had
been considered in different models from literature. The equations suggested by US EPA [3],
Siegrist and Gujer [144], and Park et al. [72] are listed as Eq.2.22-2.23, and Eq.2.17,
respectively.
μ = μ7.2∙ [1 − 0.833(7.2 − pH)] (Eq.2.22)
in which μ and μ7.2 are the maximum specific cell-growth rate at any pH and pH 7.2,
respectively, d-1.
μ = μmax∙ [1 + 10(6.5−pH)] −1
(Eq.2.23)
FA and FNA are determined by pH, temperature, ammonia, or nitrite levels (Eqs. 2.24-2.25,
respectively) [57].
FA =17
14∙
𝑇𝐴𝑁∙
![Figure 2-4. Mechanism of anaerobic ammonium oxidation.(adapted from [35]).](https://thumb-us.123doks.com/thumbv2/123dok_us/1931725.1253724/37.612.123.527.282.552/figure-mechanism-of-anaerobic-ammonium-oxidation-adapted-from.webp)
![Figure 2-5. Partial nitrification-anammox process (adapted from [4])](https://thumb-us.123doks.com/thumbv2/123dok_us/1931725.1253724/39.612.177.440.74.334/figure-partial-nitrification-anammox-process-adapted.webp)


![Figure 2-7. Effect of temperature on growth rate of AOB and NOB (adapted from [69])](https://thumb-us.123doks.com/thumbv2/123dok_us/1931725.1253724/56.595.143.463.332.587/figure-effect-temperature-growth-rate-aob-nob-adapted.webp)