Self-Adaptive Dynamic Differential Evolution Applied to BER
Reduction with Beamforming Techniques for Ultra
Wideband MU-MIMO Systems
Chien-Ching Chiu*, Guan-Da Lai, and Yu-Ting Cheng
Abstract—This paper introduces an Ultra-Wideband (UWB) circle antenna array with beam forming techniques that combine Self-Adaptive Dynamic Differential Evolution (SADDE) which is capable to minimize the Bit Error Rate (BER) for Multi-User Multiple Input Multiple Output (MU-MIMO) in indoor communication system. By using the ray tracing techniques to compute any given indoor wireless environment, the impulse response of the system can be calculated, and the BER can be computed accordingly. Next, we analyze the BER performance of the UWB MU-MIMO system that applies beam forming for spatial division multiple accesses. Numerical results show that the SADDE can control the antenna feed length to reduce the BER and form the radiation beam pattern towards the direction of the desired signals while forming nulls to co-channel interferers for MU-MIMO system.
1. INTRODUCTION
How to improve the quality of communication and reduce the cost of communication have become popular research topics in the wireless personal network. It is expected that a combination of ultra-wideband systems and multi-antenna system can increase the transmission data rate. The UWB technology has the advantages of high-speed transmission, low transmit power, low duty cycle, low cost, simple transceiver structures, and less interference to other applications. UWB is a valuable technology for future wireless applications such as indoor communication and Intra-Vehicular Wireless Sensor Network (IVWSN) [1–5].
The smart antenna uses beam-synthesizing technology to generate a narrow beam in a specific direction for transmitting signals [6–9]. As a result, the radiation power of the antenna is not wasted in the side lobe direction, and the same frequency interference between different users is reduced. Therefore, the user terminal will receive signals with concentrated directions and higher power. Moreover, the smart antenna can synthesize a narrow beam with a higher antenna gain to the user. It can extend the communication distance between the user and the base station, and increase the coverage of the base station. Besides, when the channel capacity increases, more users can be provided with the same data transmission rate.
In MU-MIMO systems, the deployment of UWB circle antenna arrays on the transmitter and receiver sides is apparently synthesizing the transmit and receive beams, along with an increment in beamforming gain and a decrement in the co-channel interference and interuser interference (IUI) [10– 14].
In the past, most papers apply differential algorithms to search for minimum sidelobes level of the antenna. However, this pattern cannot guarantee the minimum BER. To the best of our knowledge, there is no numerical report for MU-MIMO UWB systems by SADDE approach. In this paper we
Received 23 August 2018, Accepted 2 October 2018, Scheduled 15 October 2018
* Corresponding author: Chien-Ching Chiu ([email protected]).
control the feed length of the array element on the transmitter and receiver by SADDE algorithm to reduce BER for indoor MU-MIMO system.
2. SYSTEM DESCRIPTION
2.1. Circular Array Pattern
A circular array of N UWB antennas is used in the transmitter and receiver. The array factor of this circular antenna array can be written as
AF(θ, φ, f) =
N
n=1
Inejαn(f)ejkasinθcos(φ−φn) (1)
whereθ and φare the spherical coordinate angles. φn is the azimuth angle for the antenna elementn.
f is the frequency of a sinusoidal wave. N is the number of elements. In and αn(f) are the excitation
current and the phase delay in different frequency for the n-th element respectively. k = 2π/λ is the wave number andais the radius of the circle array.
In this research, we exploit 8 antenna elements at the transmitter and receiver to synthesize the radiation pattern in order to reduce the BER. Each element is apart with a circle of radiusa= 6.75 cm with spaced 5 cm, which is corresponding to the half wavelength of 3 GHz. Each element is the UWB antenna in [15, 16].
According to (1), the array factor of 8 antenna elements in the transmitter can be derived to the following equation:
AFt(θt, φt, f) = It1ejαt1ejkasinθtcos(φt−0)+It2ejαt2ejkasinθtcos(φt−
π
4) +It3ejαt3ejkasinθtcos(φt−π2)+It4ejαt4ejkasinθtcos(φt−34π) +It5ejαt5ejkasinθtcos(φt−
4
4π)+It6ejαt6ejkasinθtcos(φt− 5 4π)
+It7ejαt7ejkasinθtcos(φt− 6
4π)+It8ejαt8ejkasinθtcos(φt− 7
4π) (2)
The receiver also makes use of the 8 antenna elements with the same angles as the transmitter. The array factor of the receiver can be expressed as:
AFr(θr, φr, f) = Ir1ejαr1ejkasinθrcos(φr−0)+Ir2ejαr2ejkasinθrcos(φr−
π
4) +Ir3ejαr3ejkasinθrcos(φr−π2)+Ir
4ejαr4ejkasinθrcos(φr− 3 4π)
+Ir5ejαr5ejkasinθrcos(φr− 4
4π)+Ir6ejαr6ejkasinθrcos(φr− 5 4π)
+Ir7ejαr7ejkasinθrcos(φr−64π)+Ir
8ejαr8ejkasinθrcos(φr− 7
4π) (3)
Thus, the total radiation vector for the transmitter and the receiver can be expressed as:
Nt(θt, φt, f) = AFt(θt, φt, f)·Ne(θt, φt, f) (4a)
Nr(θr, φr, f) = AFr(θr, φr, f)·Ne(θr, φr, f) (4b)
Ne(θt, φt, f) andNe(θr, φr, f) are the radiation vectors of the individual element for the transmitter
and the receiver that can be computed by high frequency structure simulation [17].
2.2. UWB Channel Modeling
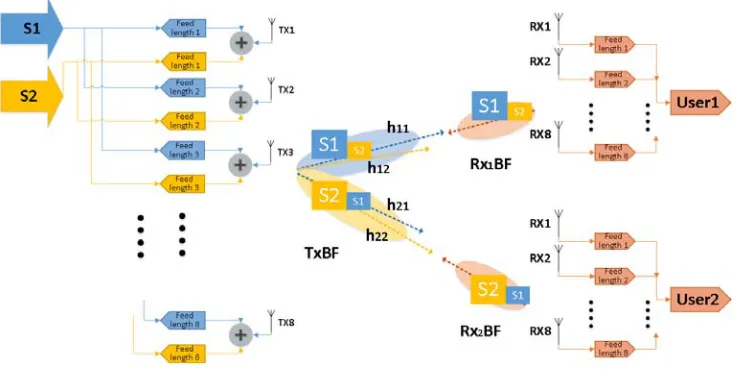
Two different signals, S1 and S2, are simultaneously transmitted for user1 and user2 respectively, in the MU-MIMO system as shown in Fig. 1. The circle antenna array in the transmitter and receiver utilizes beam-forming techniques through the SADDE algorithm to form the radiation pattern towards the desired signals while forming nulls to co-channel interferers. Note that the beam forming techniques are used for both the transmitter and receiver.
Figure 1. UWB multi-user system.
Step1: The SBR/Image method can deal with high frequency radio wave propagations in the complex indoor environments [18, 19]. It conceptually assumes that many triangular ray tubes are shot from the transmitting antenna (Tx). Each ray tube, bouncing and penetrating in the environments, is traced in the indoor multi-path channel. If the receiving antenna (Rx) is within a ray tube, the ray tube will have contributions to the received field and the corresponding equivalent source (image) can be determined. By summing all the contributions of these images, we can obtain the total received field at the Rx. Note that the different values of dielectric constant and conductivity of materials for different frequency are carefully considered in the channel modeling.
Step2: Inverse Fast Fourier Transform (IFFT) and Hermitian processing. By means of inverse fast Fourier transform, it is possible to convert the data in the frequency domain into time domain data in the wideband frequency systems [20]. The Hermitian method and the discrete fast inverse Fourier transform are used to convert the channel frequency response into a discrete time domain function, i.e., the ultra-wide band impulse responseh(t).
2.3. Formulation of BER for MU-MIMO
The entire link is shown in the block diagram of Fig. 2. The transmitted signal is the following:
Si(t) = N−1
n=0
p(t−nTb)di,n (5)
where p(t) is the transmitted Gaussian waveform with variance σ2, and di,n∈ {±1} is an independent
identical distributed (i.i.d.) symbol for the i-th user. Tb is the duration of the transmitting signal.
The received signalsruser1(t) and ruser2(t) can be expressed as follows:
ruser1(t) = [S1(t)⊗h11(t) +S2(t)⊗h12(t)] +n1(t)
= N−1
n=0
d1,np(t−nTb)⊗ K11
k=1
(α11)kδ(t−kτ)+ N−1
n=0
d2,np(t−nTb)⊗ K12
k=1
(α12)kδ(t−kτ)
+n1(t)
= N−1
n=0 K11
k=1
d1,n(α11)kp(t−nTb−kτ)+ N−1
n=0 K12
k=1
d2,n(α12)kp(t−nTb−kτ)
+n1(t)
=
N−1
n=0
K 11
k=1
d1,n(α11)kp(t−nTb−kτ)+ K12
k=1
d2,n(α12)kp(t−nTb−kτ)
Figure 2. Block diagram of the simulated system.
ruser2(t) = [S1(t)⊗h21(t) +S2(t)⊗h22(t)] +n2(t)
=
N−1
n=0
K 21
k=1
d1,n(α21)kp(t−nTb−kτ)+ K22
k=1
d2,n(α22)kp(t−nTb−kτ)
+n2(t) (7)
whereS1(t) andS2(t) are the transmitted signals;hij is the impulse response of the equivalent baseband
for thei-th user;jtransmitted signalSj·⊗denotes convolution operation;n1(t) andn2(t) are the white
Gaussian noise with zero mean and varianceN0/2. The correlation receiver correlates the received signal
with the following:
qi(t) =p(t−nTb−τˆi), (8)
where ˆτi is the delay time of the wave for the useri. The output of the correlation att=nTb is [20–22].
Zuser1(n)=
Tb
ruser1(t)q1(t)dt
= Tb ⎧ ⎨ ⎩
N−1
j=0
K11
k=1
d1,j(α11)kp(t−jTb−kτ)+ K12
k=1
d2,j(α12)kp(t−jTb−kτ)
+n1(t)
⎫ ⎬ ⎭
×p(t−nTb−τˆ1)dt
=
N−1
j=0 Tb K 11 k=1
d1,j(α11)kp(t−jTb−kτ)p(t−nTb−τˆ1)+ K12
k=1
d2,j(α12)kp(t−jTb−kτ)p(t−nTb−τˆ1)
dt
+
Tb
n1(t)p(t−nTb−τˆ1)dt=V1(n) +W1(n) (9)
Zuser2(n)=
Tb
ruser2(t)q2(t)dt
=
N−1
j=0 Tb K 21 k=1
d1,j(α21)kp(t−jTb−kτ)p(t−nTb−τˆ2)+ K22
k=1
d2,j(α22)kp(t−jTb−kτ)p(t−nTb−τˆ2)
dt
+
Tb
n2(t)p(t−nTb−τˆ2)dt=V2(n) +W2(n) (10)
The conditional error probability of the n-th bit is thus expressed by:
Pe1
Zuser1(n)|
d1n,
d2n
= 1
2erf c
V1n √
2σ ·d1n
Pe2
Zuser2(n)|
d1n,
d2n
= 1
2erf c
V2n √
2σ ·d2n
(11b)
where erf c(x) = (2/√π)x∞e−y2dy is the complementary error function, and
din ={di1, di2, . . . , diN}
is the binary sequence fori= 1 or 2. The average BER1 for user1 and BER2for user2 can be expressed
as [21, 22]
BER1 =
22N
n=1
p(d1n,
d2n)·1
2erf c
V1n √
2σ ·d1N
(12a)
BER2 =
22N
n=1
p(
d1n,
d2n)·1
2erf c
V2n √
2σ ·d2N
(12b)
3. SELF-ADAPTIVE DYNAMIC DIFFERENTIAL EVOLUTION
The SADDE is based on the DDE scheme with the ability to automatically adjust the scaling factors without increasing the time complexity [23–25]. The SADDE algorithm starting from the initial population consists of a randomly generated set of individual coordinates that represent each location of the transmitter antenna. SADDE algorithm contains the following steps:
Step 1: According to the problem, initialize the population of a set of D-dimensional vectors in the starting population, parameter space is {Xi :i= 1, 2, . . . , Mp}, where D is the number of parameters
to be optimized, andMp is the population size.
Step 2: Evaluate the objective function for each individual in the population.
Step 3: The mutation operation is performed by an arithmetic combination of individuals. Each trial vector Vig+1 is generated from the parent’s generation parameter vector Xig according to the
following equation:
(Vg+1i )j = (Xgi)j +αgi ·[(Xgbest)j−(Xgi)j] +βig·[(Xmg)j−(Xgn)j] (13)
m, n∈[0, Mp−1], m=n
whereαgi andβgi are the scaling factors associated with the vector differences (Xbestg −Xig) and (Xmg−Xng),
respectively. The disturbance vectorV of the mutation mechanism consists of the parameter vectorXig,
the best particleXbestg and two randomly selected vectors,αgi and βig, which are adjusted automatically.
Control parameters in SADDE continue to evolve from generation to generation. The new vector is generated by using the evolution values of the control parameters. During the selection process, these new carriers have a better chance of surviving and passing the improved control parameters to the next generation. Each generation’s control parameters for each individual here are self-adjusting according to the following scheme
αg+1
i =
αl+rand1∗αu, if rand2 <0.1
αgi, otherwise
(14)
βig+1 =
βl+rand3∗βu, if rand4<0.1
βig, otherwise
(15)
whereαl andβlare the lower limits ofα andβ, and their values are set to 0.1. αu andβu are the upper
limits of α and β, and their values are set to 0.9 [24, 32]. rand1, rand2, rand3, and rand4 are random numbers with values uniformly distributed between 0 and 1.
Step 4: Perform crossover operations to increase the diversity of parameter vectors. The cross vector ui is replaced by the current vector Xig or trial vector Vi based on the probability of crossover
Crsgi. It can be expressed as:
(ug+1i )j =
(Vig+1)j, κ(j)< Crsgi
(Xig)j, κ(j)≥Crsgi
(16)
Crsg+1
i =
rand5, if rand6 <0.1
whereκ(j) is the random number generated uniformly between 0 and 1. Crsgi is the crossover probability,
Crsgi ∈ (0,1). Rand5 and rand6 are the random numbers with values uniformly distributed between
0 and 1. Crsgi is the crossover probability, Crsgi ∈(0,1). The bigger the value of Crsgi is, the quicker
the termination criteria can be reached. However, a smaller value ofCrsgi increases the diversity of the
parameter vectors.
Step 5: The selection operation is used to generate the offspring. Compare the parent vector
Xig with the cross vector ug+1i and select the vector with smaller objective function value as the next
generation member. The selection operation is shown below:
Xig+1 =
ug+1i , if OF(ug+1i )< OF(Xgi)
Xig, otherwise (18)
SADDE is a self-adaptive evolutionary algorithm. That is, if we find that the offspring has a better objective function value than its parent, then we use this offspring individual to replace the parent. If the individual in the offspring meets the termination criteria, stop this process and get the best individual, otherwise return to step 2 to continue the entire cycle.
In the synthesis procedure, the SADDE algorithm is used to minimize the following fitness function (OF):
OF = BER1+BER2
2 , (19)
where OF is the average BER for the B-PAM impulse radio UWB system for user1 and user2.
4. NUMERICAL RESULTS
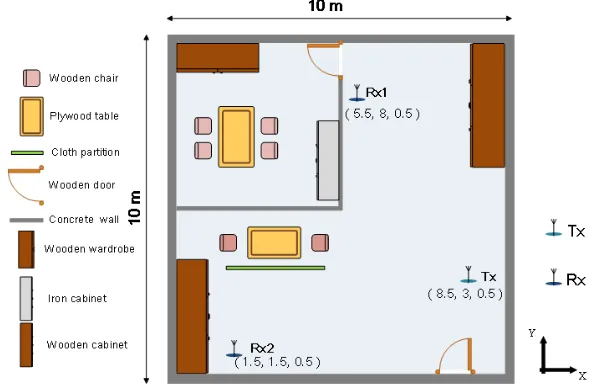
The channel impulse responses from 3 GHz to 7 GHz with frequency interval of 5 MHz, i.e., 801 frequency components are computed by ray-tracing techniques. Fig. 3 shows the top view of the indoor simulated environment with 10 m (Length)×10 m (Width)×3 m (Height) dimension. The floors and the ceilings with 0.5 m thickness are both made by concrete materials. The simulated environment includes the concrete wall, wooden chair, wooden wardrobe, wooden cabinet, plywood table, iron cabinet and cloth partitions of various sizes.
The transmitting and receiving antennas are both UWB antennas, and they are vertically polarized. The center of the transmitting antenna array is located at Tx (8.5, 3, 0.5) m with a fixed height of 0.5 m. The centers of the receiving antenna array are located at Rx1 (5.5, 8, 0.5) m and Rx2 (1.5, 1.5, 0.5) m with a fixed height of 0.5 m for user1 and user2 respectively. Furthermore, we set up the circular antenna of 8 UWB antennas. Each antenna element excitation current is 1 A for the transmitter and receiver. The space between the adjacent antenna elements is 5 cm in our simulation.
Figure 4. The fitness value versus generations.
(a) (b)
(c)
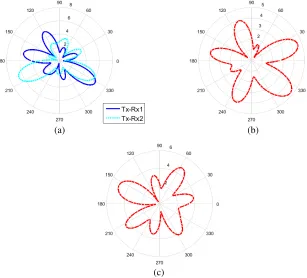
Figure 5. (a) The radiation pattern inx-yplane at the 500-th generation for Tx to Rx1 and Rx2. (b) The radiation pattern in x-y plane at the 500-th generation for Rx1 to Tx. (c) The radiation pattern inx-y plane at the 500-th generation for Rx2 to Tx.
For minimizing the BER performance and apparently synthesizing the radiation pattern of the directional array, SADDE is used to regulate the range of each feed length, 0–10 cm for the antenna element. In our research, the objective function is the average BER. The limit of generation is set at 1000, i.e., when the generation is beyond 1000, the algorithm will be terminated. The relative parameter for SADDE is as follows: the population size is 120 and the crossover probability is 0.8.
Table 1. The feed length of 8 antenna elements for the transmitter and receivers at the 500-th generation.
Table 2. The feed length of 8 antenna elements for the transmitter and receivers at the 1000-th generation.
generations, and the vertical axis is the objective value which is equal to the summation of BER1+BER2 2 from SNRt = 20 dB to SNRt = 40 dB. Here SNR is defined as the ratio of the transmitted power to the noise power at the receiver side. We found that the fitness value at 1000th generation is 0.73. This result shows clearly that the objective value decreases with generations.
In this paper, we plot the results at the 500th generation, and then compare them with the results of the last generation (1000) during the searching process of SADDE. We investigate the ability of SADDE to control the antenna feed length and decrease the BER by forming beams towards the desired signals and forming nulls to the co-channel interferers.
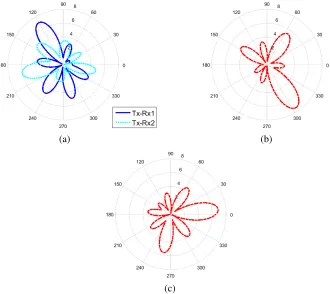
Table 1 and Table 2 show the feed length of antennas for both the transmitter and receiver at the 500th and 1000th generations, respectively. Fig. 5 illustrates the radiation patterns for (a) Tx to Rx1 and Rx2 for user1 and user2, (b) Rx1 to Tx, (c) Rx2 to Tx in the x-y plane at the 500th generation. Fig. 6 displays the radiation patterns for (a) Tx to Rx1 and Rx2 for user1 and user2, (b) Rx1 to Tx, (c) Rx2 to Tx in the x-y plane at the 1000th generation. We can find the Tx transmit desired signal (S1) to Rx1. The radiation pattern of the transmitter points to Rx1 at about 121 degrees while the radiation pattern of Rx1 points to the transmitter is about 301 degrees. Moreover, Tx transmits desired signal (S2) to Rx2. The radiation pattern of Rx2 points to the transmitter at about 12 degrees and the radiation pattern of the transmitter points to the Rx2 at about 192 degrees. In conclusion, based on the result at the 1000-th generation, it is clear that SADDE has adjusted the Tx antenna main beam towards the desired user and reduced the interference to the other user at 1000th generation. It also shapes the radiation patterns of Rx1 and Rx2 to the direction of the desired signal and beam forming the nulls to co-channel interference.
Figures 7(a) and 7(b) are the BER1 and BER2 performance at the 500th and 1000th generations
from SNRt = 20 dB to SNRt = 40 dB. It is found that the multipath effects and the co-channel
interference have been minimized at the 1000th generation. And the BER1 and BER2 are smaller
(a) (b)
(c)
Figure 6. (a) The radiation pattern in the x-y plane at the 1000-th generation for Tx to Rx1 and Rx2. (b) The radiation pattern in thex-yplane at the 1000-th generation Rx1 to Tx. (c) The radiation pattern in the x-y plane at the 1000-th generation Rx2 to Tx.
(a) (b)
Figure 7. (a) The BER1 versus SNRt at the 500-th and 1000-th generations. (b) The BER2 versus
5. CONCLUSIONS
A study of the ultra-wideband circle antenna array with beamforming techniques to minimize the BER for MU-MIMO communication system has been presented in this paper. The SADDE algorithm minimizes the objective function by adjusting the feed length of each antenna element. This technique preserves a desired signal by pointing the main beam in the desired direction while eliminating an interference signal by creating nulls in other directions. Numerical results show that at the termination generation, the SADDE has successfully controlled the antenna feed length to reduce the BER for MU-MIMO system. This enables low co-channel interference and high antenna gain to the desired signal.
REFERENCES
1. Asif, H. M., B. Honary, and H. Ahmed, “Multiple-input multiple-output ultra-wide band channel modeling method based on ray tracing,” IET Communications, Vol. 6, No. 4, 1195–1204, 2012. 2. Allam, A. M. M. A., S. Botros, A. M. G. Hemdan, and K. M. Ahmed, “Different channel
models capacity calculations for different UWB MIMO antenna systems,”Proc. IEEE Antennas&
Propagation Conf., 1–5, Loughborough, UK, Nov. 2016.
3. Pauline, S. S. and C. V. Lakshmi, “Evaluation of BER and capacity for ultra wide band communication receivers,” Proc. IEEE Information Communication and Embedded Systems, 1–5, Chennai, India, Feb. 2015.
4. Sharma, S., V. Bhatia, and A. Gupta, “Sparsity based UWB receiver design in additive impulse noise channels,” Proc. IEEE Signal Processing Advances in Wireless Communications, 1–5, Edinburgh, UK, Aug. 2016.
5. Abdallah, A. B., A. Zribi, A. Dziri, F. Tlili, and M. Terr´e, “Ultra wide band audio visual PHY IEEE 802.15.3c for SPIHT-compressed image transmission,”Proc. IEEE Signal, Image, Video and Communications, 59–64, Tunis, Tunisia, Apr. 2017.
6. Mehrotra, R. and R. Bose, “Green design for smart antenna system using iterative beamforming algorithms,” IEE Computing, 525–529, Mar. 2015.
7. Rothna, P., B. W. Ku, K. S. Kim, and Y. S. Cho, “Receive beamforming techniques for an LTE-based mobile relay station with a uniform linear array,” IEEE Transactions on Vehicular Technology, Vol. 64, No. 7, 3299–3304, Jul. 2015.
8. Jain, M. and R. P. Agarwal, “Capacity & coverage enhancement of wireless communication using smart antenna system,” IEEE Advances in Electrical, 310–313, Aug. 2016.
9. Chien, W., C. C. Chiu, Y. T. Cheng, S. H. Liao, and H. S. Yen, “Multi-objective optimization for UWB antenna array by APSO algorithm,” Telecommunication System, Vol. 64, No. 4, 649–660, Apr. 2017.
10. Salameh, H. B. and T. Hailat, “Iterative beam forming algorithm for improved throughput in multi-cell multi-antenna wireless systems,”IET Communications, Vol. 9, No. 13, 1619–1626, 2015. 11. Pec, R., B. W. Ku, K. S. Kim, and Y. S. Cho, “Receive beamforming techniques for an LTE-based mobile relay station with a uniform linear array,” IEEE Transactions on Vehicular Technology, Vol. 64, No. 7, 3299–3304, Jul. 2015.
12. Guo, L., H. Deng, B. Himed, T. Ma, and Z. Geng, “Waveform optimization for transmit beamforming with MIMO radar antenna arrays,”IEEE Transactions on Antenna and Propagation, Vol. 63, No. 2, 543–552, Feb. 2015.
13. Ni, Y. Y., S. Jin, W. Xu, Y. Y. Wang, M. Matthaiou, and H. B. Zhu, “Beamforming and interference cancellation for D2D communication underlaying cellular networks,” IEEE Transactions on Communications, Vol. 64, No. 2, 832–846, Feb. 2016.
15. Manisha, K. and B. Ravinder, “Design of microstrip patch antenna for ultra wide band applications,” International Journal of Recent Advances in Science & Engineering, Vol. 1, No. 1, Mar. 2015.
16. Talom, F. T., B. Uguen, L. Rudant, J. Keignart, J. F. Pintos, and P. Chambelin, “Evaluation and characterization of an UWB antenna in time and frequency domains,” Proc. IEEE International Conference on Ultra-Wideband, 669–673, Sept. 2006.
17. Li, Z. X. and Y. Q. Jin, “Numerical simulation of bistatic scattering from fractal rough surface in the finite element method,” Science in China (Series E), Vol. 44, 1218, 2001.
18. Chen, S. H. and S. K. Jeng, “An SBR/Image approach for indoor radio propagation in a corridor,”
IEICE Trans. Electron., Vol. E78-C, 1058–1062, 1995.
19. Chen, S. H. and S. K. Jeng, “SBR/Image approach for indoor radio propagation in tunnels with and without traffic,” IEEE Transactions on Vehicular Technology, Vol. 45, 570–578, 1996.
20. Homier, E. A. and R. A. Scholtz, “Rapid acquisition of ultra-wideband signals in the dense multi-path channel,” Proc. IEEE Conference on Ultra Wideband Systems and Technologies, 105–109, 2002.
21. Chiu, C. C., C. L. Liu, and S. H. Liao, “Channel characteristics of ultra wideband systems with single co-channel interference,” Wireless Communications and Mobile Computing, Vol. 13, No. 9, 864–873, Jun. 2013.
22. Chien, W., C. C. Chiu, Y. T. Cheng, S. H. Liao, and H. S. Yen, “Multi-objective optimization for UWB antenna array by APSO algorithm,” Telecommunication System, Vol. 64, No. 4, 649–660, Apr. 2017.
23. Cheng, Y. T., C. C. Chiu, S. P. Chang, and J. C. Hsu, “Microwave imaging for half-space imperfect conductors,” Nondestructive Testing and Evaluation, Vol. 30, No. 1, 49–62, Jan. 2015.
24. Yu, C. Y., C. C. Chiu, Y. K. Chou, and S. C. Shen, “Microwave imaging in frequency domain for through-wall multiple conductors,”Journal of Testing and Evaluation, Vol. 44, No. 4, 1617–1623, Jul. 2016.