Statistical Modeling of CO2 Flux Data
Full text
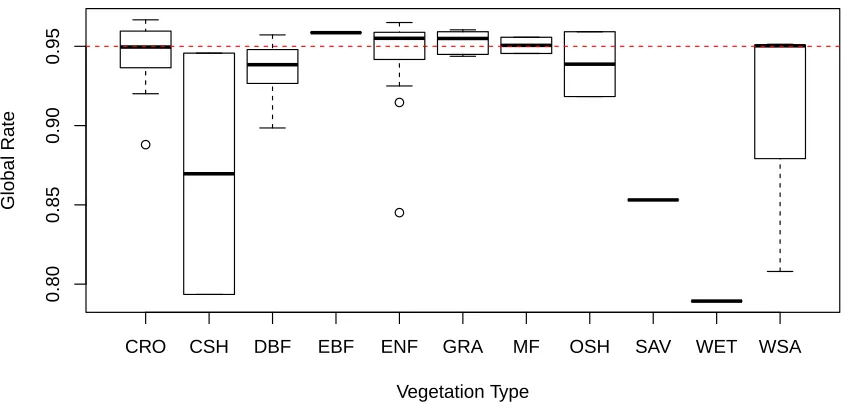
Figure


Related documents
¾ Grain size decreases as velocity index decreases due to low heat input condition, which inhibits the grain growth of the FSP samples at low Iv value, means low tool rotation and
Instructional system designer, game designer, domain expert, developer, artist Creating a good serious game involves making a number of explicit tradeoffs.. to balance budget,
Validation of the TRA/TRB clonotype composition of single cells dispensed from cell lines against bulk sequencing using Sanger and/or NGS confirmed clonotypes, indicated that
Wherever you live in Norway, you will have easy access to the countryside, and activities such as hiking, skiing and fishing are very popular.. Outdoor recreation activities
This paper discusses the practice of China Telecom in the past two years, "the use of mobile Internet, changes in service, improve efficiency, improve customer perception"
Thus, the theoretical-applied model of career guidance work developed by us with pupils and students in the integrated system "school – vocational college –
The findings indicate that both structural effect and competitiveness effect were positive during the time span ranging from 2010-14 and the latter shows that the market share
Reasons for Project Failure Strategic alignment Benefits focus Senior management support Stakeholder engagement Project and Risk Management Supplier management Skilled
