Available online: http://edupediapublications.org/journals/index.php/IJR/ P a g e | 897
Detect Financial Fraud Detection with Anamaly Feature
Detection
Nayab S aleema Tabassum1, Venkat2, Charan3
1
P.G. Scholar, 2Guide, Asst. Professor, 3Head of the Department
1,2,3
BRANCH : Computer Science Engineering
1,2,3
Geetanjali College of Engineering and Technology
Email id :1tabbu.saleema@gmail.com, 2venkatjavaprojects@gmail.com
ABSTRACT
Financial fraud, such as money laundering, is known to be a serious process of crime that makes illegitimately obtained funds go to terrorism or other criminal activity. This kind of illegal activities involve complex networks of trade and financial transactions, which makes it difficult to detect the fraud entities and discover the features of fraud. Fortunately, trading/transaction network and features of entities in the network can be constructed from the complex networks of the trade and
financial transactions. The
trading/transaction network reveals the interaction between entities, and thus anomaly detection on trading networks can reveal the entities involved in the fraud activity; while features of entities are the description of entities, and anomaly detection on features can reflect details of the fraud activities. Thus, network and
features provide complementary
information for fraud detection, which has potential to improve fraud detection performance. However, the majority of existing methods focus on networks or features information separately, which does not utilize both information. In this paper, we propose a novel fraud detection framework, CoDetect, which can leverage both network information and feature information for financial fraud detection. In addition, the CoDetect can simultaneously detecting financial fraud activities and the feature patterns associated with the fraud
activities. Extensive experiments on both
synthetic data and real-world data
demonstrate the efficiency and the
effectiveness of the proposed framework in combating financial fraud, especially for money laundering.
Keywords:- Companies, S parse matrices, Electronic mail, Complex networks, Automation
INTRODUCTION
Lately, budgetary fraud exercises, for
example, credit card fraud, money
laundering, increment bit by bit. These exercises cause the loss of individual as well as endeavors' properties. Far more atrocious, they imperil the security of country in light of the fact that the benefit from fraud may go to fear based oppression. Hence, precisely identifying money related fraud and following fraud are fundamental and earnest. Be that as it may, budgetary fraud detection isn't a simple assignment because of the intricate exchanging systems and
exchanges included. Taking money
Available online: http://edupediapublications.org/journals/index.php/IJR/ P a g e | 898
numbers as highlights to produce detection strategy. In specific situations, this sort of indicator may function admirably with moderately stable exchanging elements. Sadly, this present reality circumstance is increasingly confused, particularly inside Free Trade Zones (FTZs) where global exchange includes complex techniques and trade of data between exchanging elements. The fraud exercises, particular money laundering, are more profound stealth. M oney laundering exercises may take various structures, for example, the hiding
transportation of money utilizing
exchanging activities; the procurement and closeout of intangibles; and related
gathering exchanges. Not just the
exchanging of goods appears on
substantially more assorted variety, yet
additionally extraordinary sort of
organizations, shell and front organizations include in to encourage money laundering. Conversely with other fraud exercises,
money laundering shows exceptional
trademark which introduces high hazard to monetary framework with clouding the money trail, collectivization conduct and wild exchanging locales FTZs.
Numerous fraud detection models work
with property estimation information
focuses that are produced from exchanges information. Some accumulation strategies are additionally used to enhance the data of
information. Subsequent to producing
highlight focuses from exchanges, regulated and solo techniques can be utilized to perform detection. For the most part, these information focuses are thought to be
autonomous and indistinguishably
disseminated (i.i.d.). In any case, the quality of money laundering is not the same as characteristic worth information. The
collectivization conduct implies the
information is characteristically connected
or incompletely connected. Clearly,
exchanging movement includes in any event
two business substances. Connected
information is evidently not autonomous and indistinguishably conveyed, which repudiates the suspicions of conventional managed and unaided techniques. On the opposite side, some connected information
is auto corresponded. For instance,
exchanging between business substance A also, B suggests that component focuses An and B are associated. A few highlights used to depict the properties of exchanging goods can be indistinguishable among An and B. This trait of auto relationship lessen the compelling size of information for learning. Besides, include focuses don't intertwine the association data in information. The relations between any business elements show the potential causality that implies, if organizations ongoing, fraud substance can be situated by other recognized fraud element. This implies the element, which have association with fraud element, are
suspicious. Thusly, highlight based
detection models with administered or solo techniques have intrinsic restriction of insufficiency of distinguishing what the fraud relations are.
Available online: http://edupediapublications.org/journals/index.php/IJR/ P a g e | 899
why these exercises marked as fraud, i.e., the point by point highlights of the fraud exercises. M ost of this how-and-why data is intertwined in highlights focuses, which have basic significance for money related fraud detection due to the following need. For instance, working with deception of the cost may move extra an incentive to exporter. The incentive in this model uncovers how did the fraud occur. This straightforward model requires the detection framework to check an incentive as fraud property. Another model, fraud exercises might go further stealth with multi-elements included. On the off chance that a similar good or administration solicitations various diverse business substances to make the installments, at that point there are a few
properties ought to be consider as
suspicious: business area, name, heading, good or administration and so forth. With
the information on these suspicious
properties, following fraud can be a lot simpler for administrators.
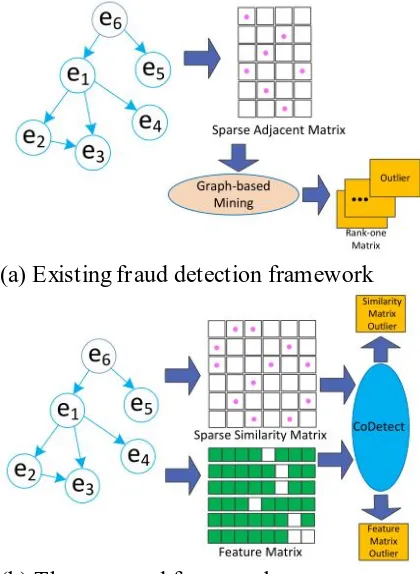
Thus, graph-based methods can detection suspicious interactions between entities while attribute-feature based methods can reveal the features of the fraud. Graph and attributes provides two complementary information for financial fraud activity detection and fraud property tracing. However, the majority of the existing algorithms exploits these two information separately and thus cannot provide a system that can detect the fraud entities and reveal suspicious properties for easy tracing simultaneously.
In this paper, we would like to develop a novel framework for fraud detection by considering the special detecting and tracing demanding of fraud entities and behaviors. Specifically, we investigate: (1) how to utilize both graph matrix and feature matrix for fraud detection and fraud tracing; (2) how to mathematically model both graph matrix and feature matrix so as to
simultaneously achieve the tasks of fraud detection and tracing. In an attempt to solve these challenges, we proposed a novel detection framework CoDetect, as Fig. 1(b) shown, for financial data, especially for money laundering data. We incorporate fraud entities detection and anomaly feature detection in the same framework to find fraud patterns and corresponding features
simultaneously. Combining entities
detection and feature detection enables us to build a novel fraud detection framework for noisy and sparse financial data: relevant fraud patterns help the identification of fraud identities, and relevant features in turn help revealing of the nature of fraud activities.
(a) Existing fraud detection framework
(b) The proposed framework
Fig. 1. Fraud detection using graph mining techniques
Our empirical study on synthetic and real
world data sets demonstrates the
effectiveness of CoDetect, which does discover the fraud pattern and decide the fraud related properties in an unsupervised
Available online: http://edupediapublications.org/journals/index.php/IJR/ P a g e | 900
approximation representations and residual for complex network matrix and feature
matrix simultaneously. The major
contributions of the paper can be
summarized as follows:
1) Provide an approach to establish weighted graph from financial network, incorporating properties of nodes and links; 2)! Demonstrate different scenarios of financial fraud and formulate the patterns of fraud in term of graph and sparse matrix;
3)! Propose a novel unsupervised
framework, CoDetect, for the problem of complex patterns discovery and anomaly features identification, employing two matrices residual
analysis on graph-based financial network; 4) Evaluate framework using synthetic and real world data to demonstrate both effectiveness and efficiency of the proposed framework.
EXPERIMENTS
In this section, the synthetic data and real world data from IKnow.com are used to evaluate the effectiveness of CoDetect. We first perform qualitative analysis using synthetic data to demonstrate the detection result in an illustrative way. Then we evaluate CoDetect with other state-of-art matrix factorization methods and clustering methods in term of detection accuracy and detection time. Finally, we perform the model parameters analysis which prove the robustness of CoDetect.
A. Financial Data sets and Preprocessing Synthetic Data. Technically, the synthetic data is from small part of ICIJ Offshore Leaks Database. We only extract 100 financial entities and 2,000 transactions from this data set. Then we inject fraud patterns into this synthetic data. Under this setting, we have a sparse graph matrix, S with size of 100×100 and 2,000 points in matrix. And we also have a feature matrix, F with size of 100×30. Then we can perform
qualitative analysis which provide a illustrative perspective for detection results. M oney Laundering Data. This data set is from ICIJ Offshore Leaks Database. We filter out uncompleted rows from the data set which leaves us a data set with 29,265 financial entities, and 571,113 transactions. We extract features from the transactions which is F , and build weighted grap h S as described in previous section as: if two financial entities have trading history, there is an edge between them and the weight of the edge is calculated from the features of the two entities.
Unfortunately, the fraud activates are not reported in this data sets. Any detected anomaly may not be considered as financial fraud. So we can't make these anomaly as
ground-truth for evaluation. In our
experiments, we randomly inject one of the fraud patterns into graph. we want to see if CoDetect can detect it from the residual matrix s R , at the same time, to see if CoDetect can reveal the anomaly feature from the residual matrix f R .
Available online: http://edupediapublications.org/journals/index.php/IJR/ P a g e | 901
target label 1. And mean value of the performance is calculated.
Credit Card Fraud Data. Statlog (German Credit Data) data set is used in our study. The preprocessing is similar to the preprocessing of COIL2000. In Statlog, attribute 4, qualitative is used to form the bi-party graph from data set where there is a connection if customer ran their credit card for the purpose in attribute 4. Then we have the matrix S and matrix F . We filter out record with label 2 and the remaining data set is considered to be normal. For each experiment we inject 10% records with label 2 as outliers. Then we construct S and F. We repeat the experiment 10 times for fully coverage of records with target label 2. And mean value of the performance is calculated.
B. Qualitative Analysis On Graph M atrix S The outputs of algorithm 1 are graph similarity matrix residual Rs and graph feature matrix residual R f . With matlab sparse matrix toolbox, we can plot these two matrices as identifications of fraud patterns in graph. We can have a more illustrative way to spot the fraud activities in graph. CoDetect can perform fraud detection on graph matrix and identify the anomaly
feature corresponding to this fraud
simultaneously. From (1), we know that
parameter α control the anomaly
contribution from feature matrix. If we set α = 0 , CoDetect degenerate into a general matrix factorization method. This method is chosen as a baseline. Then we can compare CoDetect with other state-of-art detection methods based on matrix factorization, robust PCA(RPCA) [39] and Singular Value Decomposition(SVD) [40]. We follow a direct way to construct detectors by using original matrix minus low rank matrix as
approximated by RPCA and SVD
respectively. As a common practice, the parameters in detection models are tuned via cross-validation. We inject one type of
fraud pattern into graph each time to build S and F .
In this set of experiments, we evaluate CoDetect in two scenarios: (1) with α =0 , we observe how different detection model fare, and (2) with α ≠ 0 , i.e., performing fraud detection with state-of-art models first, we examine how these detection models compare with CoDetect. For
CoDetect, we set α =0.1 for synthetic data.
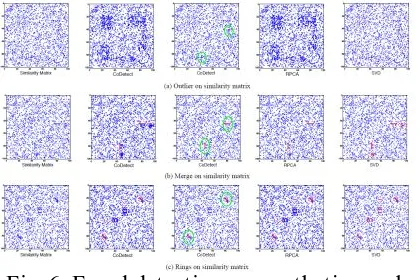
Figure 6 depicts the experiments results on matrix S .
When α =0 , the performance of CoDetect degrades. As the second column in Fig. 6 shown, CoDetect generates false positive detection. In short, when α ≠ 0 , outlier detection on F helps. CoDetect consistently outperforms RPCA and SVD.
Fig. 6. Fraud detection on synthetic graphs S with α = 0 andα ≠ 0 . Each blue dot in
figure (a) (b) (c) represents an edge in graph. Red dots marked by green circles are detected anomaly patterns. The main reason is: from algorithm 1, U transfers fraud knowledge between S and F which suppress the false positives. When α =0 , there is no knowledge transferring. Taking merge fraud patterns as an example, from Fig. 6(b), merge fraud pattern is a red line in similarity matrix. This means multi financial entities have business with one entity, as fraud scenario 2 shown (Fig. 4). RPCA detects all three fraud patterns as CoDetect does, but there are some false positive detection generated by RPCA and
Available online: http://edupediapublications.org/journals/index.php/IJR/ P a g e | 902
false positive detection as each sub-figure shown.
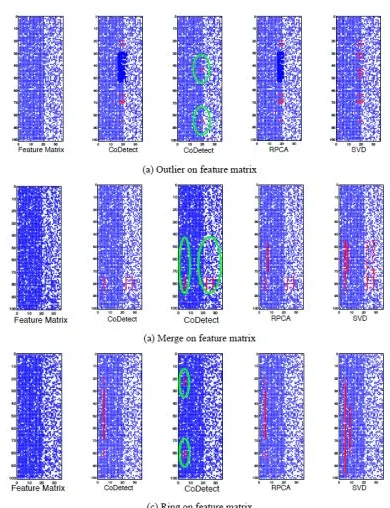
C. Qualitative Analysis On Feature M atrix F The second set of experiments is to evaluate detection performance on feature matrix F .
We also evaluate CoDetect in two
scenarios: (1) the first is to use objective function in Section 3.3 that is performing detection only on F , and (2) with α ≠ 0 , i.e., performing fraud detection with state-of-art models first, we examine how these detection models on F compare with CoDetect. For CoDetect, we set α =0.1 for synthetic data. We inject one type of fraud pattern into transaction each time to build S and F . Figure 7 depicts the experiments results on matrix F . Similar to the results on matrix S , the performance of CoDetect degrades when using objective function only. CoDetect generates false positives on
F . When α ≠ 0 , CoDetect outperforms
RPCA and SVD on F with no false positives. As we already known, U transfers fraud knowledge between S and F . The benefit don’t stop here. The pseudo class label U can be working as a indicator for tracing and forensic the fraud. Taking merge fraud as an example, from Figure(b), several columns are located as anomaly features. They are properties of Direction, Service and Value from SDLAT. These anomaly feature help executive to trace and forensic the fraud. We can easily locate the feature(s) which result in the fraud. From Figure 7(a) middle one, the red dot in green circle is detected an outlier fraud pattern by CoDetect.
This means there is a common weight between two nodes (node 43 and node 85 in our experiments). Correspondingly, from Figure 7(c), the row 43 and 85 are detected as fraud nodes and column 18 to 21 are located as anomaly features. In SDLAT, feature 18 to 21 are all related to value of trading. Obviously, we can detect the fraud
entities and anomaly feature simultaneously, the anomaly feature reveal the nature of the fraud. Essentially, from (8), we know that U guarantee the relation between anomaly points and anomaly feature and also suppress the false positive rate. These anomaly features are some important complementary information for anomaly points detected on graph matrix. In comparison, RPCA and SVD can only work on feature matrix, and generate much more false detection on feature matrix shown on Figure 7. Even we can use RPCA and SVD on graph matrix and feature matrix respectively, we hardly establish the relation between the detected anomaly. From perspective of security executive, we know fraud happened but we are not able to trace and forensic.
D. Evaluation with M atrix Factorization M ethods
Available online: http://edupediapublications.org/journals/index.php/IJR/ P a g e | 903
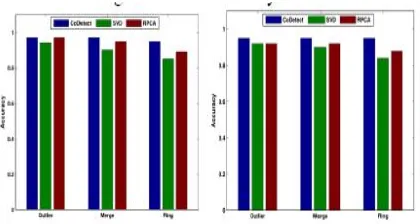
We evaluate the detection accuracy on similarity matrix and feature matrix respectively. We inject three fraud patterns into two dataset respectively. We first perform the experiments by CoDetect, Robust PCA and SVD for the comparison of accuracy on similarity. RPCA and SVD are used to extract top k rank components, then we obtain the residual matrix by original matrix minus top k rank components. Here k is set to 5. We omit the parameter analysis and only report the best performance on RPCA and SVD. We repeat the experiments 20 times and report the mean accuracy on similarity matrix. From Fig. 8 we see that
CoDetect and RPCA achieves high
detection accuracy on similarity matrix from synthetic data and real life data. We perform the experiments on feature matrix. From Fig. 9 we see that the RPCA and SVD detection accuracy drops dramatically. CoDetect achieve high detection accuracy on feature matrix.
(a) Similarity matrix(synthetic data) (b) Similarity matrix(real life data)
Fig. 8. Detection accuracy on graph-based similarity matrix. CoDetect and Robust PCA achieve high detection accuracy on all fraud patterns.
Fig. 9. Detection accuracy on feature matrix. CoDetect achieve high detection accuracy of anomaly feature.
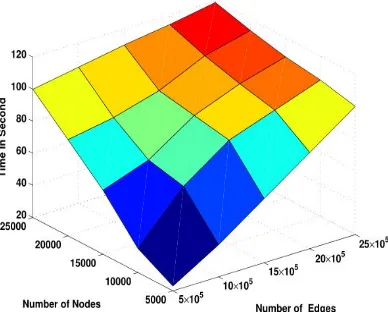
Time Performance Analysis. We evaluate the time performance here. The experiments are all performed on machine with Intel(R) Core(TM ) i7 CUP @ 2.60GHz and 32GB memory, running Windows 7. Each experiment is repeated 20 times and we report the mean time in second. We first evaluate the scalability of CoDetect with retune the size of graph. We tune the size of graph from 5,000 to 25,000 and tune the edge number from 5 × 10⁵ to 15 × 105, then inject three fraud patterns into each graph. Then we evaluate the detection time
performance in term of second. We find that CoDetect converge to threshold in 10
iteration mostly. So we set the
iteration to 10 in order to reducing the computation cost. The result is presented in Fig. 10. It can be seen that CoDetect scales almost linearly with retune the graph size and number of edge. All the detection can be completed in acceptable time. The next
experiments are performed using
Available online: http://edupediapublications.org/journals/index.php/IJR/ P a g e | 904
Fig. 10. Detection time in second with different number of nodes and edges
Fig. 11. Comparison of time with different rank size
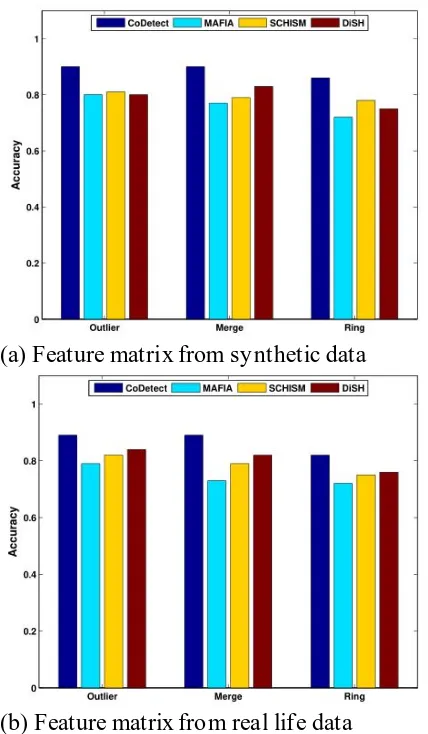
E. Evaluation With Subspace Clustering M ethods
The fraud patterns can be represented as anomaly in subspace of graph matrix and feature matrix. Anomaly detection using subspace clustering base on the assumption that cluster in subspace with small samples means anomaly [24]. The next experiment is to evaluate CoDetect with three methods MAFIA [42], SCHISM [43] and DiSH [44],
that have best subspace clustering
performance reported in[41]. We follow the recommended parameters setting for three clustering methods. We change the number of cluster for anomaly detection and report the best. From Fig. 12 we see that CoDetect achieves high detection accuracy on similarity matrix from synthetic data and
real world data. We perform the
experiments on feature matrix. As Fig. 13 show, CoDetect achieve high detection
accuracy on feature matrix. Time
Performance Analysis. We set rank size r = 5 and fix iteration = 20 for CoDetect. We perform the time evaluation in two ways. The first one is to fix number of nodes, and evaluate the time performance with retune the number of edges. The second one is to fix number of edges, and evaluated time performance with retune the number of nodes. The result is presented in Fig. 14. Clearly, CoDetect achieves high time performance in all ways.
(a) Similarity matrix from synthetic data
(b) Similarity matrix from real life data
Available online: http://edupediapublications.org/journals/index.php/IJR/ P a g e | 905
(a) Feature matrix from synthetic data
(b) Feature matrix from real life data
Fig. 13. Detection accuracy on feature matrix with subspace clustering.
CoDetect achieve high detection accuracy on all fraud patterns.
(a) Fix nodes number to 5000
(b) Fix edges number to 5 × 10⁵ Fig. 14. Detection time in second
F. M odel Parameters Analysis
The last experiment is to evaluate the performance of CoDetect with respect to
input parameters α and r , see Algorithm 1.
We tune the parameter α by a “grid-search”
strategy from{1,10−1 ,10−2 ,10−3 ,10−4 }. For parameter rank size r, we set r=3,5,10,15,20 respectively. We evaluate the detection performance with each pair of input parameter and repeat the experiments 20 times for the average results.
From Fig. 15 we can see that CoDetect is not very sensitive to α . It makes the model robust to different datasets. We also find that CoDetect remains high detection accuracy with very low rank reconstruction rank.
Fig.15. Detection performance with
Available online: http://edupediapublications.org/journals/index.php/IJR/ P a g e | 906
CONCLUSION
We propose another system, CoDetect, which can perform fraud detection on diagram - based comparability matrix and highlight matrix all the while. It acquaints another route with uncover the idea of monetary exercises from fraud examples to suspicious property. M oreover, the system gives a more translate table approach to distinguish the fraud on meager matrix. Test
results on manufactured and true
informational collections show that the
proposed structure (CoDetect) can
successfully distinguish the fraud designs just as suspicious highlights. With this co-detection structure, officials in money related supervision can distinguish the fraud designs as well as follow the first of fraud with suspicious element. M oney related exercises are including with time. We can speak to these exercises into likeness tensor and featuretensor. So we might want to examine how to incorporate tensor into co-identify structure for fraud detection. REFERENCES
[1] C. Sullivan, and E. Smith, Trade-based money laundering:Risks and regulatory responses. AIC Reports Research and Public Policy Series, 115.
[2] Trade-based money laundering
flourishing. United Press Internatinoal, M ay, 2009. http://www.upi.com/Top News / 2009 /05 /11 / Trade based -money -laundering-flourishing/UPI-17
331242061466.
[3] L. Akoglu, M . M cGlohon, and C. Faloutsos, Oddball: Spotting anomalies
in weighted graphs. In PAKDD,
pp:410-421, 2010.
[4] V. Chandola, A. Banerjee, and V. Kumar. Anomaly detection:A survey. ACM Comput.Surv, 41(3), 2009.
[5] W. Eberle, and L. B. Holder. M ining for structural anomalies in graph-based data. In DM IN, pp:376-389, 2007. [6] C. C. Noble, and D. J. Cook.
Graph-based anomaly detection.In KDD, pp:631-636, 2003.
[7] H. Tong, and C-Y. Lin. Non-negative risidual matrix factorization with application to graph anomaly detection. In SIAM .
[8] W. Suhang, J. Tang, H. Liu. Embedded Unsupervised Feature Selection. In AAAI.
[9] Z. Lin, M . Chen, Y. M a .The augmented Lagrange multiplier method for exact
recovery of corrupted low-rank
matrices. In arXiv preprint
arXiv:1009.5055, 2010.
[10] J. Sun, H. Qu, D. Chakrabarti, and C. Faloutsos. Neighborhood formation and anomaly detection in bipartite graphs. In ICDM , pp:418-425, 2005.
[11] A. Patcha, and J. M . Park. An overview of anomaly detection techniques :
Existing solutions and latest
technological trends. Computer
Networks, 51(12):3448-3470, 2007. [12] W. Li, V. M ahadevan, N. Vasconcelos.
Anomaly detection and localization in crowded scenes. IEEE Tran. on Pattern Analysis & M achine Intelligence, 36(1):1, 2013.
[13] K. Henderson, B. Gallagher, L. Li, L. Akoglu, T. Eliassi-Rad, H. Tong, and C. Faloutsos. It’s who you know: graph mining using recursive structural features. In SIGKDD, pp:663-671, 2011.
[14] F. Keller, E. M üller, and K. Bohm. Hics: High contrast subspaces for density-based outlier ranking. In ICDE, pp.1037-1048,2012.
[15] D. Koutra, E. Papalexakis, and C. Faloutsos. Tensorsplat:Spotting latent anomalies in time. In PCI, pp:144-149, 2012.
one-Available online: http://edupediapublications.org/journals/index.php/IJR/ P a g e | 907
class classifiers from M L and KDD. In ICM LA,pp:147-153, 2009.
[17] N. A. Heard, D. J. Weston, K. Platanioti, and D. J. Hand.Bayesian anomaly detection methods for social
networks. In Annalsof Applied
Statistics, 4:645-662, 2010.
[18] J. Tang, and H. Liu. CoSelect: Feature selection with instance selection for social media data. In SDM , 2013. [19] Z. He, X. Xu, and S. Deng.
Discovering cluster-based local
outliers. Pattern Recognition Letters, 24(9-10):1641-1650, 2003.
[20] M . Gupta, J. Gao, C. C. Aggarwal, and J. Han. Outlier Detection for Temporal Data. Synthesis Lectures on Data M ining and Knowledge Discovery, M organ & Claypool Publishers, 2014. [21] J. Tang, Y. Chang, and H. Liu. M ining
Social M edia with Social Theories: A Survey. ACM SIGKDD Explorations Newsletter,15:20-29, 2014.
[22] I. S. Dhillon, S. M allela, and D. S.
M odha.Information-theoretic
co-clustering. In KDD, pp:89-98, 2003. [23] Q. Gu, and J. Zhou. Co-clustering on
manifolds. In KDD,pp:359-368, 2009. [24] K. Sim, V. Gopalkrishnan, A. Zimek,
and G. Cong. A survey on enhances subspace clustering. Data M in. Know. Disc.,26:332-397, 2013.
[25] S. M cskimming. Trade-based money laundering: Responding to an emergin g threat.
[26] E. W. T. Ngai, Y. Hu, Y. H. Wong, Y. Chen, and X. Sun.The application of data mining techniques in financial fraud detection: A classification framework and an academic review of literature. Decision Support Syetem, 50:559-569, 2011.
[27] A. Srivastava, A. Kundu, S. Sural, and A. K. M ajumdar.Credit card fraud detecting using hidden markov model. IEEE Tran.On Dependable and Secure Computing, 5(1), 2008.
[28] C. Whitrow, D. J. Hand, P. Juszczak,
D. Weston, and N. M.Adams.
Transaction aggregation as a strategy for credit card fraud detection. Data M in. Knowl. Disc, 18:30-55, 2009. [29] W. Wei, J. Lin, L. Cao, Y. Ou, and J.
Chen. Effective detection of
sophisticated online banking fraud on extremely imbalanced data. World Wide Web, 2012.
[30] S. Bhattacharyya, S. Jha, K.
Tharakunnel, and J. C.Westland. Data mining for credit card fraud: A comparative study.Decision Support Systems, 50:602-613, 2011.
[31] P. Ravisankar, V. Ravi, G. R. Rao, and
I. Bose. Detection of financial
statement fraud and feature selection using data mining techniques. Decision Support System. Decision Support System,50:491-500, 2011.
[32] D. Zhang, and L. Zhou. Discovering
golden nuggets: data mining in
financial application. IEEE Tran. on
Systems, M an and Cybernetics,
34(4):513-522, 2004.