Scholarship@Western
Scholarship@Western
Electronic Thesis and Dissertation Repository
6-10-2019 1:00 PM
Oleic Acid Attenuates Palmitic Acid-Induced Impairments in
Oleic Acid Attenuates Palmitic Acid-Induced Impairments in
Mouse Blastocyst Development
Mouse Blastocyst Development
Maisoon Dafalla Yousif
The University of Western Ontario
Supervisor
Watson, Andrew J.
The University of Western Ontario Co-Supervisor Betts, Dean H.
The University of Western Ontario
Graduate Program in Physiology and Pharmacology
A thesis submitted in partial fulfillment of the requirements for the degree in Master of Science © Maisoon Dafalla Yousif 2019
Follow this and additional works at: https://ir.lib.uwo.ca/etd
Part of the Cellular and Molecular Physiology Commons, and the Developmental Biology Commons
Recommended Citation Recommended Citation
Yousif, Maisoon Dafalla, "Oleic Acid Attenuates Palmitic Acid-Induced Impairments in Mouse Blastocyst Development" (2019). Electronic Thesis and Dissertation Repository. 6226.
https://ir.lib.uwo.ca/etd/6226
This Dissertation/Thesis is brought to you for free and open access by Scholarship@Western. It has been accepted for inclusion in Electronic Thesis and Dissertation Repository by an authorized administrator of
i
Palmitic acid (PA) and oleic acid (OA) are the most abundant saturated and monounsaturated
non-esterified fatty acids, respectively, in serum. The consequences of PA and OA treatment on
preimplantation mouse embryo development were investigated. It was hypothesized that OA
treatment from the two-cell stage onwards would attenuate PA-induced reductions in mouse
blastocyst development. PA significantly reduced development to the blastocyst stage. Transcript
analysis revealed that PA increased ER stress pathway markers activating transcription factor 3
and C/EBP homologous protein transcripts, and XBP1 splicing. Co-culture of PA-treated embryos
with OA prevented this PA-induced ER stress and rescued blastocyst development. Cytoplasmic
lipid droplet accumulation was significantly increased by OA co-treatment. The results indicate
that PA treatment induces ER stress, which limits lipid droplet accumulation and impairs
blastocyst development. Co-treatment with OA is protective in reducing PA-induced ER stress and
developmental impairments. These findings have applications in improving fertility outcomes for
obese patients.
Keywords
ii
Co-Authorship Statement
All experiments were designed, performed and analyzed by Maisoon Yousif in consultation with
Dr. Andrew Watson. NEFA stock solutions were prepared by Dr. Michele Calder. Image
iii
Acknowledgments
Thank you, first and foremost, to my parents. Thank you for the sacrifices you made for me to
reach this point. Thank you for believing in my potential even when I didn’t. I am thankful for
your love of education and that you’ve instilled it in me and my brothers. I am so incredibly proud
of everything you have accomplished. To my brother, Mohamed, thank you for being my sounding
board and confidant this past year. Although you are younger, your critique of my work, research
and life choices has been invaluable. I couldn’t have done this without you and your level head.
To Andy and Dean, I could not have asked for better supervisors. Thank you for your constant
excitement and belief in me and my work. You’ve made this journey an enjoyable one.
Thank you to the members of the Watson and Betts labs. To Dr. Michele Calder for training and
supporting me these past couple of years. Working in the Watson lab was a breeze because of you.
To Dr. Nicole Edwards for always being open and available to teaching me. Be it something like
helping with an injection or making sure that the lab was running smoothly, I’ve felt immensely
supported in my time as an undergraduate and graduate student in the Watson/Betts lab.
To the members of the DDT lab, it was a pleasure sharing an office with you. Thank you for
keeping things fun. To my closest friends, thank you for you unwavering support of my academic
and personal endeavors.
iv
List of Abbreviations
ANOVA Analysis of variance
ART Assisted reproductive technology
ATF Activating transcription factor
BiP Immunoglobulin heavy-chain binding protein
BMI Body mass index
BSA Bovine serum albumin
CHOP C/EBP homologous protein
COC Cumulus-oocyte complex
COS Controlled ovarian stimulation
DAG Diacylglycerol
DGAT Diacylglycerol acyltransferase
EGF Epidermal growth factor
EIF2⍺ Eukaryotic initiation factor 2 alpha
ER Endoplasmic reticulum
ERAD ER-associated protein degradation
ETC Electron transport chain
FSH Follicle stimulating hormone
v
hCG Human chorionic gonadotropin
hpi Hours post-injection
ICM Inner cell mass
ICSI Intracytoplasmic sperm injection
IP Intraperitoneal
IRE1 Inositol-requiring enzyme 1
IUGR Intrauterine growth restriction
IUI Intrauterine insemination
IVF In vitro fertilization
IVM In vitro maturation
JNK Jun N-terminal kinase
KSOMaa Potassium simplex optimization media with amino acids
LD Lipid droplet
LH Luteinizing hormone
MM Master mix
NCM Neonatal cardiomyocyte
NEFA Non-esterified fatty acid
OA Oleic acid
vi
PERK PRK-like ER kinase
PGA Preimplantation genetic assessment
PMSG Pregnant mare's serum gonadotropin
PP1 Protein phosphatase 1
RIDD Regulated IRE1-dependent decay
ROS Reactive oxygen species
SD Standard deviation
SE Standard error
SET Single embryo transfer
TAG Triacylglycerol
UPR Unfolded protein response
WHO World Health Organization
vii
Table of Contents
Abstract ... i
Co-Authorship Statement... ii
Acknowledgments... iii
List of Abbreviations ... iv
Table of Contents ... vii
List of Figures ... x
List of Appendices ... xii
Chapter 1 ... 1
1 Introduction ... 1
1.1 Assisted Reproductive Technologies ... 1
1.2 Preimplantation Embryo Development... 3
1.3 Development of embryo culture environments in fertility clinics ... 5
1.4 Advances in embryo culture developed in the lab ... 6
1.5 Reproductive Disorders Associated with Obesity ... 7
1.6 Palmitic Acid and Oleic Acid: Source and Structure... 8
1.7 Effects of NEFAs on Reproduction ... 10
1.8 PA vs. OA: Their Effects Throughout the Body... 10
1.9 PA vs. OA: Differential Effect on ER Stress Activation ... 13
1.10The Endoplasmic Reticulum and its Function ... 14
1.10.1 Protein Synthesis and Processing... 14
1.10.2 Triacylglyceride Synthesis ... 14
1.10.3 Lipid Droplet Synthesis ... 15
1.10.4 The ER Stress Response ... 15
viii
1.12.1 Objectives and Hypotheses ... 19
1.12.2 Specific Aims ... 19
1.12.3 General Hypothesis ... 20
1.12.4 Specific Hypotheses ... 20
Chapter 2 ... 21
2 Materials and methods ... 21
2.1 Animal Source and Ethics Approval... 21
2.2 Mouse Superovulation and Mating ... 21
2.3 NEFA Preparation and Embryo Culture ... 22
2.3.1 Embryo Culture ... 23
2.4 Developmental Stage Analysis ... 23
2.5 RNA Extraction and Reverse transcription ... 23
2.6 Transcript Detection through Polymerase Chain Reaction (PCR) ... 24
2.7 Quantitative PCR (qPCR) for assessment of relative transcript levels ... 24
2.8 Confocal Microscopy ... 25
2.9 BODIPY staining to assess embryo lipid droplet accumulation ... 25
2.10MitoSox Superoxide Stain ... 26
2.11Statistical analyses ... 26
Chapter 3 ... 28
3 Results ... 28
3.1 Effects of PA and OA on preimplantation embryo developmental stage ... 28
3.2 Effects of OA and PA on ER stress activation ... 39
3.3 Effects of OA and PA on lipid droplet abundance ... 43
ix
Chapter 4 ... 50
4 Discussion ... 50
4.1 Preimplantation Development with OA... 51
4.2 Preimplantation embryo development with PA and OA co-culture ... 52
4.2.1 ER Stress with PA and OA ... 54
4.2.2 Lipid Droplet Accumulation with PA and OA ... 55
4.3 Mitochondrial Superoxide Levels with PA and OA ... 56
4.4 Limitations and Future Directions ... 58
4.5 Conclusions and Significance ... 61
References ... 64
Appendices ... 74
Curriculum Vitae ... 79
x
List of Figures
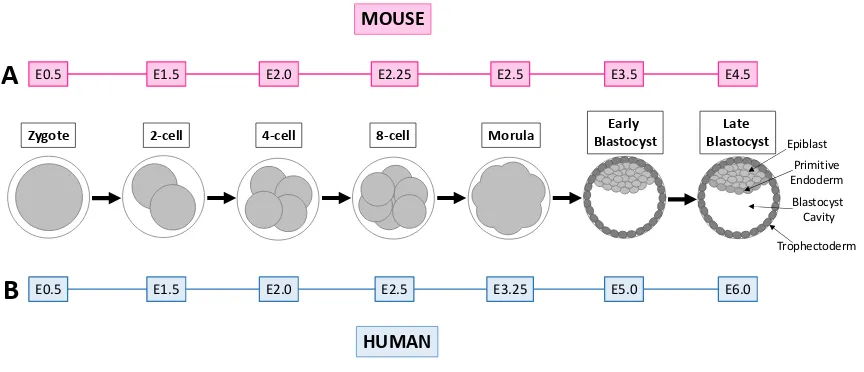
Figure 1. Preimplantation embryo development in the mouse (A) and human (B). ... 4
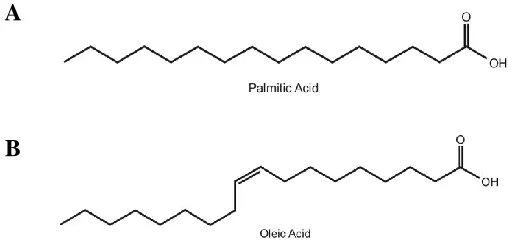
Figure 2. Molecular structures of palmitic and oleic acid. ... 9
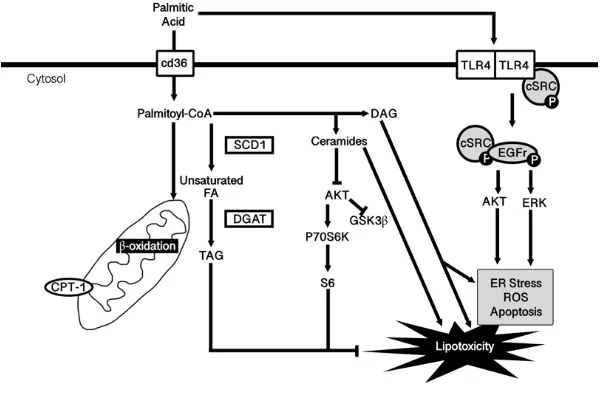
Figure 3. Mechanisms through which palmitic acid mediates its effects. ... 12
Figure 4. The unfolded protein response. ... 16
Figure 5. Phase contrast representative images of embryos cultured in oleic acid (OA). ... 30
Figure 6. Representative phase contrast images of mouse embryos treated with palmitic acid (PA) and oleic acid (OA). ... 31
Figure 7. Blastocyst preimplantation embryo percentage after 46-hour culture. ... 33
Figure 8. Morula preimplantation embryo percentage after 46-hour culture. ... 34
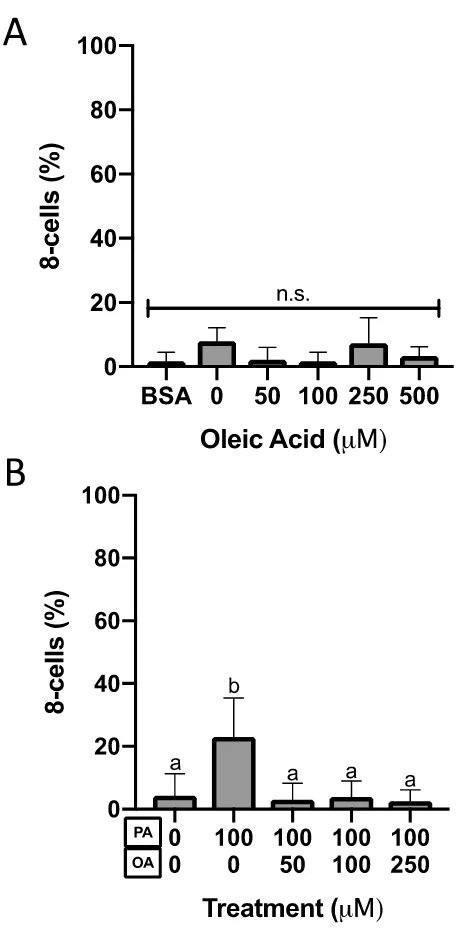
Figure 9. Eight-cell preimplantation embryo percentage after 46-hour culture. ... 35
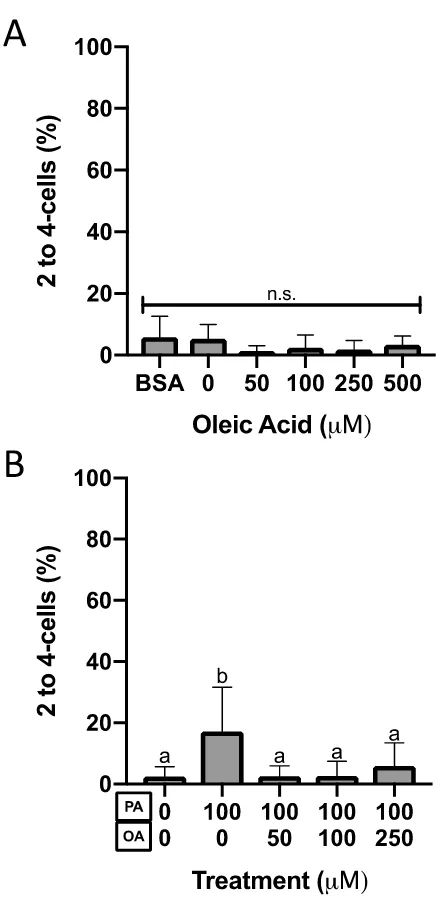
Figure 10. Two to four-cell preimplantation embryo percentage after 46-hour culture. ... 37
Figure 11. Percentage of embryos with degraded blastomeres after 46-hour culture. ... 38
Figure 12. ER stress response relative transcript abundance with OA exposure... 40
Figure 13. ER stress response transcript abundance with OA and PA co-treatment. ... 41
Figure 14. XBP1 splicing with embryo culture in PA and OA. ... 42
Figure 15. BODIPY fluorescence with PA and OA exposure. ... 44
Figure 16. Quantified lipid droplet abundance. ... 45
Figure 17. DGAT enzyme transcript abundance with PA and OA exposure. ... 46
xi
Figure 19. Quantified mitochondrial superoxide levels. ... 49
Figure 20. Summary Figure: Limitations and future work ... 59
xii
List of Appendices
Appendix A: Dose response to PA ... 75
Chapter 1
1
Introduction
1.1
Assisted Reproductive Technologies
Human infertility is a global problem1, affecting 1 in 6 couples2 worldwide. Over the past 40 years assisted reproductive technologies (ARTs) have been developed to help couples
conceive. These ARTs encompass a wide variety of fertility treatments2 including intrauterine insemination (IUI); controlled ovarian stimulation (COS); in vitro oocyte
maturation (IVM), in vitro fertilization (IVF), intracytoplasmic sperm injection (ICSI),
embryo culture, oocyte and embryo cryopreservation, preimplantation genetic assessment
(PGA) and single embryo transfer (SET), to name the most common procedures.
Some ARTs address female-factor infertility, while others such as ICSI address male factor
infertility. Regardless of the underlying etiology of this infertility it is necessary that a
developmentally competent oocyte be retrieved from a female, whether it be from the
future mother or provided via an oocyte donor3. The majority of oocytes are retrieved following application of one of many routinely employed hormonal gonadotrophin-based
ovarian stimulation protocols4. In some cases, an alternative approach involves the collection of immature oocytes which are then matured in vitro by applying in vitro oocyte
maturation methods. COS promotes follicular recruitment and oocyte maturation in vivo of
a larger pool of oocytes than natural cycles provide5,6. In clinics, oocyte maturation is promoted through gonadotropin (follicle stimulating hormone (FSH) and then luteinizing
hormone (LH)) injections which “rescue” subordinate ovarian follicles from atretic
pathways thus fostering greater follicular recruitment and development of substantially
more mature Graafian follicles in the ovary. Cumulus-oocytes complexes (COCs) are
retrieved from ovarian follicles7–9 and used downstream as necessary in the clinic. The oocyte is fertilized by sperm, most commonly through IVF or ICSI, to form a zygote. This
zygote is placed into in vitro culture to increasingly support development to the blastocyst
stage, when SET can be applied to transfer the embryo into a female’s uterus for
All of these procedures while commonly applied today, were developed and put into
practice as a result of extensive amounts of research globally. Studies deciphered the key
mechanisms controlling mammalian reproduction in various animal models, which were
translated and applied to humans over the past 100 years of scientific inquiry. These efforts
culminated in 2010 when Dr. Bob Edwards received the Nobel prize in Physiology for his
efforts with Dr. Patrick Steptoe that resulted in the birth of the world’s very first IVF child,
Louise Brown in 197810. However, despite all of its successes, human fertility medicine only results in a 50-65% pregnancy rate of all patients seeking fertility treatment11.
The ART process can be broken down into several stages: oocyte maturation and
collection, fertilization, preimplantation development, embryo transfer and implantation,
and pregnancy. Each of these stages and procedures still require significant improvement
if we are to achieve the goal of helping everyone who seeks fertility treatment succeed in
their quest of having a family. The research in this thesis is directed at specifically
improving our ability to support preimplantation development in vitro so that only
blastocysts with high developmental competence are transferred during SET. The potential
implications of this thesis are to further explore the struggles faced by the obese patient as
these patients are increasing dramatically in number in the global population, and their
struggle to conceive is much greater than that of healthy BMI patients12–14. Although this
research was not clinical in nature, understanding the mechanisms that are altered in the
embryo during the ART process opens the door to translating information into human
fertility clinics.
Thus, my studies have focused on investigating preimplantation development and how
changes in the in vitro culture environment affect the mouse embryo during this stage. The
mouse preimplantation embryo is employed since it has become a primary research model
for understanding the mechanisms controlling mammalian preimplantation development
and it shares many mechanisms that have also been observed within human
preimplantation embryos15,16. As a first step toward a longer-term goal of increasing success of fertility treatment for obese women, we initiated a number of studies looking at
the direct influence of specific non-esterified fatty acids (NEFAs) on preimplantation
1.2
Preimplantation Embryo Development
Preimplantation development is the term defining the period between fertilization of an
oocyte to form an embryo and implantation of said embryo in the uterus (Figure 1). With
fertilization occurring in the oviduct (also known as the fallopian tube), the ovulated oocyte
merges with a single sperm to create a single cell zygote17. This embryo undergoes repeated cellular divisions as it travels toward the uterus. With each division, the number of cells in
the embryo, each of which is termed a blastomere, increases exponentially. However due
to the fact that the cells do not undergo a period of growth before dividing, blastomeres
decrease in size with each division. The zygote becomes a 2-cell, then a 4-cell, and at the
8-cell embryo18,19 stage adherens junctions form, followed by tight junctions 16,18,20,21. The
formation of cell-to-cell junctions of the outer cells of the embryo leads to their cellular
compaction, after which individual blastomere borders cannot be differentiated.
Compaction creates a morula that later cavitates to form a blastocyst, which has a
fluid-filled cavity18,19.
The blastocyst is composed of the inner cell mass (ICM), fluid-filled cavity, and an outer
layer of epithelial trophectoderm cells16. The ICM later gives rise to embryonic tissues, while the trophectoderm produces extraembryonic tissues such as the placenta, which
support embryonic and fetal development during pregnancy16. In late stage blastocysts the ICM differentiates into two distinct cell types: the epiblast and primitive endoderm16. For the purpose of this study, we defined a blastocyst as being a preimplantation embryo with
a visible fluid-filled cavity. Implantation of the blastocyst in the uterus marks the end of
preimplantation development. In the mouse, zygote corresponds to embryonic day 0.5
(E0.5), the 2-cell to E1.5, the 4-cell to E2.0, the 8-cell to E2.25, the morula to E3.0, and
the early blastocyst to E3.516. Although the timing differs slightly between humans and mice, the mouse embryo passes through the same stages as the human embryo, making it
an excellent model for understanding human preimplantation development (Figure 1).
With the application of SET to ARTs the human preimplantation period increasingly
occurs in vitro, thus, it is essential that culture conditions be optimized for different
patients’ embryos. Our lab has been studying the role of the in vitro culture environment
Figure 1. Preimplantation embryo development in the mouse (A) and human (B).
Human and mouse preimplantation embryos progress through the same stages of
preimplantation development, with the human taking 1.5 days longer than that mouse to
reach the late blastocyst stage. A) Timing and stages of preimplantation embryo
development in the mouse. B) Timing and stages of preimplantation embryo development
in the human. Figure adapted from Cockburn and Rossant, 201016.
Zygote 2-cell 4-cell 8-cell Morula BlastocystEarly BlastocystLate
E0.5 E1.5 E2.0 E2.25 E2.5 E3.5 E4.5
MOUSE
E0.5 E1.5 E2.0 E2.5 E3.25 E5.0 E6.0
HUMAN
Epiblast Primitive Endoderm Blastocyst Cavity Trophectoderm
A
1.3
Development of embryo culture environments in fertility
clinics
Although ARTs are fundamental for treating human infertility and fostering conception,
pregnancy and live births, there is a requirement for significant improvement in each phase
of the ARTs fertility treatment continuum. Obtaining a mature oocyte that has attained high
developmental competence is an essential step in every IVM, IVF and ICSI protocol. In
vivo, gonadotrophin stimulation cycles can be used to mature oocytes. Alternatively, an
immature oocyte can be removed from the ovary and matured in vitro (IVM)24–26.
IVM is becoming increasingly more common, due to suspected complications, such as
ovarian hyperstimulation syndrome, that can arise from elevated gonadotrophin level
exposure resulting from COS protocols27–29. Unfortunately, survival of oocytes matured in vitro is lower than that of oocytes matured in vivo30. It is suspected that subpar culture environment likely underlies this decreased success with IVM oocytes. Supplementing
oocyte culture media during IVM with different factors, such as autocrine and paracrine
regulators including epidermal growth factor (EGF)31,32 and growth differentiation factor 9 (GDF9)33 to increase an oocyte’s developmental competence have been extensively
investigated. Similarly, supplementing preimplantation embryo culture media with growth
factors, amino acids, metabolic substrates etc. can improve the embryos’ developmental
competence34,35. Watson et al. showed that inclusion of amino acids and epidermal growth
factor (EGF) to culture media resulted in significantly more bovine oocytes developing to
the blastocyst stage31. Additionally, supplementation of oocyte culture medium with GDF933 and antioxidants36 increases viability of embryos derived from IVM oocytes. Embryo culture presents with similar challenges to oocyte culture, where optimized culture
media must be developed to improve embryo viability and fertility outcomes.
Past research has allowed for the investigation of and development of a standard embryo
culture medium which is used in fertility clinics today37. By optimizing the embryo culture environment:
1) Less embryos will be lost/developmentally arrested.
2) More embryos will develop to a stage where they can be transferred or
3) Embryo developmental competence will be enhanced improving outcomes for
embryo transfer/implantation, and live birth rates.
Overall, the outcome of in vitro culture optimization research is that the ART process will
be made more efficient, less wasteful, and less taxing on individuals undergoing fertility
treatments. The fertility treatment process is stressful both psychologically, physically38,39 and financially40 on patients. Optimizing this process to minimize the stressors faced by future parents is an invaluable outcome of this and future research.
1.4
Advances in embryo culture developed in the lab
Our lab has been studying the in vitro embryo culture environment. Altering and
understanding how changes in this culture environment affect preimplantation
development is a useful tool in two ways.
Firstly, changing the mouse preimplantation embryo culture environment allows us to
model the human in vitro culture environment in fertility clinics. By experimenting with
changes in media, timing of culture, and the incubation environment, we are able to model
and discover ways to improve embryo culture. Thus, this research contributes to optimizing
the in vitro culture environment and improving ART outcomes.
Secondly, changing the composition of media in vitro helps us understand embryo
physiology and how embryos may be responding to different in vivo environments. Since
this is difficult to study in vivo, in vitro culture provides us with a model to directly study
the mechanistic and developmental alterations that happen when embryos are exposed to
different environments, providing us with insight into what may be happening in vivo. For
example, the focus of the studies presented in this thesis was on modeling how varying
fatty acid levels in vivo may affect embryo development in mothers of low, moderate, or
high body mass indices (BMIs). Studying how high fatty acid levels individually and in
combination affect embryo development in vitro provides some insight into how a
condition as complex as obesity may be affecting preimplantation embryo development
and restricting conception success in obese patients seeking assistance from fertility clinics.
successful development of mouse embryos to the blastocyst stage41, however KSOM media
is not supplemented with any fats42. The experiments in this thesis take a reductionist
approach to understanding the complexity of how obesity affects embryo development and
focuses in on investigating a single factor (NEFA levels) and elucidating its effect on
preimplantation embryo development.
1.5
Reproductive Disorders Associated with Obesity
The prevalence of obesity has been increasing not only nationally but internationally. The
World Health Organization (WHO) classifies overweight and obesity by body mass index
(BMI), which takes into account an individual’s height and weight43. Based on BMI, individuals can be categorized into several categories: 1) <18.5 kg/m2 (underweight), 2)
18.5-24.9 kg/m2 (normal weight), 3) 25-29.9 kg/m2 (overweight), and 4) >30 kg/m2 (obese)44. In Canada, the incidence of female obesity reached 18.7% in 2014, a 4.2% increase from 200345. In 2017, Statistics Canada reported that 1.87 million and 1.61 million women of reproductive age (18-49 years old) were overweight or obese, respectively45. Obesity is associated with increased disease risk and infertility in both males46 and females47. With increasing BMIs, women display increased incidence of reproductive disorders than women at normal BMIs. These include, but are not limited to, ovarian,
uterine, and tubal disorders48. Given that obese women have greater difficulty conceiving, they are more likely to seek fertility treatments and make use of ARTs. Unfortunately,
publications have reported poorer outcomes for obese women after seeking fertility
treatment48–51.
With ARTs, women often undergo ovarian hyperstimulation through hormonal injections.
Obese women have been shown to have decreased responses to gonadotropins used for
ovarian hyperstimulation, and thus, require higher doses of hormones when undergoing
ovarian hyperstimulation48,52. With increasing BMI, the number of oocytes successfully collected decreases52,53. Thus, regardless of increased gonadotropin doses, obesity is
associated with significantly greater risk of unsuccessful ovarian stimulation cycles48. IVF
or ICSI in obese women does not affect their ability to become clinically pregnant51,
however obese women were at a higher risk for early and recurrent pregnancy loss52,54 and
a higher prevalence of gestational diabetes54. Consequently, live birth rates are also reduced
with obesity48. The mechanisms underlying the negative effects of obesity on a women’s
reproductive capacity are not well understood and must be investigated to assist this rapidly
growing patient population.
1.6
Palmitic Acid and Oleic Acid: Source and Structure
NEFAs are free fatty acid (FFA) molecules found primarily bound to albumin55 in circulation. High BMI is associated with elevated NEFA levels in vivo56. Palmitic acid
(16:0, PA, Figure 2A) is the most abundant NEFA in circulation57,58, the Western diet59,
and in human follicular fluid phospholipids60. While PA is the most abundant saturated NEFA, oleic acid (18:1, OA, Figure 3B) is the most abundant monounsaturated NEFA 57.
With obesity, there is a marked increase in body fat content, which thereby causes elevated
levels of NEFAs in the circulation of obese individuals61. In the serum of lean individuals,
PA and OA each exist in a 1:1 ratio62 at roughly 100 M concentrations, however these
levels are higher in obese individuals at 200-400 M58,63,64. Although PA and OA
concentrations in the female reproductive tract remain unknown, their abundance
elsewhere in the body suggests that PA and OA are primary saturated NEFAs that embryos
are exposed to during preimplantation development.
PA in the body is sourced from the diet or through de novo synthesis65. Although PA and OA structurally differ by only two carbons and a single double bond, these NEFAs have
been shown to have different metabolic fates66. PA, but not OA, was associated with higher
diabetes risk67. Bakke et al investigated the effect of 100 M PA or 100 M OA on skeletal muscle. They found that relative to OA, PA resulted in lower lipolysis, incorporates more
into phospholipids than TAGS, increased lipogenesis, beta oxidation and reduced oxidative
A
B
Figure 2. Molecular structures of palmitic and oleic acid.
Chemical structures of the most abundant non-esterified fatty acids: A) 16-carbon saturated
palmitic acid and B) 18-carbon monounsaturated oleic acid. Figure modified from Shah
1.7
Effects of NEFAs on Reproduction
Early exposure to maternal high fat diet in vivo until the 2-cell stage significantly lowers
development of mouse embryos in vitro to the blastocyst stage from 65% to 50%69. In mice, when implanted in control mothers after embryo transfer, oocytes from high fat
mothers showed malformations in the mitotic spindle, as well as significantly more brain
defects in mice from these high fat mothers’ blastocysts69. Additionally, increased NEFAs
in follicular fluid are correlated with poor COC quality70. An accumulation of unfolded or
misfolded proteins causes ER stress, which the cell attempts to alleviate by activating the
unfolded protein response (UPR) pathway. Treatment of COCs with NEFAs resulted in
impaired blastocyst development, however rescue by the UPR pathway inhibitor salubrinal
identified UPR activation as a major contributor to this NEFA-dependent developmental
decrease71.
When Jungheim et al. cultured mouse morulae in 200 M of PA for 30 hours, they found
that embryos exposed to PA had cell numbers that were significantly lower than embryos
cultured in control media72. When they exposed blastocysts to PA for 30 hours and transferred these embryos into surrogate mothers, pups produced from PA-exposed
blastocysts were significantly smaller than controls (termed intrauterine growth restriction,
IUGR) and experienced catch up growth72. The literature has established a strong relationship between IUGR and catch up growth, insulin insensitivity, development of type
2 diabetes and obesity in offspring73. Altogether, this information suggests that preimplantation development exposure to PA may have long term negative impacts on not
only embryo development, but the adult health of offspring arising from these embryos.
1.8
PA vs. OA: Their Effects Throughout the Body
Although the effects of PA and OA have yet to be investigated during preimplantation
mouse development, these NEFAs have been thoroughly investigated in other tissues.
Interestingly, PA and OA have differential effects in many tissues. PA is implicated as
being pro-apoptotic, while OA has been shown to have beneficial and protective effects
against PA. For example, a recent review reported that PA is proinflammatory and induces
by relatively lower concentrations of OA in many tissues, including hepatocytes and
pancreatic cells74.
The literature shows that PA has consequences in that it reduces insulin sensitivity in
hepatocytes 59 and skeletal muscle 75, thereby contributing to the development of type 2 diabetes mellitus (T2DM). Conversely, OA is protective against insulin resistance and
T2DM 74. OA protected against PA-induced insulin resistance and apoptosis in hepatocytes59. PA dose-dependently increased podocyte ROS production and apoptosis, suggesting its contribution to podocyte loss in the kidney and subsequent development of
diabetic nephropathy 76. When administered intraperitoneally (IP), PA causes behavioral abnormalities as well, such as anxiety-like symptoms in mice 77. Unpublished data that was collected during my undergraduate thesis (Appendix A) showed that increasing doses of
PA displayed a concentration responsive reduction in the number of early stage mouse
embryos reaching the blastocyst stage over the 2 days that they were in culture.
The literature suggests that PA mediates its negative effects through a variety of
mechanisms65,78, including alterations to membrane fluidity, ER stress, triacylglycerol (TAG) synthesis, lipid accumulation, mitochondrial function, ceramide synthesis, and ROS
Figure 3. Mechanisms through which palmitic acid mediates its effects.
Upon entering the cell, palmitic acid causes lipotoxicity in many tissues, seen as ER stress,
reactive oxygen species (ROS) production and apoptosis. This lipotoxicity is mediated
through alterations in mitochondrial activity (beta oxidation and mitochondrial superoxide
levels), triglyceride synthesis, ceramide levels, and at the level of toll-like receptor 4
(TLR4). PA-associated lipotoxicity reduces cell viability and is associated with many
1.9
PA vs. OA: Differential Effect on ER Stress Activation
In general, PA induces ER stress and apoptosis among many cell systems including
primary rat hepatocytes79, primary neonatal cardiomyocytes (NCMs)80, and H9C2 cardiomyoblasts81, amongst other cell types investigated to date79,82–87. Interestingly, PA and OA, the two most abundant NEFAs in the human body, have very different effects on
tissues and cells exposed to them. PA is more apoptotic88,89, whereas OA is protective against PA’s effects59,90. ER stress occurs in response to an accumulation of unfolded or
misfolded proteins in the ER. The UPR pathway is activated in an attempt to alleviate this
stress91. If unable to establish homeostasis, the UPR results in apoptosis92. Differential effects of physiologically relevant doses of PA and OA on ER stress were clear in hepatoma
cells, where PA induced ER stress and OA did not93,94. In primary NCMs, PA induced both ER stress and apoptosis whereas OA alone did not80. In these NCMs, OA prevented PA-induced ER stress and apoptosis80.
In cardiomyoblasts, OA treatment increased lipid droplet (LD) levels whereas PA
treatment did not affect LD accumulation, visualized as BODIPY staining81. This lack of increase in LDs with PA treatment was not due to a lower supply of neutral lipid, as more
PA accumulated in the cells than OA, and fatty acid oxidation was reduced with PA
exposure81. Thus, Akoumi et al. concluded that the reductions in LDs with PA were due PA storage as diacylglycerols (DAGs), whereas OA is largely stored as TAGs. Piccolis et
al. found that PA also incorporated into lyso-phosphatidic acids, lyso-phosphatidylinositol,
and phosphatidic acids85. Since TAGs, but not DAGs, are neutral lipids that can be stored in lipid droplets this suggests that PA accumulates in the ER as DAGs rather than being
incorporated into LDs81. Accumulation of PA in the ER likely contributes to induction of ER stress, activation of the UPR and apoptosis should the ER stress not be relieved. In
contrast, the Akoumi group reported that in primary NCMs, both PA and OA increased
lipid droplet levels, visualized as BODIPY staining80. Differences in the effect of PA on
lipid droplet levels80,81 signifies that depending on the cell type, PA has different effects on
PA’s effects are broad across many different tissues, however the effect of PA and OA in
the reproductive tract, specifically during preimplantation embryo development, has not
been extensively investigated and defined.
1.10
The Endoplasmic Reticulum and its Function
The endoplasmic reticulum (ER) is a cellular organelle with a vast variety of functions.
These include, but are not limited to, protein synthesis and processing, triglyceride
synthesis, and lipid droplet synthesis.
1.10.1 Protein Synthesis and Processing
The Central Dogma defines that within a cell, DNA is transcribed into messenger RNA
(mRNA), which is then translated by ribosomes into proteins. Ribosomes can be found
throughout the cell, with different types of proteins being produced by ribosomes in
different areas. For example, cytosolic proteins are translated by cytosolic ribosomes95. However, proteins destined to be exported or shuttled elsewhere are produced through
translation of mRNA by membrane-bound ribosomes on the ER95. A signal sequence on the N-terminus of immature polypeptides targets these proteins to the ER96. After translation, release of the nascent polypeptide from the ribosome allows for shuttling of
these newly synthesized proteins across the ER membrane and into the ER lumen97. Post-translational modification of proteins occurs in the ER. This allows for production of
mature proteins which are properly folded and capable of carrying out their unique
functions.
1.10.2 Triacylglyceride Synthesis
Fatty acids (FAs), either bound to albumin or contained in lipoproteins, are found
extracellularly. Once released, FAs enter the cell where they are conjugated to CoA98. A
series of enzymatically catalyzed reactions in the ER allows for formation of
diacylglycerols (DAGs), which can then form TAGs98,99. Conversion of DAG to TAG is the final step of TAG formation and is catalyzed by diacylglycerol acyltransferase (DGAT)
enzymes DGAT1 and DGAT2. A review by Ahmadian et al. presented that DGAT1 and
birth in mice, whereas DGAT1 knockout mice survived and were resistant to obesity and
insulin insensitivity99.
1.10.3 Lipid Droplet Synthesis
LDs are organelles found in cells throughout the body. PA and OA differentially affect LD
accumulation. Since OA is steatotic and causes lipid accumulation, exposure to OA
increases LD number in many cell types. LDs are made up of a phospholipid monolayer
surrounding a neutral lipid core mainly consisting of TAGs98. LD formation occurs in the ER with perilipin proteins stabilizing the LD as it forms100. As TAGs accumulate within the ER, the lipid droplet increases in size and eventually buds off of the ER and into the
cytosol101.
1.10.4 The ER Stress Response
The UPR is a conserved pathway in mammals which is activated in response to
endoplasmic reticulum (ER) stress91,92. ER stress occurs when there is an accumulation of unfolded or misfolded proteins in the ER. This activates the ER stress pathway, of which
the UPR is a part. Other factors such as interruptions in calcium homeostasis can also
induce ER stress and the UPR102. When a cell undergoes ER stress, the UPR is activated in an attempt to alleviate the stress on the ER. The UPR does this by91,92:
1) Increasing ER-associated protein degradation (ERAD).
2) Decreasing protein synthesis.
3) Producing chaperones to aid in protein folding.
If unable to alleviate the stress and reestablish homeostasis, cells experiencing chronic ER
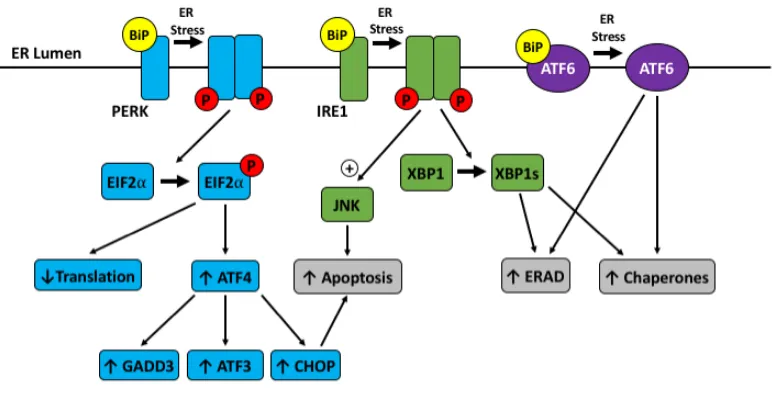
Figure 4. The unfolded protein response.
ER stress due to misfolded/unfolded proteins activates the unfolded protein response
(UPR). With ER stress BiP dissociates from the transmembrane protein transducers of the
UPR which make up the 3 different arms: 1) PRK-like ER kinase (PERK, blue), 2)
inositol-requiring enzyme 1 (IRE1, green), or 3) activating transcription factor 6 (ATF6, purple),
which activates the UPR. Activation of the PERK arm causes reduced translation, and
increases ATF3, ATF4, growth arrest and DNA damage-inducible protein (GADD34), and
C/EBP homologous protein (CHOP) downstream of EIF2. Activation of the IRE1 arm
results in X-box binding protein 1 (XBP1) splicing and jun N-terminal kinases (JNK)
activation. Altogether, activation of the three arms of the UPR acts to alleviate ER stress
by 1) decreasing protein load by reducing translation 2) increasing ER-associated protein
degradation (ERAD), and 3) facilitating protein folding through increasing chaperone
production. If unable to alleviate ER stress, the UPR results in apoptosis.
The UPR (Figure 4) has three different arms, each of which is regulated by a
transmembrane protein on the ER membrane: 1) PRK-like ER kinase (PERK), 2)
inositol-requiring enzyme 1 (IRE1), or 3) activating transcription factor (ATF) 692. Immunoglobulin heavy-chain binding protein (BiP), encoded by the gene HSPA5, is a
chaperone found in the ER92,105 which is essential for preimplantation embryo development106. BiP acts as a chaperone, stabilizing newly produced proteins as they are brought into the ER prior to further processing, as well as when exporting unwanted
proteins out of the ER for degradation107. When there is no ER stress, BiP binds to and inhibits PERK, IRE1, and ATF691,92. Upon induction of ER stress, BiP dissociates from these transmembrane UPR transducers, removing its inhibitory effect, and interacts with
irregular proteins in the ER to promote correct folding91,92. When unbound from BiP, PERK, IRE1, and ATF6 are in an active state and each of the three arms of the UPR are
activated92.
Once unbound from BiP, PERK monomers form a dimer and autophosphorylation occurs.
The phosphorylated PERK dimer has kinase activity, allowing it to phosphorylate
downstream components such as eukaryotic initiation factor 2 alpha (EIF2).
Phosphorylated EIF2 causes a decrease in translation of mRNA into protein, and
increases translation of activating transcription factor 4 (ATF4)92. ATF4 increases
transcription of growth arrest and DNA damage-inducible protein (GADD34), activating
transcription factor 3, and C/EBP homologous protein (CHOP)91,92, with ATF3 further increasing the abundance of GADD34 and CHOP proteins91. CHOP promotes apoptosis, in part, by increasing GADD34, a regulatory subunit of protein phosphatase 1 (PP1)91,92.
Activation of PP1 results in dephosphorylation of EIF2, causing an increase in translation
of mRNAs and ER stress108.
When unbound from BiP, IRE1 forms a dimer, and autophosphorylation occurs, activating
its endoribonuclease activity. This allows IRE1 to cleave X-box binding protein 1 (XBP1)
to form XBP1s. XBP1s acts as a transcription factor and increases transcription of
chaperones and components of ERAD. Activation of the IRE1 arm of the UPR promotes
synthesized in the ER, IRE1 directly degrades mRNAs in the ER through a process called
regulated IRE1-dependent decay (RIDD)92.
Under ER stress, ATF6 is unbound from BiP and is transported to the Golgi apparatus
where it is cleaved. The cleaved protein then causes an increase in transcription of protein
chaperones and ERAD machinery.
1.11
PA vs. OA: Differential Effect on Mitochondrial ROS
production
Another organelle which is differentially affected by PA an OA is the mitochondrion.
Fayezi et al. suggested that OA aids in preimplantation embryo development by reducing
oxidative stress and altering energy production110, both of which occur in the mitochondria. The mitochondrion is often referred to as the powerhouse of the cell and is a key site for
metabolism and energy production. Large amounts of ATP are produced here by the citric
acid cycle (2 ATP/glucose molecule) and electron transport chain (ETC, 34 ATP/glucose
molecule). In the ETC, electrons are passed through the chain to create a proton gradient
that powers ATP synthase. Oxygen acts as the final electron acceptor and water is
produced, however as a result of ETC activity, a portion of the electrons contribute to
producing superoxide111. Elevated mitochondrial ROS levels are associated with aging and
disease112.
PA and OA have different effects on mitochondrial ROS production. In cardiomyocytes
PA, but not OA, causes an increase in mitochondrial ROS levels113. In skeletal myotubes OA prevented PA-induced atrophy which was associated with a decrease in mitochondrial
superoxide production114. This suggests that increasing ROS levels may be a mechanism through which PA mediates its effects or that mitochondrial superoxide accumulation is a
result of PA-induced mitochondrial dysfunction.
1.12
Rationale
Investigating the effects of NEFAs on preimplantation embryos in vitro is required and will
expand our understanding of women’s reproductive biology two-fold. First, understanding
insight into understanding the mechanisms affected by NEFAs during mammalian
preimplantation embryo development in general. As presented earlier, PA and OA have
well established and different effects in other cell types, and the protective effect of OA in
preimplantation mouse embryos had yet to be investigated prior to this study. This study
provides us with a better understanding of the mechanisms altered with the high-fat
environment in an obese mother (such as ER stress, mitochondrial superoxide and lipid
droplet accumulation), which may affect preimplantation development in vivo. Second,
with ARTs, production of the greatest number of viable, developmentally competent
embryos is essential in order to minimize the emotional, physical, and financial cost of
treatment. Investigating ways in which modification of the in vitro culture environment can
alleviate deleterious effects of exposure to certain NEFAs will promote their translation to
the fertility clinic to optimize culture media and produce the greatest number of
high-quality embryos for transfer and fertility success. This study presents critical early data that
initiates this process of translatable outcomes that will result in eventual optimization of
human in vitro embryo culture media, and especially so, for the obese patient.
1.12.1 Objectives and Hypotheses
Previous research from my undergraduate thesis discovered that PA reduces the proportion
of mouse embryos that develop from the two-cell stage to the blastocyst stage.
Interestingly, the literature has shown in other tissues that the negative effects of PA can
be prevented by OA exposure59,63,74,90,115–119.
The overall objective of my MSc thesis research is to investigate whether impaired
development seen with PA exposure alone can be prevented by OA co-treatment.
Additionally, I aimed to identify and investigate the mechanisms underlying these effects
during mouse preimplantation development in vitro.
1.12.2 Specific Aims
1. Define the effects of OA treatment on mouse preimplantation development to the
blastocyst stage relative to non-NEFA media. This will be investigated by assessing
developmental progression of embryos after exposure of 2-cell embryos to OA for
2. Determine the effects of co-culture of embryos in both PA and OA on mouse
preimplantation development to the blastocyst stage. This will be investigated by
assessing developmental stage of embryos after exposure of 2-cell embryos to 100 l PA alone or in combination with either 50, 100 or 250 M OA for 46 hours.
3. Investigate the mechanisms underlying the effects of PA and OA co-culture,
including ER stress, lipid droplet abundance, and mitochondrial ROS production.
1.12.3 General Hypothesis
OA exposure from the two-cell stage onward will attenuate PA-induced reductions in the
proportion of mouse embryos developing to the blastocyst stage.
1.12.4 Specific Hypotheses
1. In contrast to PA reducing embryos’ capacities to develop to the blastocyst stage,
mouse embryos exposed to OA will develop to the blastocyst stage at similar
proportions to control embryos.
2. OA will attenuate PA-induced reductions in the proportion of embryos developing
to the blastocyst stage.
3. PA will elevate ER stress pathway constituent mRNA levels and mitochondrial
superoxide production, both of which will be reduced when OA co-treatment with
PA occurs.
4. Culture of embryos in PA or OA results in altered lipid handling – with OA
Chapter 2
2
Materials and methods
2.1
Animal Source and Ethics Approval
All experiments were performed using CD-1 mice from Charles River Laboratories
(Saint-Constant, QC). All mice were handled according to the Canadian Council on Animal Care
and Western University’s Animal Care and Use Policies (protocol #: 2018-075 to Dr.
Andrew J. Watson). Mice were housed using conventional housing with a 12-hour
light/dark cycle and access to food ad libitum. Documentation of ethics approval can be
found in Appendix B.
2.2
Mouse Superovulation and Mating
Four to six-week-old female mice received intraperitoneal (IP) injections of 7.5
international units (IU) of pregnant mare’s serum gonadotropin (PMSG, Merck Animal
Health, Canada) to stimulate follicular recruitment. 48 hours later, these same females were
IP injected with 7.5 IU human chorionic gonadotropin (hCG, Merck Animal Health,
Canada) to stimulate ovulation. Immediately after hCG injection, each female was placed
in a cage with a single male CD-1 mouse for natural mating overnight. Injection and
subsequent placement of females with males were performed between 4 pm and 6 pm for
all experiments. The following morning, vaginas of the female mice were visually checked
for a seminal plug, which indicated that successful mating had occurred. Unmated females
were marked, and all of the superovulated females were placed in their original housing
cage. Forty-six hours post-injection (hpi) of hCG, all female mice were sacrificed through
CO2 asphyxiation, and those with confirmed seminal plugs were dissected to isolate the
oviducts. M2 flushing medium (Sigma Aldrich, Canada) was warmed to 37oC, drops of this media were added to a dish which was placed on a flask of water heated to 37oC under a heating lamp. This system was used during the process of isolating the embryos to
maintain temperature of the culture environment. Under a light microscope, each oviduct
was flushed using a syringe, needle (30Gx1/2), and warmed M2 flushing medium. Two
cell embryos were washed thrice in 50 l drops of potassium simplex optimization media
essentially fatty acid free bovine serum albumin (BSA, Sigma-Aldrich, Canada). After
washing, these embryos were distributed amongst the given treatment groups for that
experiment and cultured in 20 l drops at a density of 1 embryo per microliter. For
example, 40 embryos were distributed amongst two drops to maintain the embryo to
medium ratio. Embryos were cultured for 46 hours, to what is expected to be the blastocyst
stage, after which various analyses were performed.
2.3
NEFA Preparation and Embryo Culture
Essentially FFA-free BSA was added to PBS and dissolved overnight to create a 20% BSA
solution. This solution was filter sterilized and used downstream for conjugation to palmitic
acid (PA, Sigma-Aldrich, Canada) or oleic acid (OA, Sigma-Aldrich, Canada). Stock PA
and OA solutions were prepared by solubilizing each fat in RNAase-free water using
NaOH at 70oC to create a 20 mM solution.
This stock sample was conjugated in a 2:1 molar ratio to BSA to create a final 500 M
NEFA solution that was stored at 4oC. Experiments were performed where 2 cell embryos were cultured in NEFA conjugated 2:1 to BSA in KSOMaa.
Experiment 1: Effects of OA exposure on preimplantation embryo development
Experiment 1 defined the concentration response effects of OA treatment alone (50, 100,
250, and 500 M OA) on mouse preimplantation development. Controls for BSA content
of 1 mg/ml or 1.5% BSA in KSOMaa medium were used to test whether BSA
concentration altered embryo development.
Experiment 2: Effects of OA exposure on PA-induced effects on preimplantation embryo
development
Experiment 2 defined the concentration response effects of OA and PA in combination on
preimplantation development. Experiment 2 treatments included: BSA control, 100 M
2.3.1 Embryo Culture
The BSA content was controlled for between treatments using 1.5% BSA in KSOMaa,
which was prepared from the original 20% BSA solution. For all treatment experiments,
20 2-cell embryos were placed into 20 l drops of the appropriate treatment medium
covered by embryo-grade mineral oil (Zenith Biotech, Canada). Embryos were cultured
under a 5% CO2, 5% O2, and 90% N2 atmosphere at 37oC for 46 hours to assess progression
to the blastocyst stage. The percentage of embryos at each stage of preimplantation
development following 46 hours of culture was determined prior to embryo collection and
processing for transcript abundance analysis, or lipid droplet assessment and mitochondrial
superoxide detection using confocal microscopy.
2.4
Developmental Stage Analysis
At the end of the culture period (46 hours), embryos were examined under a light
microscope. The number of embryos at each stage of pre-implantation development was
recorded. Embryos were classified as either a blastocyst, morula, 8-cell, 4-cell, 2-cell or
degenerated embryo. Two-cell, 4-cell and 8-cell embryos exhibited 2, 4, and 8 distinct
blastomeres, respectively. Morulae were defined as embryos where distinct blastomeres
could not be identified or counted but no visible fluid-filled cavity was apparent.
Blastocysts were defined as any embryo with a visible fluid-filled cavity. Degenerated
embryos were those with visibly degraded blastomeres (often with a compromised cell
membrane and are dark and granular in appearance). For further analyses, only embryos
that showed development to beyond the 4-cell stage and did not have degraded blastomeres
were assessed. After developmental analysis, embryos were either exposed to a live stain
and visualized, snap frozen at -80oC for RNA extraction, or fixed for future staining and confocal microscopy.
2.5
RNA Extraction and Reverse transcription
The ARCTURUS PicoPure RNA Isolation Kit (Life Technologies, Burlington, ON) was
used per the manufacturer protocol to extract total RNA from preimplantation mouse
embryos. Exogenous luciferase mRNA (0.0025 pg/embryo, Promega, USA) was added for
threshold (2-Ct) method. To eliminate genomic DNA, DNase 1 (RNA free DNase kit, Qiagen, Louisville, KY) was added in an additional step. VILO cDNA Synthesis Kit
(Invitrogen, Burlington, ON) was used according to the manufacturer protocol to reverse
transcribe the extracted RNA into cDNA. cDNA was diluted to 1 embryo/l using
PCR-grade water.
2.6
Transcript Detection through Polymerase Chain
Reaction (PCR)
To confirm the effectiveness/quality of cDNA synthesis, PCR was performed for H2A and
luciferase. Each reaction included 2.5 l of 10X PCR buffer, 0.75 l MgCl2, 0.5 l dNTPs,
0.1 l each of the forward and reverse primer, 0.2 l Taq Polymerase, and 19.85 l
RNase-free water. The cycling conditions for both H2A and luciferase were: 94oC for 2 min, followed by 44 cycles of 94oC for 30 seconds, 61oC (H2A) or 59oC (luciferase) for 30 seconds, 72oC for 1 minute, and a last step of 72oC for 10 minutes. PCR products were run on a 2% agarose gel for H2A/luciferase with ethidium bromide in TAE running buffer at
100V for one hour, after which the gel was imaged.
For XBP1 mRNA transcript detection, cycling conditions were: 94oC for 2 min, followed
by 45 cycles of 94oC for 30 seconds, 61oC for 30 seconds, 72oC for 1 minute, and a last
step of 72oC for 10 minutes. XBP1 PCR products were run on a 4% agarose gel with TBE running buffer at 60 V for 3 hours. Positive controls contained cDNA from embryos that
were treated with the potent and reliable ER stress inducer tunicamyin120 while negative controls included RNase-free water in place of cDNA. Splicing of XBP1 was quantified
using ImageJ software on three biological replicates.
2.7
Quantitative PCR (qPCR) for assessment of relative
transcript levels
Quantitative PCR was performed using Taqman primer probes (Invitrogen, Canada) for
target genes in a 384-well plate. Based off of the total number of wells needed in an
experiment, a mastermix (MM) was prepared. For each well, 20 l of stock MM was
total volume(V)), TaqMan primer probe (volume=0.05xV), and RNase-free water (volume
= 0.4 x V). Once the three components were combined, the mixture was vortexed, 62.7 l
of MM for each treatment group were aliquoted into Eppendorf tubes, to which 3.3 l
(equivalent to 1 embryo/l) of cDNA were added. This mixture of master mix and cDNA
was vortexed, and 20 l was added in triplicate wells to the PCR plate. For each gene, a
negative non-transcript control was included, where RNase-free water replaced the cDNA.
A film was then used to seal the wells, and the plate was centrifuged at 1800 rpm for 2
minutes. Using a BioRad CFX384 TouchTM Real-Time PCR Detection System, qPCR was run according to the following conditions: 5 minutes at 95oC (AmpliTaq GOLD DNA polymerase activation step), followed by 50 cycles of 15 seconds at 95oC (denaturation) and 1 minute at 60oC (annealing and extension). To assess ER stress, primer probes for
ATF3 (Mm00476032_m1), CHOP (Mm01135937_g1 Ddit3), and ATF6
(Mm01295317_m1 Atf6) were used. In assessing triacylglyceride synthesis, DGAT1
(Mm00515643_m1 Dgat1), and DGAT2 (Mm00499536_m1) transcripts were assessed.
Three biological replicates were assessed for each gene.
2.8
Confocal Microscopy
Confocal microscopy was performed using the 10x objective lens on a Zeiss LSM800
microscope. Z-stacks were imaged in 5 m slices. Images were processed using FIJI and
Ilastik software. When imaging, all treatment groups within an experiment were visualized
using the same laser intensity and settings.
2.9
BODIPY staining to assess embryo lipid droplet
accumulation
After the 46-hour culture treatment period, embryos from each treatment and control were
placed in 2% paraformaldehyde for 30 minutes for fixing. They were then washed thrice
in PHEM and placed at 4oC. BODIPY 493/503 (Thermo Fisher, USA) was solubilized in DMSO to a concentration of 2.5 mg/ml to create a stock solution, and an aliquot was diluted
to 20 g/ml using KSOMaa medium. Embryos from all treatment groups, except the
negative control, were placed in 20 l drops of BODIPY solution covered in embryo-grade
published literature121. Embryos were then washed thrice in PBS and added to 10 l drops
of PBS covered in mineral oil in a glass-bottom dish. An independent group of embryos
exposed to OA at varying concentrations were used to set the laser intensity (Alexa Fluor
488). Embryos were imaged using confocal microscopy at 10 times magnification. Within
a group each embryo was considered to be a biological replicate (N=12-18), such that the
fluorescence of a single embryo was quantified and contributed to determining mean
fluorescence within a treatment using Ilastik software.
2.10
MitoSox Superoxide Stain
Staining live embryos for mitochondrial superoxide was performed using the same
methods outlined in a recent publication from our lab122. MitoSox Red mitochondrial
superoxide indicator (Life Technologies, USA) was solubilized in DMSO and diluted using
KSOMaa to a concentration of 5M. Culture dishes were prepared with 20 l drops of this
medium covered in embryo-grade mineral oil. Live embryos (N=19-28) were incubated in
this solution for 1 hour at 37oC 5% O2, 5% CO2 and 90% N2. A no-BODIPY negative
control was also included. Embryos were then washed thrice in KSOMaa and added to 10
l drops of KSOMaa in a glass-bottom dish for imaging through confocal microscopy at
10 times magnification. An independent group of embryos exposed to 100 M PA
treatment were used to set the confocal laser intensity (Alexa Fluor 568). Embryos were
imaged using confocal microscopy at 10x magnification.
2.11
Statistical analyses
GraphPad PRISM 8 was employed to perform statistical analyses. Experiments were
performed on a minimum of three biological replicates. For imaging studies, a biological
replicate was defined as a single embryo within a treatment. However, for assessments of
developmental stage and mRNA abundance through qPCR, a biological replicate was
classified as a single pool of embryos within a treatment group. The number of blastocysts
within experiment 1 and experiment 2 were analyzed using a one-way analysis of variance
(ANOVA) text, and means were compared to one another by an ad-hoc Tukey’s multiple
comparisons test. The same statistical analyses were used when analyzing the number of
threshold values from qRT-PCR, relative amounts of mRNA were quantified using the
delta delta cycle threshold (2-Ct) method followed by One-Way ANOVA and Tukey’s
multiple comparisons tests. P values less than or equal to 0.05 were considered statistically
Chapter 3
3
Results
3.1
Effects of PA and OA on preimplantation embryo
developmental stage
My preliminary unpublished data (4th year thesis; Appendix A) demonstrated that PA significantly reduces (P<0.05) mouse embryo development to the blastocyst stage in a
concentration responsive manner, beginning at a 50 M concentration. Outcomes from the
first experiment suggest differential effects of PA and OA. Representative images of OA
treated embryos and non-treated controls are shown in Figure 5. When compared to PA
alone, there were morphological differences in embryos that were exposed to OA alone
(Figure 5) or in combination with PA (Figure 6). Embryos exposed to only PA displayed
some fragmentation and blastomeres that were unequal in size. However, embryos exposed
to OA alone or in combination with PA did not display these characteristics.
Additionally, PA and OA differentially affected blastocyst development (Figure 7). At all
concentrations (0-500 M) of OA treatment from the 2-cell stage onward, blastocyst
(Figure 7A), morula (Figure 8A), 8-cell (Figure 9A), and 2 to 4-cell (Figure 10A)
percentages did not differ from untreated controls (P>0.05, N=3). However, 250 and 500
M OA treatment did result in a greater number of embryos with degraded blastomeres
(P=0.01, N=3, Figure 10A) than controls. Controls for BSA content (BSA=1.5% BSA, 0=1
mg/ml BSA, P>0.05, N=3, Figure 7A) showed that BSA content of the NEFA-containing
media did not affect embryo development to the blastocyst stage.
To assess the effect of OA exposure in embryos exposed to PA, embryos were cultured in
either control media, 100 M PA media alone, or PA in combination with 50, 100 or 250
M OA. PA alone caused a significant 6.3-fold reduction in development to the blastocyst
stage relative to controls (P<0.0001, N=3, Figure 7B), with embryos arresting in
development before the morula stage (P<0.05, N=3, Figures 9-11). The proportion of
Figure 8N). The PA-induced decreases in blastocyst development were prevented by OA
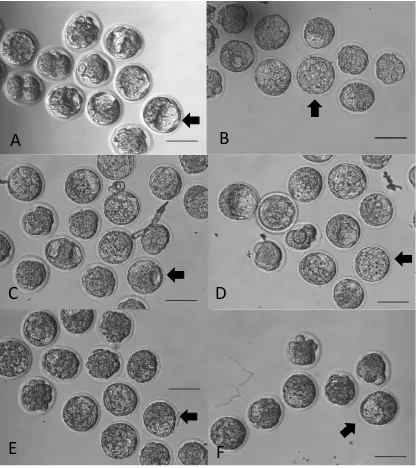
30
Figure 5. Phase contrast representative images of embryos cultured in oleic acid
(OA).
Embryos cultured from the 2-cell stage for 46 hours in A) a 1.5% BSA control, B) 1 mg/ml
BSA control, C) 50 M OA, D) 100 M OA, E) 250 M OA, F) 500 M OA. Images
were taken using a phase contrast microscope and 20x objective lens. Arrows show
representative blastocysts. Scale bars signify 100 m.
A
B
C
D
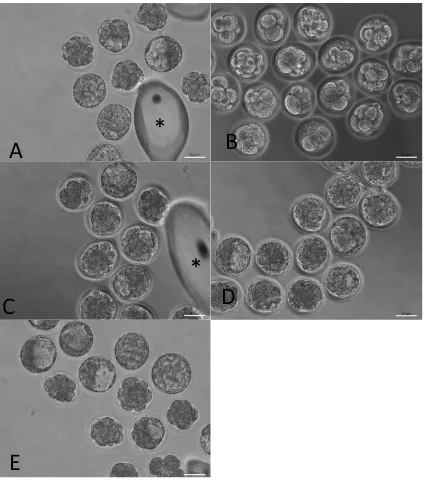
31
Figure 6. Representative phase contrast images of mouse embryos treated with
palmitic acid (PA) and oleic acid (OA).
Embryos cultured from the 2-cell stage for 46 hours in A) control, B) 100 M PA alone or
in combination with C) 50 M OA, D) 100 M OA or E) 250 M OA. Images were taken
using a phase contrast microscope and 20x objective lens. Asterisks signify oil drops which
had adhered to the dish with embryo handling. Scale bars signify 50 m.
A
B
C
D
E
*
Development to all stages of preimplantation development was no different from controls
when OA was included in PA embryo culture media (P>0.05, N=3, Figures 7-11).
Exposure to 100 M PA significantly reduced the proportion of blastocysts relative to
controls (N=13, P<0.0001, Tukey’s multiple comparisons test, Figure 7B). Co-culture of
2-cell embryos in 100 M PA with either 50, 100 or 250 M OA (N=10-12) attenuated
this PA-induced decrease such that embryos exposed to both NEFAs displayed blastocyst
development similar to controls (P>0.05, Tukey’s multiple comparisons test). Embryos
co-cultured with PA and OA showed significantly more blastocysts after culture than PA-only
embryos when 50 (P=0.005), 100 (P=0.0001) or 250 (P<0.0001) M OA was included.
Exposure to 100 M palmitic acid (PA) did not affect the number of morulae relative to
controls (N=13, P=0.99, Tukey’s multiple comparisons test, Figure 8B). Co-culture of
2-cell embryos in 100 M PA with either 50, 100 or 250 M OA (N=10-12) resulted in a
proportion of embryos being at the morula stage that was not significantly different from
controls (Figure 8B, P>0.05, Tukey’s multiple comparisons test).
Mouse embryos cultured for 46 hours from the 2-cell stage arrested at the 8-cell stage at
differential proportions with NEFA treatment. Increasing oleic acid concentrations of
0-500 M did not affect the number of 8-cell embryos after 46-hour culture (Figure 9A,
N=3, P=0.35, One-Way ANOVA). Exposure to 100 M palmitic acid significantly
increased the number of 8-cells relative to controls (N=13, P<0.0001, Tukey’s multiple
comparisons test, Figure 9B). Co-culture of 2-cell embryos in 100 M PA with either 50,
100 or 250 M OA (N=10-12) attenuated this PA-induced increase such that embryos
exposed to both NEFAs displayed 8-cell development similar to controls (P>0.05, Tukey’s
multiple comparisons test, Figure 9B). Embryos co-cultured with PA and OA showed
significantly less 8-cells after culture than PA-only embryos when 50 (P<0.0001), 100
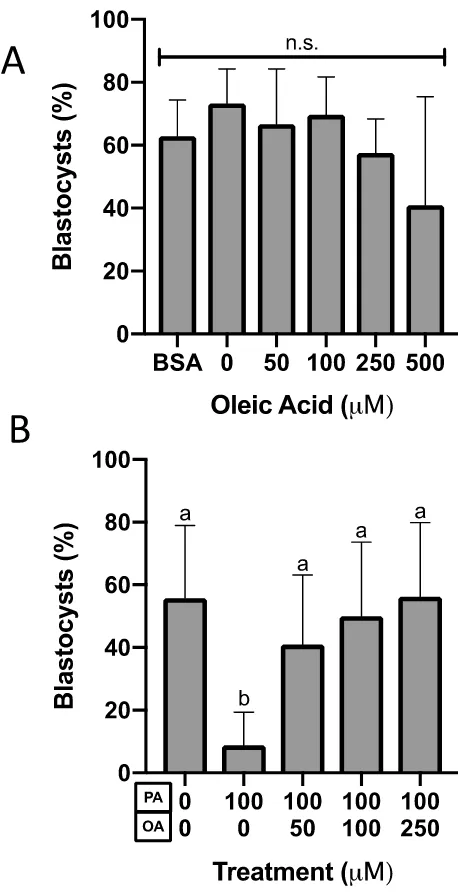
Figure 7. Blastocyst preimplantation embryo percentage after 46-hour culture.
The percentage of blastocysts after 46-hour culture in A) BSA control (1.5% BSA in
KSOM), control (1 mg/ml BSA in KSOM) or increasing concentrations of OA (N=3,
P=0.37, One-Way ANOVA) or B) co-culture in PA and OA (N=10-13, P<0.0001,
One-Way ANOVA). Bars represent the mean percentage of embryos at the blastocyst stage +
standard deviation (SD). Bars with different letters are statistically significant according to
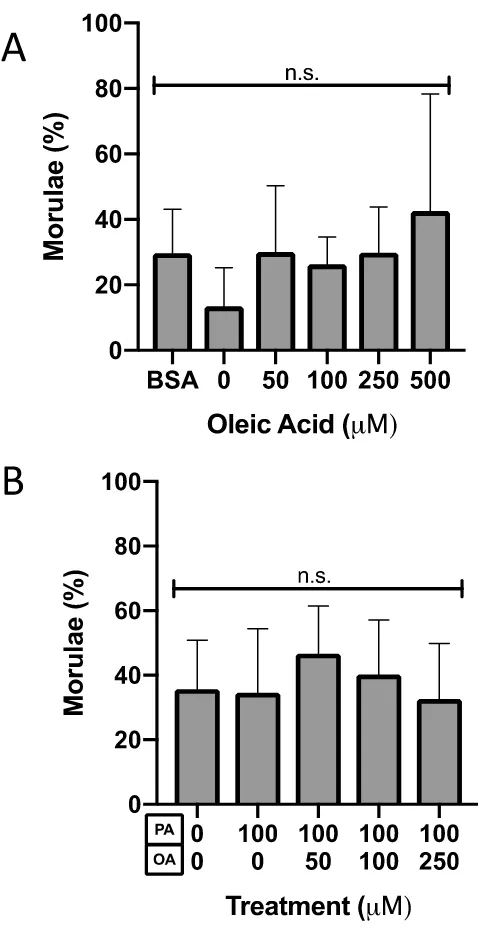
Figure 8. Morula preimplantation embryo percentage after 46-hour culture.
The percentage of mouse morulae after 46-hour culture from the 2-cell stage in A)
increasing concentrations of OA (N=3, P=0.64, One-Way ANOVA) or B) co-culture in PA
and OA (N=10-13, P=0.33, One-Way ANOVA). Bars represent the mean percentage of
embryos at the morula stage + SD. Bars with different letters are statistically significant