4594
http://dx.doi.org/ 10.3168/jds.2013-7546
© American Dairy Science Association®, 2014 .
ABSTRACT
Computer simulation is a useful tool for benchmark-ing electrical and fuel energy consumption and water use in a fluid milk plant. In this study, a computer simulation model of the fluid milk process based on high temperature, short time (HTST) pasteurization was extended to include models for processes for shelf-stable milk and extended shelf-life milk that may help prevent the loss or waste of milk that leads to increases in the greenhouse gas (GHG) emissions for fluid milk. The models were for UHT processing, crossflow micro-filtration (MF) without HTST pasteurization, crossflow MF followed by HTST pasteurization (MF/HTST), crossflow MF/HTST with partial homogenization, and pulsed electric field (PEF) processing, and were incorporated into the existing model for the fluid milk process. Simulation trials were conducted assuming a production rate for the plants of 113.6 million liters of milk per year to produce only whole milk (3.25%) and 40% cream. Results showed that GHG emissions in the form of process-related CO2 emissions, defined as CO2
equivalents (e)/kg of raw milk processed (RMP), and specific energy consumptions (SEC) for electricity and natural gas use for the HTST process alone were 37.6 g of CO2e/kg of RMP, 0.14 MJ/kg of RMP, and 0.13
MJ/kg of RMP, respectively. Emissions of CO2 and
SEC for electricity and natural gas use were highest for the PEF process, with values of 99.1 g of CO2e/kg of
RMP, 0.44 MJ/kg of RMP, and 0.10 MJ/kg of RMP, respectively, and lowest for the UHT process at 31.4 g of CO2e/kg of RMP, 0.10 MJ/kg of RMP, and 0.17 MJ/
kg of RMP. Estimated unit production costs associated with the various processes were lowest for the HTST process and MF/HTST with partial homogenization at $0.507/L and highest for the UHT process at $0.60/L. The increase in shelf life associated with the UHT and MF processes may eliminate some of the supply chain product and consumer losses and waste of milk and compensate for the small increases in GHG emissions or total SEC noted for these processes compared with HTST pasteurization alone. The water use calculated for the HTST and PEF processes were both 0.245 kg of water/kg of RMP. The highest water use was associ-ated with the MF/HTST process, which required 0.333 kg of water/kg of RMP, with the additional water re-quired for membrane cleaning. The simulation model is a benchmarking framework for current plant operations and a tool for evaluating the costs of process upgrades and new technologies that improve energy efficiency and water savings.
Key words: greenhouse gas , energy use , water use , nonthermal milk processing
INTRODUCTION
In the United States, agricultural emissions attrib-uted to the dairy sector are approximately 1.9% of total US greenhouse gas (GHG) emissions (Thoma et al., 2013). On-farm activities contribute the bulk of GHG emissions, which include CH4 and N2O emissions and,
to a lesser extent, CO2 emissions. Off-farm activities
contribute the remaining 28% of GHG emissions and are mainly energy-related CO2 emissions because of
fos-sil fuel use. Off-farm activities include transportation of milk from the farm to the processing plant; milk processing, packaging, and plant cold storage; transpor-tation to distributors and retailers; and refrigeration of milk in the home.
At the milk processing plant, CO2 emissions arise
mainly from natural gas, although other fossil fuels may be used in some cases (NRCan, 2001), and electricity.
Computer simulation of energy use, greenhouse gas emissions,
and costs for alternative methods of processing fluid milk
1P. M. Tomasula ,*2 N. Datta ,† W. C. F. Yee ,* A. J. McAloon ,‡ D. W. Nutter ,§ F. Sampedro ,# and L. M. Bonnaillie *
* Dairy and Functional Foods Research Unit, USDA, Agricultural Research Service, Eastern Regional Research Center, 600 E. Mermaid Lane, Wyndmoor, PA 19038
† Victoria University, College of Health and Bio-Medicine, Werribee Campus, PO Box 14428, Melbourne, Victoria 8001 Australia ‡ Engineering and Scale-up, Process and Economics Research Support Group, USDA, Agricultural Research Service, Eastern Regional Research Center, 600 E. Mermaid Lane, Wyndmoor, PA 19038
§ University of Arkansas, Mechanical Engineering Department, Fayetteville 72701
# Center for Animal Health and Food Safety, College of Veterinary Medicine, University of Minnesota, St. Paul 55108
Received September 30, 2013. Accepted March 11, 2014. 1
Mention of trade names or commercial products in this publication is solely for the purpose of providing specific information and does not imply recommendation or endorsement by the US Department of Agriculture. The USDA is an equal opportunity provider and employer.
Energy information data for fluid milk plants through-out the United States and other dairying countries have been provided by Xu and Flapper (2009) so that individual plants may benchmark their performance. This information was provided in terms of the specific energy consumption (SEC), which is the energy use of the entire plant divided by the total milk production of the plant, with values ranging from 0.2 to 6.0 MJ/kg of fluid milk product. The low end of the range indicates an energy-efficient plant. To help processors lower their energy use, tools are needed so that processors may benchmark their processes and identify the unit opera-tions or interacopera-tions of unit operaopera-tions in their plants that consume the greatest amounts of energy and contribute the most to GHG emissions. Tools are also needed to help processors make changes and observe their effects in their plants, such as the implementation of new technologies on energy use and costs, without conducting costly experiments.
In a previous study (Tomasula et al., 2013), we devel-oped a model of the fluid milk process for use in process design software as a tool for improving the energy effi-ciency of processing plants and to lower GHG emissions, or the carbon footprint, of milk processing plants. The model links modules that represent the unit operations composing the fluid milk process, allowing calculation of the mass and energy balances at each unit operation and the economics of the process from literature and industry information. The model is fully customizable and allows processors to enter their own operating pa-rameters and cost data. The model was validated for several processing scenarios in fluid milk production.
A recent life cycle assessment conducted by the US dairy industry reported that the sum of GHG emissions from off-farm and on-farm activities was 2.05 kg of CO2
equivalents (CO2e)/kg of fluid milk consumed (90% confidence limits: 1.77–2.4; Thoma et al., 2013). Con-tributing to these emissions was an assumed amount of up to 12% of milk that is lost or wasted at the retail level and of up to 20% of milk that is lost at the point of consumption. One way to reduce loss and waste and thus energy use and GHG emissions further through the supply chain may be through production of fluid milk with extended shelf-life (ESL) or shelf-stable milk.
Extended shelf-life milk has a shelf life that ranges from a few days to up to 45 d under refrigeration (El-well and Barbano, 2006; Goff and Griffiths, 2006; Rys-stad and KolRys-stad, 2006) if made with good quality raw milk, sterile filling systems, and careful handling during storage and distribution to maintain temperature below 6°C. Extended shelf-life milk is known as ultrapasteur-ized (UP) milk if heated to a temperature ≥137.8°C for ≥2s and packaged nonaseptically. It may also result from processes that heat milk to about 127°C with
a hold time of 5 s (Goff and Griffiths, 2006) or that microfilter milk to remove somatic cells, bacteria, and spores and then heat-treat it using HTST pasteuriza-tion at about 74°C (Elwell and Barbano, 2006; Hoffman et al., 2006). Shelf-stable milk is UHT milk that has been heat treated at a temperature ≥137.8°C for ≥2s and packaged aseptically (Datta et al., 2002). It uses a commercial sterilization process lethal to microorgan-isms and spores and has a shelf life of 6 mo.
The fluid milk process may be considered to extend from milk reception and storage of raw milk in silos to cold storage; it includes milk standardization (6.7%), homogenization (9.2%), HTST pasteurization (16.1%), filling and packaging (23.7%), cleaning-in-place (CIP; 41.3%), and waste-water treatment (0.8%) operations. The values in parentheses are the percentage energy use associated with the operations on a cold-storage-free basis determined by computer simulation (Tomasula et al., 2013). However, cold storage of milk can contribute an estimated 5 to 60% of GHG emissions depending on whether cold storage is considered only as a part of the processing plant or considered to extend to a distribution center and retail outlets. Milk packaging, homogenization, standardization, and cold storage utilize electrical energy whereas milk pasteurization and CIP require steam from fossil fuel burning. It is apparent from the list above that several of the unit operations could be targeted for reductions in energy use. For instance, process simulation may be used to examine the energy use and GHG emissions of other milk preservation technologies, such as UHT processing and microfiltration (MF), and alternative technolo-gies, such as pulsed electric fields (PEF; Toepfl et al., 2006). Pulsed electric field processing is a nonthermal technology that has the potential to pasteurize milk by exposure to short, high-voltage electric pulses. These processes may demonstrate savings in energy, GHG emissions, and water use compared with HTST pas-teurization (Tomasula and Nutter, 2011; Tomasula et al., 2013) but it would be difficult to investigate the processes in a laboratory or pilot-plant setting.
The goal of this study was to develop models for alternative pasteurization methods for milk such as UHT processing, crossflow MF, and PEF processing; incorporate them as modules into the fluid milk simula-tor; and use them to calculate the energy use, GHG emissions, water use and economics of the processes compared with HTST pasteurization.
MATERIALS AND METHODS
Model Development
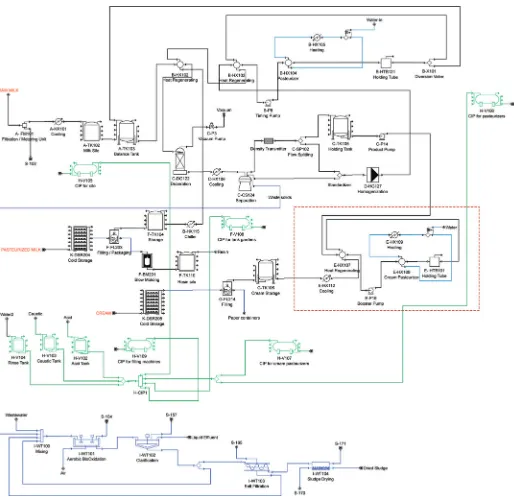
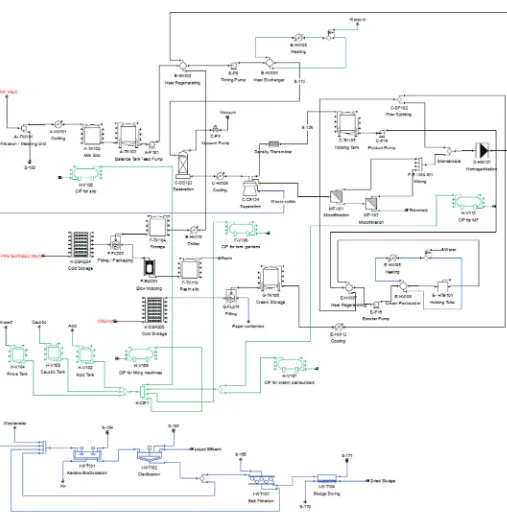
with equipment specifications and cost data, using the commercial software package SuperPro Designer (http://www.intelligen.com, Version 9.0 Build 8; Intel-ligem Inc., Scotch Plains, NJ). The flow sheet diagram of the fluid milk process from Tomasula et al. (2013) is shown in Figure 1. It is used as the template for the inclusion and development of models for UHT process-ing of milk, crossflow MF with or without HTST pas-teurization, crossflow MF with partial homogenization followed by HTST pasteurization, and PEF processing.
The simulations of the various plants assumed a medium-sized plant processing 113.6 million L/yr (30.0 million gal/yr), or 27,300 L/h of raw whole milk to pro-duce 3.25% milk (whole milk) and 40% cream (cream with 40% fat content). No other products are assumed. The simulations extend from storage of raw milk in silos to cold storage of the packaged product temporar-ily on site, if applicable, for the particular model. The plants are assumed to operate continuously with milk processed for 260 d/yr, 16 h/d, with 8 h dedicated to cleaning in accord with the previous study (Tomasula et al., 2013). The separate models and processes are described below.
Description of the Models
Fluid Milk Process with HTST Pasteuriza-tion. This base case assumes the FMPM with the flow sheet given in Figure 1. Briefly, we assumed that raw milk was pumped from the milk silos to the balance tank and drawn to the first preheat regenerating heat exchanger (B-HX102). The milk was then deaerated and separated into skim milk and cream streams. The cream was processed into heavy cream. The milk was homogenized before entering the second preheat regen-erating heat exchanger (B-HX103) and then assumed pasteurized (B-HX104) at 77°C, followed by a hold time of 22 s (B-HTB121). The regeneration rates of the milk and cream pasteurizers were assumed as 94%, in keep-ing with Tomasula et al. (2013). Cream was pasteurized at 90°C with a hold time of 15 s. The milk was cooled by regenerative cooling and then packaged in high-density polyethylene gallon jugs, blown on site. Cream was packaged in paper pint containers. Milk and cream were stored on site at 1.8°C for up to 1.5 d until shipped to a distribution center or retail stores.
Two values of energy consumption for onsite cold storage were used previously (Tomasula et al., 2013) to illustrate the difference in total energy use between a plant having cold storage with high energy consumption and one with low energy consumption. In this study, all plants were assumed to have energy efficient, onsite cold storage. A value of electricity index of 0.840 kWh/m2 per day (ASHRAE, 2007) for refrigerated warehouses
was used to calculate energy use. Case washing was accomplished using ultrasonic washers that consumed 6,000 L/d of water. All plants had a cold storage facil-ity for milk and cream, with the exception of the UHT plant, which had cold storage for the cream only.
The CIP operations were assumed with each cleaning step modeled as one cycle per day. One skid was desig-nated for the milk silos, tanks, and filling machines. A second was designated for the pasteurizers. For plants with MF, an additional CIP tank was added for clean-ing the membranes. Wastewater from the ultrasonic case washers and CIP operations and the sludge from the separator were sent to an onsite aeration tank for the bio-oxidation of the organic material in the stream.
Fluid Milk Process with UHT Processing. The UHT processing of milk is conducted at a minimum temperature-time combination of ≥137.8°C for ≥2s but is frequently conducted at higher temperatures and holding times. Either direct or indirect heating (Bur-ton, 1988; Datta et al., 2002) is used. In direct heating, superheated steam is mixed directly with milk. Indirect heating is accomplished using tubular heat exchang-ers or plate heat exchangexchang-ers for heating of milk. Both methods are in use throughout the world, with indirect heating being more common. The indirect heating method is assumed in this study.
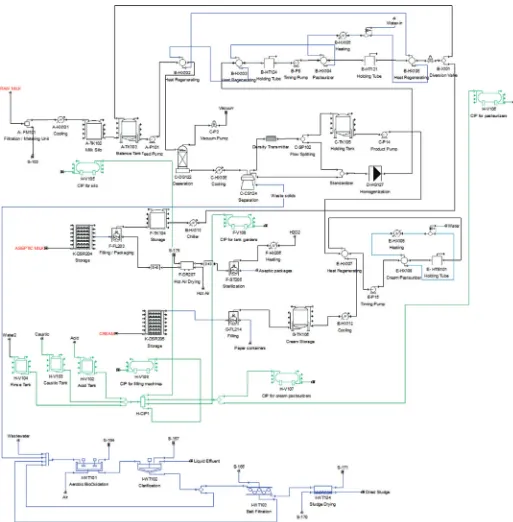
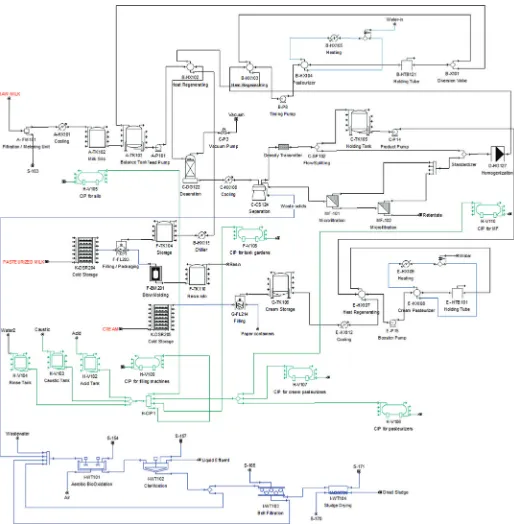
The process model for UHT processing (Figure 2) builds upon the base case FMPM of Figure 1, with removal of the HTST pasteurizers from the model and replacement with tubular heat exchangers according to the generic process flow sheet found in Burton (1988). The packaging equipment of the base FMPM was replaced with an aseptic packaging line, such as the Tetra Pak A3 Flex Filling Machine. The energy use information for entry into the simulator was obtained from P. Perry (Tetra Pak Oceania, New South Wales, Australia; personal communication) and pricing infor-mation was obtained from vendors. The equipment unit ID information for the UHT process of Figure 2 is given in Table 1.
This process was assumed to operate as described in Burton (1988). Focusing only on the heating stage, after the milk is preheated (B-HX102), separated (C-CS124), and homogenized (D-HG127) to produce 3.25% whole milk, it enters a second preheater (B-HX103) at approximately 75°C and leaves at approximately 95°C. The stream then enters a holding tube (B-HT124) for about 1 min and then to the final heating stage (B-HX104), which heats the stream to 137.8°C. The stream was held for 4 s in B-HT121 and then cooled in B-HX106. The percentage regeneration of this process is 91%.
packaged in paper pint containers and stored on site. The CIP operations were assumed similar to those for the FMPM (Figure 1) but additional water was used in cleaning. Wastewater was handled as described for the FMPM.
Crossflow MF Without Pasteurization. Micro-filtered whole milk is sold as an ESL raw milk in France (Saboya and Maubois, 2000; Gésan-Guiziou, 2010). The
cream stream is heated to 95°C for 20 s. To simulate this process, the MF process was installed as part of the FMPM but the HTST section was removed (Figure 3). A regenerative heat exchanger (B-HX102) was followed by a hot water-heated heat exchanger (B-HX104) to heat milk to 55°C before MF (Gésan-Guiziou, 2010). For the purposes of comparison to other cases in this study, we assumed that the cream was heated to 90°C
and held for 15 s and then mixed with the permeate. Crossflow MF was modeled as 2 MF processing mod-ules in series (Figure 3). Each of the modmod-ules consisted of housings containing 1.4-μm membranes. The first module (MF-101) was fed skim milk at 55°C with the retentate fed to a second module (MF-102). The per-meate flux was set to 550 L/m2 h, a flow parameter
commonly used in milk MF. The volume concentration ratio (VCR) is defined as follows:
VCR = VF/VR = (FP + FR)/FR,
where VF is the volume of feed, VR is the volume of
retentate, FP is the flow rate of the permeate, and FR
Continued
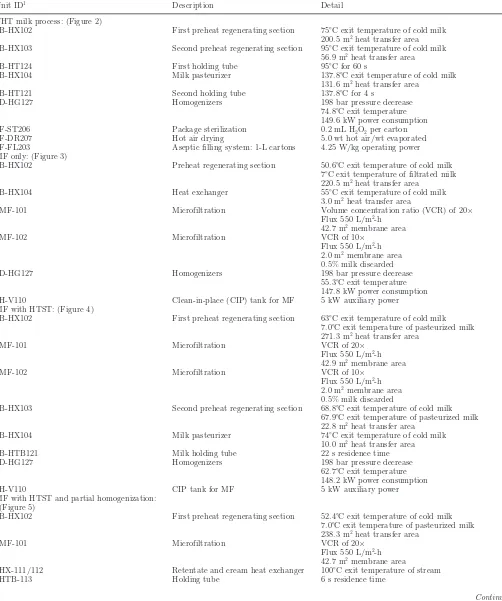
Table 1. Overview of unit operations shown in Figures 2 through 6 for UHT processing, crossflow microfiltration (MF), and pulsed electric field (PEF) processing of 113,600,000 L/yr of raw milk to produce whole milk and cream
Unit ID1 Description Detail
UHT milk process: (Figure 2)
B-HX102 First preheat regenerating section 75°C exit temperature of cold milk
200.5 m2 heat transfer area
B-HX103 Second preheat regenerating section 95°C exit temperature of cold milk
56.9 m2 heat transfer area
B-HT124 First holding tube 95°C for 60 s
B-HX104 Milk pasteurizer 137.8°C exit temperature of cold milk
131.6 m2 heat transfer area
B-HT121 Second holding tube 137.8°C for 4 s
D-HG127 Homogenizers 198 bar pressure decrease
74.8°C exit temperature 149.6 kW power consumption
F-ST206 Package sterilization 0.2 mL H2O2 per carton
F-DR207 Hot air drying 5.0 wt hot air/wt evaporated
F-FL203 Aseptic filling system: 1-L cartons 4.25 W/kg operating power
MF only: (Figure 3)
B-HX102 Preheat regenerating section 50.6°C exit temperature of cold milk
7°C exit temperature of filtrated milk 220.5 m2 heat transfer area
B-HX104 Heat exchanger 55°C exit temperature of cold milk
3.0 m2 heat transfer area
MF-101 Microfiltration Volume concentration ratio (VCR) of 20×
Flux 550 L/m2-h 42.7 m2 membrane area
MF-102 Microfiltration VCR of 10×
Flux 550 L/m2-h 2.0 m2 membrane area 0.5% milk discarded
D-HG127 Homogenizers 198 bar pressure decrease
55.3°C exit temperature 147.8 kW power consumption
H-V110 Clean-in-place (CIP) tank for MF 5 kW auxiliary power
MF with HTST: (Figure 4)
B-HX102 First preheat regenerating section 63°C exit temperature of cold milk
7.0°C exit temperature of pasteurized milk 271.3 m2 heat transfer area
MF-101 Microfiltration VCR of 20×
Flux 550 L/m2-h 42.9 m2 membrane area
MF-102 Microfiltration VCR of 10×
Flux 550 L/m2-h 2.0 m2 membrane area 0.5% milk discarded
B-HX103 Second preheat regenerating section 68.8°C exit temperature of cold milk
67.9°C exit temperature of pasteurized milk 22.8 m2 heat transfer area
B-HX104 Milk pasteurizer 74°C exit temperature of cold milk
10.0 m2 heat transfer area
B-HTB121 Milk holding tube 22 s residence time
D-HG127 Homogenizers 198 bar pressure decrease
62.7°C exit temperature 148.2 kW power consumption
H-V110 CIP tank for MF 5 kW auxiliary power
MF with HTST and partial homogenization: (Figure 5)
B-HX102 First preheat regenerating section 52.4°C exit temperature of cold milk
7.0°C exit temperature of pasteurized milk 238.3 m2 heat transfer area
MF-101 Microfiltration VCR of 20×
Flux 550 L/m2-h 42.7 m2 membrane area
HX-111/112 Retentate and cream heat exchanger 100°C exit temperature of stream
is the flow rate of the retentate. The VCR for the first module was assumed to have a value of 20, representing a 20× concentration of milk; the VCR for the second module was 10, for an overall VCR for the MF process of 200. The retentate, which is about 0.5% of the total feed stream, was assumed processed as a waste stream, because the stream was 200× concentrated in bacteria.
Although the ESL raw milk is filled aseptically and then refrigerated at <6°C, it was assumed here that the milk was filled, packaged, and stored similarly to the FMPM. An additional CIP tank (H-V110) was in-stalled for cleaning the MF modules (Table 1).
Crossflow MF Followed by HTST Pasteuriza-tion. In recent years, many processing plants have been exceeding the minimum pasteurization conditions of 72°C for 15 s (FDA, 2011) in an effort to extend milk shelf life. Processors observed (Ranieri et al., 2009), however, that the increased pasteurization tempera-tures resulted in an increase in bacterial growth and a shortened milk shelf life. Milk pasteurized at the higher temperatures seemed to promote the growth of
Pae-nibacillus spp., a psychrotolerant endospore-forming bacteria that is present in very low levels in raw milk to levels exceeding the Pasteurized Milk Ordinance (2011 revision) limit of 20,000 cfu/mL (FDA, 2011). Ranieri et al. (2009) recommended the use of MF (Elwell and Barbano, 2006; Hoffman et al., 2006; Tomasula et al., 2011) for removal of bacteria and spores from raw milk.
The flow sheet for the MF process followed by HTST pasteurization (MF/HTST) is shown in Figure 4 and
is based on the FMPM. Milk was heated to 63°C in the first preheat regenerating section (B-HX102) but cooled to 55°C following separation and before feed-ing to the MF section. The other significant operatfeed-ing conditions are given in Table 1. Two MF modules in series were used as described for the raw milk crossflow MF process without pasteurization. Permeates from both MF modules were combined with the cream and homogenized. This whole milk stream was then pas-teurized at 74°C, a lower temperature than that of 77°C used in the FMPM, but was held for 22 s, similar to the FMPM. Regeneration efficiency was 93%.
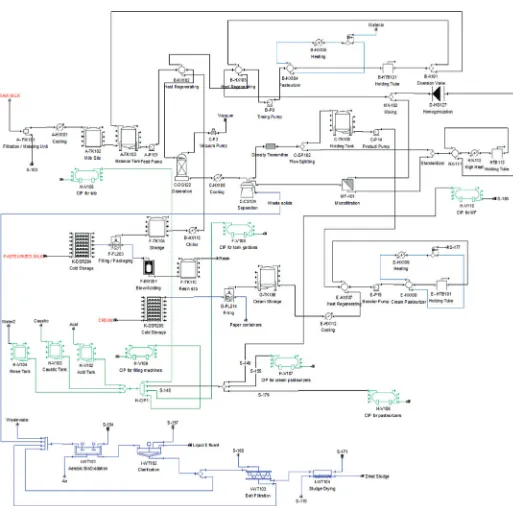
Crossflow MF with Partial Homogenization and Pasteurization. A process concept for produc-tion of ESL milk, defined by the manufacturer (GEA Inc., 2013) as milk with a shelf life of at least 21 d when stored at 8°C, combines HTST pasteurization with MF and uses partial homogenization to blend the reten-tate stream with a portion of the cream stream before adding it to the permeate. The process flow sheet is shown in Figure 5, with additional data given in Table 1. Compared with the previous MF concepts of Figures 3 and 4, which used 2 MF units in series, a single MF module with VCR of 20 was used. The retentate stream was approximately 5% of the feed milk flow rate and was 20× concentrated in bacteria and used in the final product. After the retentate and cream streams were blended, they were treated at 100°C and held for 6 s before adding them to the permeate stream. The whole milk stream was then sent to the second preheating
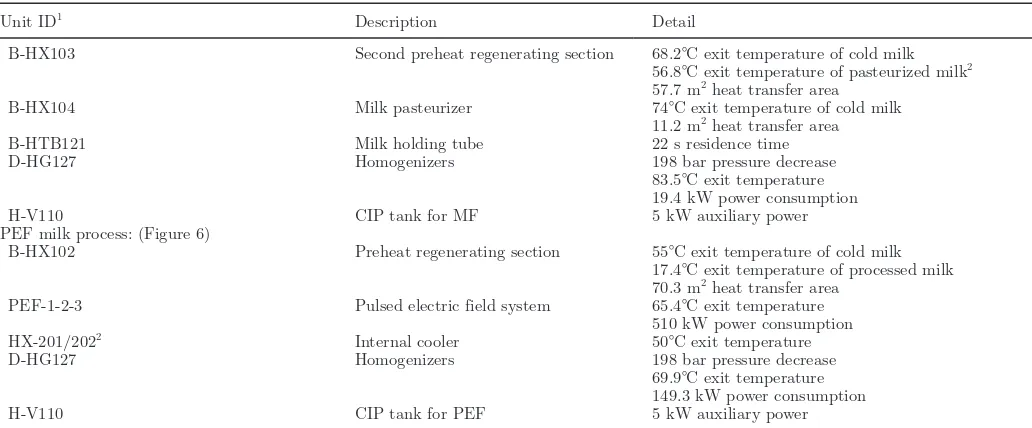
Table 1 (Continued). Overview of unit operations shown in Figures 2 through 6 for UHT processing, crossflow microfiltration (MF), and pulsed electric field (PEF) processing of 113,600,000 L/yr of raw milk to produce whole milk and cream
Unit ID1 Description Detail
B-HX103 Second preheat regenerating section 68.2°C exit temperature of cold milk
56.8°C exit temperature of pasteurized milk2 57.7 m2 heat transfer area
B-HX104 Milk pasteurizer 74°C exit temperature of cold milk
11.2 m2 heat transfer area
B-HTB121 Milk holding tube 22 s residence time
D-HG127 Homogenizers 198 bar pressure decrease
83.5°C exit temperature 19.4 kW power consumption
H-V110 CIP tank for MF 5 kW auxiliary power
PEF milk process: (Figure 6)
B-HX102 Preheat regenerating section 55°C exit temperature of cold milk
17.4°C exit temperature of processed milk 70.3 m2 heat transfer area
PEF-1-2-3 Pulsed electric field system 65.4°C exit temperature
510 kW power consumption
HX-201/2022 Internal cooler 50°C exit temperature
D-HG127 Homogenizers 198 bar pressure decrease
69.9°C exit temperature 149.3 kW power consumption
H-V110 CIP tank for PEF 5 kW auxiliary power
1The first letter of the unit ID identifies the location of the unit in the respective figure.
stage of the HTST pasteurizer and pasteurized. Regen-eration efficiency was 92%, with the rest of the process similar to that of the other MF models.
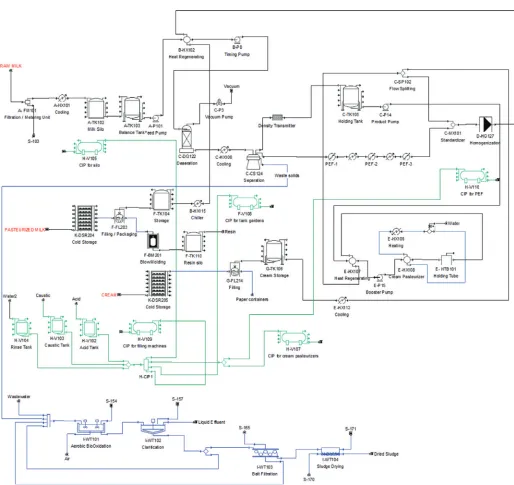
PEF Pasteurization. A process concept for pro-duction of pasteurized whole milk using PEF process-ing has been proposed for pasteurization of orange juice and is adapted here for pasteurization of milk (Sampe-dro et al., 2013), with modifications for a continuous
fluid milk process. Two modes of action for elimina-tion of bacteria in a fluid by PEF processing have been proposed: (1) structural and functional changes in the cell membrane leading to death (Mañas and Pagán, 2005) and (2) electroporation (Sobrino-Lopez and Mar-tin-Belloso, 2010). The process flow sheet for a milk process is shown in Figure 6 and is similar in layout to the plant for crossflow MF of milk without HTST
pasteurization (Figure 3). After preheating in a regen-erator (B-HX102) to 55°C, the milk is separated and skim milk enters the PEF system at 50°C. The system is modeled as 3 PEF units in parallel, with each unit handling up to 10,000 L/h of milk. The icon on the flow sheet represents the 3 units. Each PEF unit consists
of 3 subunits composed of 2 treatment chambers each connected in series (6 processing chambers) in total. The treatment time in each unit may range from 50 to 150 μs for electric field strengths of 30 to 40 kV/cm. A heat exchanger is part of each unit and is after the first and second pairs to remove ohmic heat, which is
about 15°C in each chamber. After leaving the last pair of chambers of the 3 PEF units, the hot milk is routed through the hot side of the heat recovery exchanger, where it is cooled and then passed through a final cool-ing heat exchanger to reduce its temperature to 1.7°C before packaging and cold storage. An additional CIP tank H-V110 is also included.
Extracting Data from a Simulation Trial
The methodologies for running a simulation using SuperPro Designer and for obtaining data from the itemized cost report were described previously (Toma-sula et al., 2013). The simulator calculates the energy used for each of the unit operations. These numbers are
referred to as bare numbers because they do not take into account the energy source, which could be from electricity, cooling water, chilled water, or steam. An Excel spreadsheet (Microsoft Corp., Redmond, WA) was then used to extract the energy data for electricity, cooling water, chilled water, and steam, which was then converted by applying allowances. Allowances are used in cost estimating to cover the costs of known but not fully defined processes. An allowance of up to 25% as described in Peters et al. (2003) was added to the bare
numbers from the unit operations to account for the nonprocess utility requirements and efficiency of the electrical processes as described previously (Tomasula et al., 2013). A 20% allowance was added to the bare numbers for converting the energy from natural gas energy to steam energy.
Greenhouse gas emissions for the unit operations were calculated from the energy data shown in Table 2 using the conversion factors found in Deru and Torcel-lini (2007). The source emission factor for conversion of
Journal of Dairy Science V
ol. 97 No. 7, 2014
OUR INDUSTR
Y
T
ODA
Y
4605
a VCR of 20, or pulsed electric field processing (PEF)
Section
FMPM with HTST at 77°C, MJ (%)
UHT process, MJ (%)
Crossflow MF, no HTST,
(VCR = 200) MJ (%)
Crossflow MF/HTST at 74°C,
(VCR = 200) MJ (%)
Crossflow1 MF/HTST at 74°C
(VCR = 20) MJ (%)
PEF, MJ (%)
Raw milk 248,460 248,460 248,460 248,460 248,460 248,460
(0.8) (0.8) (0.7) (0.7) (0.7) (0.4)
Microfiltration — — 1,675,390 1,680,350 3,752,400 —
(5.0) (4.5) (10.1)
Pulsed electric fields — — — — — 31,455,520
(51.7)
Pasteurization 4,867,250 11,625,220 4,539,070 5,045,740 5,507,860 3,938,040
(16.1) (38.0) (13.7) (13.5) (14.8) (6.5)
Homogenization 2,789,160 2,800,660 2,769,890 2,774,180 363,530 2,795,510
(9.2) (9.2) (8.7) (7.4) (1.0) (4.6)
Standardization 2,026,040 2,026,060 2,023,720 2,026,040 2,023,490 2,025,470
(6.7) (6.6) (6.1) (5.4) (5.4) (3.3)
Milk packaging 7,216,800 2,381,730 7,180,630 7,180,670 7,216,710 7,216,730
(23.9) (7.8) (21.6) (19.3) (19.4) (11.9)
Cream pasteurization 222,660 255,100 394,750 223,630 188,610 390,750
(0.7) (0.8) (1.2) (0.6) (0.5) (0.6)
Cream packaging 199,410 198,900 203,920 203,890 199,510 199,490
(0.7) (0.7) (0.6) (0.5) (0.5) (0.3)
Cold storage 1,825,050 - 1,825,050 1,825,050 1,825,050 1,825,050
(6.0) (5.5) (4.9) (4.9) (3.0)
Cleaning-in-place 8,872,130 8,940,900 10,275,960 13,573,420 13,345,690 8,872,130
(29.4) (29.2) (31.0) (36.4) (35.9) (14.6)
Wastewater treatment 1,910,960 2,112,760 2,056,810 2,493,580 2,463,890 1,910,960
(6.3) (6.9) (6.2) (6.7) (6.6) (3.1)
Total energy 30,178,030 30,589,790 33,193,650 37,275,010 37,135,200 60,878,110
SEC, MJ/kg of RMP2 0.267 0.270 0.293 0.329 0.328 0.538
SEC electrical, MJ/kg of RMP 0.14 0.10 0.16 0.16 0.13 0.44
SEC natural gas, MJ/kg of RMP 0.13 0.17 0.14 0.17 0.19 0.10
1Partial homogenization.
2
electrical energy to CO2e was 0.758 kg of CO2e/kWh.
The source emission factor that was used for conversion of natural gas energy to CO2e was 0.06312 kg of CO2e
/MJ of natural gas.
The simulator provides cost data based on the eco-nomic conditions in 2013. The user may also enter their own data or data from vendors. Sanitary construction was assumed for all equipment costs. Further details are provided in Tomasula et al. (2013).
RESULTS AND DISCUSSION
Energy Use of Simulated Plants
Reduction of energy use throughout a plant or switch-ing to lower global warmswitch-ing potential energy sources reduces GHG emissions. Dairy plants have already implemented best practices, which have reduced energy use by 5 to 30% (Doty and Turner, 2009; Tomasula and Nutter, 2011). However, few plants have examined reduction of energy use through implementation of alternative technologies that may reduce a particular type of energy use, either thermal or electrical, and the associated GHG emissions. These technologies may also lower water use and wastes generated throughout the dairy supply chain.
Simulation trials were conducted for the FMPM, UHT process, the various MF process configurations presented earlier, and the PEF process to demonstrate the use of the models in calculating the energy use of the different pasteurization scenarios, the effect on GHG emissions in the form of CO2e emissions, and the
estimated cost of implementing the alternative process compared with the base FMPM. The energy use and percentage contribution to the total energy use of each of the unit operations in the processes, extending from milk reception and storage in silos to cold storage of the packaged product, are shown in Table 2. Specific energy consumption, which is useful for comparing the efficiencies across different fluid milk processing plants (Xu and Flapper, 2009), is also reported. The FMPM was verified by comparison to actual plant data and data from the literature (Tomasula et al., 2013).
For the base FMPM, energy use decreased in the order CIP (29.4%) > milk packaging (23.9%) > pas-teurization (16.1%), homogenization (9.2%), standard-ization (6.7%) > cold storage (6.0%) > wastewater treatment (6.3%), with an SEC of 0.267 MJ/kg of raw milk processed (RMP). The energy use was mainly due to the thermal energy (natural gas) used for CIP and pasteurization operations and the electrical energy used mainly for milk packaging and homogenization. Non-process electricity and thermal energy used throughout
the plant were accounted for by the nonprocess factors discussed previously.
Table 2 shows a comparison of the energy used in each unit operation of the FMPM to that of the alternative processes. To simplify the comparisons in energy use among the plants, an attempt was made to keep most of the unit operations from plant to plant the same to emphasize the effect of the alternative methodology on total energy use and SEC. For example, each plant was assumed to have the same energy use associated with the raw milk section, which includes milk reception and storage in silos. The standardization and homogeniza-tion processes were also assumed to be the same for each of the alternative processes, except for the MF process with a VCR of 20 for which partial homogeni-zation was assumed. Milk packaging was assumed the same for each process with the exception of the UHT process that assumed use of aseptic packaging. Cream packaging was also the same for each process.
The total SEC of the base FMPM (Figure 1) was 0.267 MJ/kg of RMP with SEC from electrical use of 0.14 MJ/kg of RMP and that from natural gas use of 0.13 MJ/kg of RMP (Table 2). In comparison, SEC of the simulated UHT process (Figure 2) was within 1% of SEC for the FMPM but SEC due to natural gas use increased to 0.17 MJ/kg because of the higher tempera-ture used to sterilize the milk. The aseptic packaging consumed only 7.8% of total energy, whereas in the FMPM, packaging consumed 23.9% of the total plant energy due to the use of electrical energy used to blow-mold the packaging. Ultrahigh temperature milk does not require refrigeration, which is also another factor reducing SEC relative to the FMPM. The SEC due to electrical use was 0.10 MJ/kg of RMP.
kg of RMP. The original process discussed by Gésan-Guiziou (2010) packaged milk aseptically, not in the high-density polyethylene gallon jugs assumed for this process. Aseptic packaging would lower SEC due to electricity but cold storage would still be required. The total SEC was 0.293 MJ/kg of RMP compared with the value of 0.267 MJ/kg of RMP for FMPM.
The energy use for crossflow MF/HTST with a VCR of 200 (Figure 4) is also presented in Table 2. The total SEC was 0.329 MJ/kg of RMP. The SEC for electrical use was 0.16 MJ/kg of RMP, similar to that of the ESL raw milk process. The SEC from natural gas use was 0.17 MJ/kg of RMP compared with the value of 0.13 for FMPM because of the increased energy demands of the CIP operation. Also, the standardized permeate stream from MF entered the second preheat regenera-tion secregenera-tion at a lower temperature than that for the FMPM, resulting in a lower percentage regeneration of 93% compared with 94% for the FMPM.
The process proposed by GEA Inc. (2013; Figure 5) used a single MF (VCR = 20) unit with HTST pasteur-ization at 74°C and partial homogenpasteur-ization to blend the retentate and cream streams, which were then treated at 100°C for 6 s before being added back to the per-meate. The reported energy for MF of 3,752,400 MJ includes 1,598,020 MJ of energy from electricity and 2,154,380 MJ from natural gas used to generate steam for the retentate-cream pasteurization. The remaining cream was pasteurized separately. Because of the use of partial homogenization, SEC for electricity was 0.13 MJ/kg of RMP, less than that of the FMPM (0.14) and the MF/HTST (VCR = 200) process (0.16). However, SEC for natural gas use increased to 0.19 MJ/kg of RMP, reflecting the increased use of natural gas during MF to heat the retentate and the cream stream. The total SEC was 0.328 MJ/kg of RMP similar to that of the MF/HTST (VCR = 200) process.
The energy use for the PEF process (Figure 6) is also reported in Table 2. The PEF process flow sheet is similar to that of the MF process without HTST pasteurization (Figure 3). The total energy use for PEF alone was 31,455,520 MJ, which accounts for 51.7% of the total energy use of the process; SEC was 0.538 MJ/ kg of RMP. The SEC from natural gas use of 0.10 MJ/ kg of RMP was lowest for this process, with the de-crease attributed to more efficient energy recovery due to the higher exit temperature from PEF entering the regenerator compared with that of the MF process of Figure 3. Toepfl et al. (2006) indicated that for cases such as this, in which the PEF is used for microbial decontamination, the input of electrical energy might be minimized to that of thermal pasteurization, which would be equivalent to approximately 4,867,250 MJ or 42.8 MJ/kg of RMP using the value from the FMPM,
and then use synergetic heat effects, assuming 95% of heat recovery.
GHG Emissions of Simulated Plants
The energy data reported in Table 2 were used to calculate GHG emissions (kg of CO2e) for each unit
operation of the base FMPM plant and for the alterna-tive processes as shown in Table 3. Emissions in terms of grams of CO2e per kilogram of RMP (i.e., the
car-bon footprint of the process) are reported as well as the GHG emissions from use of electrical and natural gas energy. The GHG emissions ranged from a low of 31.4 g of CO2e/kg of RMP for the UHT process to
99 g of CO2e/kg of RMP for the PEF process. For all
processes, GHG emissions arising from natural gas use were low compared with those arising from electrical use. Most cold storage facilities in dairy plants and distribution centers are ammonia-based (Brush et al., 2011) so GHG emissions from leakage of refrigerant are not considered here.
Waste water from fluid milk plants may be treated by the local municipality or in an onsite waste water facility. We assumed an aerobic onsite facility in the simulation, as described previously (Tomasula et al., 2013), in which biomass, CO2, and water were produced
by breakdown of the milk components by bacteria. The generated CO2 was not added to the GHG emissions of
Table 3. According to the IPCC (2006), CO2 generated
from an aerobic process is biogenic because it results from the decomposition of biological material and is not derived from fossil fuels. If the amount of CO2
gen-erated by wastewater treatment is taken into account, the following values for CO2e would be added to those
in Table 3 for wastewater treatment: FMPM: 66,264 kg/yr; UHT: 73,329 kg/yr; crossflow MF, no HTST: 71,399 kg/yr; crossflow MF/HTST (VCR = 200): 86, 571 kg/yr; crossflow MF/HTST (VCR = 20): 85,569 kg/yr; and PEF: 66,267 kg/yr.
Capital, Operating, and Unit Production Costs
T
OMASULA
ET
AL.
ol. 97 No. 7, 2014 Table 3. Greenhouse gas emissions (kg of CO2e; % in parentheses) associated with electricity and natural gas use to process 113,600,000 L/yr raw milk using the fluid milk process model (FMPM), UHT processing, crossflow microfiltration (MF) with no pasteurization and a volume concentration ratio (VCR) of 200, MF/HTST with a VCR of 200, MF/HTST with a VCR of 20, or pulsed electric field processing (PEF)
Section
FMPM with HTST at 77°C
UHT process
Crossflow MF, no HTST (VCR = 200)
Crossflow MF/HTST
at 74°C (VCR = 200)
Crossflow1 MF/HTST at 74°C
(VCR = 20) PEF
Raw milk 52,393 52,393 52,393 52,393 52,393 52,393
(1.2) (1.5) (1.1) (1.1) (1.1) (0.5)
Microfiltration — — 353,299 354,346 473,238 —
(7.5) (7.1) (10.3)
Pulsed electric fields — — — — — 6,633,195
(59.0)
Pasteurization 505,557 1,192,145 483,315 515,476 543,192 830,436
(11.8) (33.4) (10.3) (10.4) (11.8) (7.4)
Homogenization 588,166 590,591 583,619 585,007 76,661 589,504
(13.8) (16.6) (12.4) (11.8) (1.7) (5.2)
Standardization 407,464 407,468 406,976 407,464 406,927 407,345
(9.5) (11.4) (8.7) (8.2) (8.9) (3.6)
Milk packaging 1,521,845 477,522 1,514,219 1,514,226 1,521,827 1,521,831
(35.7) (13.4) (32.2) (30.55) (33.2) (13.5)
Cream pasteurization 40,530 47,370 48,133 40,735 33,350 47,290
(0.9) (1.3) (1.0) (0.8) (0.7) (0.4)
Cream packaging 42,050 41,944 43,003 42,996 42,071 42,067
(1.0) (1.2) (0.9) (0.9) (0.9) (0.4)
Cold storage 384,859 — 384,859 384,859 384,859 384,859
(9.0) (8.2) (7.7) (8.4) (3.4)
Cleaning-in-place 573,991 588,494 662,779 873,910 859,501 573,991
(13.4) (16.5) (14.1) (17.6) (18.7) (5.1)
Wastewater treatment 151,205 167,053 162,669 196,917 194,596 151,206
(3.5) (4.7) (3.5) (4.0) (4.2) (1.3)
Total GHG emissions 4,268,060 3,564,979 4,695,264 4,968,328 4,588,614 11,234,118
GHG, g/kg of RMP2 37.6 31.4 41.4 43.8 40.5 99.1
GHG, g/kg of RMP, natural gas 7.9 10.9 8.7 10.9 12.2 6.1
GHG, g/kg of RMP, electricity 29.7 20.6 32.7 32.9 28.2 93.0
1Partial homogenization.
2
al. 2013). Capital costs were lowest for the crossflow MF/HTST process with VCR of 20 but were highest for the UHT process, which had the lowest energy use and GHG emissions, closely followed by the PEF process, which had the highest energy use and GHG emissions.
The annual operating costs for the FMPM and the alternative processing plants are shown in Table 5, which provides information on the costs of the raw materials, utilities, labor, and the waste treatment costs at the plants. Capital depreciation calculated using the straight-line method (Peters et al., 2003) is also listed. As in the previous study (Tomasula et al., 2013), other assumed facility-dependent costs included plant maintenance at 3% of capital costs; insurance at 0.8% of capital costs, and factory expenses at 0.75% of capital costs. Unit production costs are the differ-ence between the operating costs and the co-products
credit for cream divided by the number of filled enti-ties. Note that the number of filled entities in Table 5 for UHT milk is reported in units of liters because UHT milk is usually packaged in 1-L bricks, not in gallon containers. The raw material costs are the larg-est contributor to the total production costs, with the price of milk contributing 90% of the total production costs. Unit production costs for the FMPM and the MF/HTST process with VCR of 20 were found to be the same at $0.507/L. However, the unit production costs of the UHT process were $0.093/L ($0.35/gal) greater than those of the FMPM; those of the PEF process were $0.016/L ($0.06/gal) greater than those of the FMPM; and those of the MF/HTST process with a VCR of 200 were $0.003/L ($0.01/gal) greater than those of the FMPM, which was within the range reported by Skrzypek and Burger (2010) in a
compari-Table 4. Capital costs ($ × 1,000) by section for the equipment used to process 113,600,000 L/yr milk in the fluid milk process model (FMPM), UHT processing, crossflow microfiltration (MF) with no pasteurization and with a volume concentration ratio (VCR) of 200, MF/HTST with a VCR of 200, MF/HTST with a VCR of 20, and pulsed electric field processing (PEF)
Section
FMPM with HTST at 77°C
UHT process
Crossflow MF, no HTST
(VCR = 200)
Crossflow MF/HTST
at 74°C (VCR = 200)
Crossflow1 MF/HTST
at 74°C
(VCR = 20) PEF
Raw milk 1,272 1,272 1,272 1,272 1,272 1,272
Microfiltration — — 676 678 598 —
Pulsed electric field — — — — — 7,653
Pasteurization 396 4,929 236 394 396 109
Homogenization 1,314 1,318 1,305 1,309 387 1,314
Standardization 1,814 1,816 1,898 1,814 1,814 1,898
Milk packaging 7,373 10,952 7,364 7,364 7,373 7,373
Cream pasteurization 53 53 54 53 53 54
Cream packaging 1,777 1,773 1,554 1,554 1,541 1,541
Cold storage 543 543 543 543 543 543
Cleaning-in-place 1,971 1,971 1,971 1,971 1,971 1,971
Wastewater treatment 1,985 1,992 1,989 2,002 2,000 1,985
Building and auxiliary costs 10,000 10,000 10,000 10,000 10,000 10,000
Plant costs 28,496 36,617 28,861 28,953 27,946 35,712
1
Partial homogenization.
Table 5. Summary of capital, operating, and production costs ($ × 1,000) used to process 113,600,000 L/yr whole milk using the fluid milk process model (FMPM), UHT processing, crossflow microfiltration (MF) with no pasteurization and with a volume concentration ratio (VCR) of 200, MF/HTST with a VCR of 200, MF/HTST with a VCR of 20, and pulsed electric field processing (PEF)
Item FMPM, HTST UHT process Crossflow MF, no HTST (VCR = 200)
Crossflow MF/HTST (VCR = 200)
Crossflow MF/HTST (VCR = 20)
PEF process
Filled entities1 29,161,110 110,392,088 29,014,987 29,015,116 29,160,772 29,160,827
Capital costs 28,496 36,617 28,861 28,953 27,946 35,712
Operating costs 60,347 70,565 60,463 60,602 60,435 62,091
Utilities 429 470 457 478 446 1,123
Waste treatment 12 13 13 16 16 12
Raw materials 46,775 55,768 46,808 46,909 46,921 46,775
Labor 8,986 8,986 8,986 8,986 8,986 8,986
Other facility costs 1,297 1,666 1,313 1,317 1,272 1,625
Capital depreciation 2,850 3,662 2,886 2,895 2,795 3,571
Co-products credit 4,387 4,376 4,487 4,486 4,389 4,389
Unit production costs, $/MP entity1 1.92 0.60 1.93 1.93 1.92 1.98
1
son of a similar commercial milk MF/HTST process with an FMPM.
Water Use
The FMPM and other models presented in this study predict the amount of water used in each unit operation. However, detailed information on plant or process water use is not available in the literature or from processors for the FMPM or UHT process. The earlier study (Tomasula et al., 2013) reported that in-formation on water use for entire fluid milk processing plants was available and ranged from 1.02 L of water/L of milk processed to 3 L of water/L of milk processed. For the FMPM, it was reported that 0.3 L of water was used for CIP and case washing per L of milk processed. Similar results were obtained in this study for the various processes and are reported in parentheses (L of water/L of milk processed): FMPM (0.245), UHT pro-cess (0.273), crossflow MF, no HTST (0.271), crossflow MF/HTST,VCR of 200 (0.333), crossflow MF/HTST, VCR of 20 (0.329), and PEF process (0.245).
Integrated Simulation Models
Decreases in energy use, GHG emissions, and water use for the fluid milk process will be achieved through evaluations of the impact of farm and off-farm pro-cesses involved in the production of a gallon or liter of milk (Tomasula and Nutter, 2011). This may be done most efficiently through the use of software tools for farm management simulation, such as that described in Rotz et al. (2012), and process simulation, such as that described in Tomasula et al. (2013). Software tools will also allow integration of the farm with the processing plant to improve the sustainability of the fluid milk supply by shared decreases in energy, water use, and GHG emissions, which is of concern in the context of food security and food nutrition. Integration of indica-tors such as the Nutrient Density to Climate Impact Index (Smedman et al. 2010), which relates the nutri-ent profile of a food to GHG emissions, and information on the bioavailability of foods would also become part of simulation schemes to monitor the linkage between farm or off-farm processes and nutrition. Computer simulation will help lay the foundation for designing dairy plants of the future by integrating new technolo-gies into the existing dairy supply chain to lower energy use, reduce or eliminate water use, eliminate waste, and ensure food security.
CONCLUSIONS
The simulations demonstrate that FMPM is the most energy efficient process with both the lowest
SEC and lowest unit production costs of all processes examined. However, for the MF/HTST processes, the shelf life of milk is longer relative to the FMPM. The increase in shelf life of the MF/HTST processes may offset the increase in GHG emissions relative to the FMPM. Although UHT milk had the highest unit pro-duction costs, it had the advantage of the lowest GHG emissions. The PEF process is still under development and costs will likely decrease with further advances in the technology. This process also offers the potential of an extended shelf life relative to the FMPM. These new models, along with the original version of the fluid milk process simulator (Tomasula et al., 2013) and a user manual, are available for download (http://ars. usda.gov/naa/errc/fluidmilkprocessmodels). The free evaluation version of SuperProDesigner can be down-loaded from www.intelligen.com to view and examine the models.
REFERENCES
ASHRAE (American Society of Heating, Refrigerating and Air-Con-ditioning Engineers). 2007. ASHRAE 2007 Handbook: Heating, ventilating, and air-conditioning applications. 1-P ed. Knovel, New York, NY.
Brush, A., E. Masanet, and E. Worrell. 2011. Energy efficiency im-provement and cost saving opportunities for the dairy processing
industry. An ENERGY STAR® guide for energy and plant
manag-ers. Lawrence Berkeley National Laboratory, Berkeley, CA. Ac-cessed Jan. 21, 2014. http://eetd.lbl.gov/sites/all/files/lbnl-5303e. pdf.
Burton, J. 1988. Ultra-High Temperature Processing of Milk and Milk Products. Elsevier Applied Science, London, UK.
Datta, N., A. J. Elliott, M. L. Perkins, and H. C. Deeth. 2002. Ultra-high-temperature (UHT) treatment of milk: Comparison of direct and indirect modes of heating. Aust. J. Dairy Technol. 57:211– 227.
Deru, M. and P. Torcellini. 2007. Source energy and emission fac-tors for energy use in buildings. Technical Report, NREL/TP-550–38617. Revised June 2007. National Renewable Energy Labo-ratory (NREL), Golden, CO.
Doty, S., and W. C. Turner. 2009. Energy Management Handbook. 7th ed. The Fairmount Press, Lilburn, GA.
Elwell, M. W., and D. M. Barbano. 2006. Use of microfiltration to improve fluid milk quality. J. Dairy Sci. 89(E. Suppl.):E10–E30. FDA (US Food and Drug Administration). 2011. Grade “A”,
Pasteur-ized Milk Ordinance, 2007 revision. US Department of Health and Human Services Public Health Service. Accessed Sep. 12, 2013. http://www.fda.gov/downloads/Food/FoodSafety/Product- SpecificInformation/MilkSafety/NationalConferenceonInterstate MilkShipmentsNCIMSModelDocuments/UCM291757.pdf. GEA Inc. 2013. Process concepts for the production of ESL milk. GEA
TDS GmbH, Sarstedt, Germany. Accessed Sep. 15, 2013. http:// www.gea-tds.com/tds/cmsresources.nsf/filenames/451eTDS_ESL. pdf/$file/451eTDS_ESL.pdf.
Gésan-Guiziou, G. 2010. Removal of bacteria, spores and somatic cells from milk by centrifugation and microfiltration techniques. Pages 349–372 in Improving the Safety and Quality of Milk: Milk Pro-duction and Processing. M. W. Griffiths, ed. Woodhead Publish-ing, Cambridge, MA.
Goff, H. D., and M. W. Griffiths. 2006. Major advances in fresh milk and milk products: Fluid milk products and frozen desserts. J. Dairy Sci. 89:1163–1173.
2006. Processing of extended shelf-life milk using microfiltration. Int. J. Dairy Technol. 59:229–235.
IPCC (Intergovernmental Panel on Climate Change). 2006. Waste. Chapter 6 in Guidelines for National Greenhouse Gas Inventories. Vol. 5. M. R. J. Doorn, S. Towprayoon, S. M. M. Vieira, W. Irving, C. Palmer, R. Pipatti, and C. Wang, ed. Accessed Jan. 10, 2014. http://www.ipcc-nggip.iges.or.jp/public/2006gl/pdf/5_Volume5/ V5_6_Ch6_Wastewater.pdf.
Mañas, P., and R. Pagán. 2005. Microbial inactivation by new tech-nologies for food preservation. J. Appl. Microbiol. 98:1387–1399. NRCan (Natural Resources Canada). 2001. Energy Performance Indi-cator Report: Fluid Milk Plants. NRCan, Ottawa, ON, Canada. Peters, M. S., K. D. Timmerhaus, and R. E. West. 2003. Plant Design
and Economics for Chemical Engineers. 5th ed. McGraw-Hill, New York, NY.
Ranieri, M. L., J. R. Huck, M. Sonnen, D. M. Barbano, and K. J. Boor. 2009. High temperature, short time pasteurization tempera-tures inversely affect bacterial numbers during refrigerated storage of pasteurized fluid milk. J. Dairy Sci. 92:4823–4832.
Rotz, C. A., M. S. Corson, D. S. Chianese, F. Montes, S. D. Hafner, and U. Coiner. 2012. The Integrated Farm System Model. Refer-ence Manual. Version 3.6. USDA Agricultural Research Service, University Park, PA. Accessed Sep. 1, 2013. http://www.ars.usda. gov/SP2UserFiles/Place/19020000/ifsmreference.pdf.
Rysstad, G., and J. Kolstad. 2006. Extended shelf life milk—Advances in technology. Int. J. Dairy Technol. 59:85–96.
Saboya, L. V., and J.-L. Maubois. 2000. Current developments of mi-crofiltration technology in the dairy industry. Lait 80:541–553. Sampedro, F., A. McAloon, W. Yee, X. Fan, H. Q. Zhang, and D. J.
Geveke. 2013. Cost analysis of commercial pasteurization of orange juice by pulsed electric fields. Innov. Food Sci. Emerg. Technol. 17:72–78.
Skrzypek, M., and M. Burger. 2010. ISOFLUX ceramic membranes— Practical experiences in dairy industry. Desalination 250:1095– 1100.
Smedman, A., H. Lindmark-Mansson, A. Drewnowski, and A.-K. Mo-din Edman. 2010. Nutrient density of beverages in relation to cli-mate impact. Food Nutr. Res. 54:5170–5178.
Sobrino-Lopez, A., and O. Martin-Belloso. 2010. Review: Potential of high-intensity pulsed electric field technology for milk processing. Food Eng. Rev. 2:17–27.
Thoma, G., J. Popp, D. Nutter, D. Shonnard, R. Ulrich, M. Matlock, D. S. Kim, Z. Neidermann, N. Kemper, C. East, and F. Adom. 2013. Greenhouse gas emissions from milk production and con-sumption in the United States: A cradle-to-grave life cycle assess-ment circa 2008. Int. Dairy J. 31:S3–S14.
Toepfl, S., A. Mathys, V. Heinz, and D. Knorr. 2006. Review: Pottial of high hydrostatic pressure and pulsed electric fields for en-ergy efficient and environmentally friendly food processing. Food Rev. Int. 22:405–423.
Tomasula, P. M., S. Mukhopadhyay, N. Datta, A. C. S. Porto-Fett, J. E. Call, J. B. Luchansky, J. Renye, and M. H. Tunick. 2011. Pilot-scale crossflow-microfiltration and pasteurization to remove spores
of Bacillus anthracis (Sterne) from milk. J. Dairy Sci. 94:4277–
4291. http://dx.doi.org/10.3168/jds.2010-3879.
Tomasula, P. M., and D. W. Nutter. 2011. Mitigation of greenhouse gas emissions in the production of fluid milk. Adv. Food Nutr. Res. 62:41–88.
Tomasula, P. M., W. C. F. Yee, A. J. McAloon, D. W. Nutter, and L. M. Bonnaillie. 2013. Computer simulation of energy use, green-house gas emissions, and process economics of the fluid milk pro-cess. J. Dairy Sci. 96:3350–3368.