Journal of
November, 1963RANGE
MANAGEMENT
A Method for the Characterisation
of Range-Type Vegetation
I. A. NICI-IQLSON AND ROY HUGHES
Head of Agronomy Department, Hill Farming Research Organization, Edinburgh, Scotland and Agronomist, Welsh Plant Breeding Station, Aberystwyth, Wales, respectively. Mr. Hughes was formerly also with the H.F.R.O., Edinburgh.
In the last 30 years spectacular advances have been made in the production and use of pasture. In particular, these develop- ments have taken place on the better soils and in temperate cli- matic regions. In many parts of the world today, however, in- creasing attention is now being focussed on the more extensively used permanent grazings which are inherently unsuited to in- tensive husbandry techniques. Davies (1960) has recently dis- cussed these grasslands and classified them on a global basis into five categories according to their productivity. The two low- est categories, accounting for 68 percent of the total permanent grassland area of the world, he describes as “extensive” and “very extensive” carrying ten “cattle units” and one to five such units per 100 acres, respec-’ tively. The cattle ranches of the western hemisphere, Africa and Australia, together with the up- land grazings of Western Europe, come into the “extensive” pas- toral group, while the “very ex- tensive” group includes those of Patagonia, Northern Australia and many types in Africa. Fun- damentally, the problems of these grazings are ecological and generally the management tech-
niques evolved in regions of more intensive production can- not be applied to them. Simi- larly, many of the well estab- lished techniques in pasture re- search are not appropriate for studies under extensive manage- ment regimes and special meth- ods are often needed.
In Great Britian, there are ap- proximately 14 million acres of upland “rough grazings” of low productivity used for livestock production and this area com- prises 29 percent of the available agricultural land. The vegetation of this range land, within a fenced or unfenced grazing unit of 300-1,000 or more acres, may exhibit a high degree of botani- cal uniformity being composed essentially of a single vegetation type, e.g. a community domi- nated by purple moor-grass (Mo- Zinia caerulea (L.) Moench) , mat-grass (Nardus stricta
L.) ,
Bent/fescue species (AgrostisL./Festuca L.) or heather (Cal- Zuna vulgaris (L.) Hull). Much more commonly, however, the vegetation is distributed as a mosaic of several different types or shows well defined altitudinal zonation. As the stocking rate is generally low, e.g. three to eight acres per sheep or 20 or more acres per cattle beast, large plots
293
are usually required in grazing studies. Where the vegetation within the plot enclosure is mixed, with pronounced spatial heterogeneity, it becomes diffi- cult to characterise the area and follow vegetation changes with- out adopting laborious and time- consuming methods. The tech- nique described in this paper was developed for use under such conditions.
Requirements of the Technique and ifs Use
The need for a suitable survey method arose with the establish- ment of a grazing experiment in
1950. This involved a simple comparison of two contiguous plots, each of approximately 40 acres, on deeply dissected ter- rain bearing a distinct vegeta- tional mosaic. Callunetum2 was the largest single community, but though heather was strongly dominant throughout its range, there were important changes in associated species with altitude.
An aerial photograph of the --
1The authors wish to acknowledge the advice given on the statistical analysis by Dr. M. R. Sampjord of the Agricultural Research Council Unit of Statistics, Aberdeen and also for the assistance of Miss P. F. Ritches of the Hill Farming Re- search Organization. The authors are also indebted to the British Air Ministry for permission to publish the aerial photograph in Figure 1. 2The suffix -etum added to the gen-
eric name of the dominant species is the technical name of the conso- ciation i.e. the community formed where a single species dominates a portion of an association. For ex- ample, CaZZunetum and Pteridietum
being heather dominant and
Yas .
SCALE
32
31
30
29
28
27
26
25
24
23
22
21 20
19
18
17
16
15
14
13
12
11
10
9
8
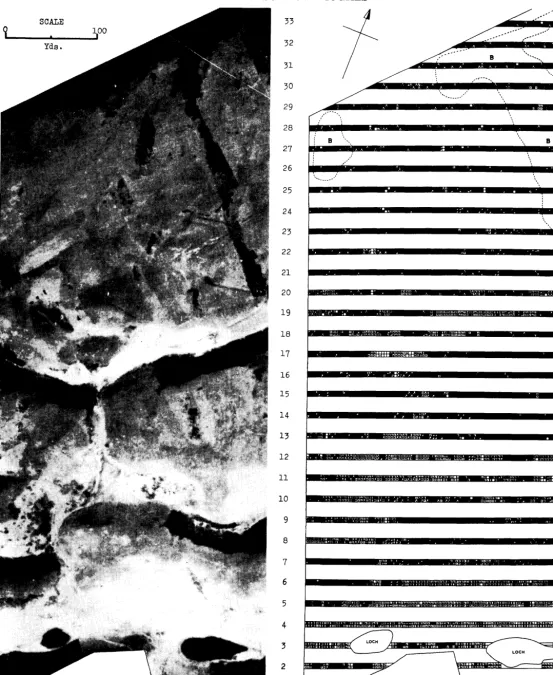
FIGURE 1. Aerial photograph (Royal Air Force Photograph, British Crown Copyright reserved) of experimental plot and vegetation “point” map of same area constructed with two-pronged sampling technique. It should be noted that the aerial photograph is
area (Figure 1) gave useful in-
formation, but further data were
needed for its detailed interpre-
tation. The following require-
ments were considered necessary
in the design of a suitable tech-
nique.
1. Speed of operation in mak-
ing periodic measurements on
each plot or part of it.
2. Representation
of the
spatial distribution and extent of
the main communities and their
variants.
3. A sufficient measure of the
specific composition
of com-
munities to enable variation to
be detected where this was not
expressed in the character of the
dominant.
The requirements therefore
combined the essential features
of mapping with those of more
detailed vegetational analysis.
Methods of surveying
and
measuring vegetation have been
reviewed
by Brown. (1954).
Briefly, it can be said that con-
ventional techniques were not
readily applicable to the experi-
mental area or suitable for the
experimental
requirements
either because of their laborious
nature or, as in the case of recon-
naissance methods, b e c au s e of
their limitation in terms of ac-
curacy and detail.
Outline of the Method
The method finally developed
was based on point sampling us-
ing a two pronged fork3.
Since the boundaries of com-
munities were required, there
was little alternative
to sysi
tematic sampling if stations were
to be restricted to a manageable
number. The sampling stations
were therefore sited at regular
intervals along a series of equi-
distant transects. The plot taken
3The authors are indebted to Mr. P. J. Faulks, Senior Lecturer in Bot- any, University of Aberdeen, who advocated the use of a two-pronged fork for vegetational analysis and
who made many valuable com-
ments in the early stages of the work.
as an example
in this paper
measured 300 by 750 yards and
transects were laid out at right
angles to the long axis at 22-
yard intervals, measured hori-
zontally irrespective of s lop
e .There were 34 transects, most of
which were 300 yards long, the
sampling interval
along each
transect being three yards. The
area was thus divided
into
squares three by 33 yards with
samples taken at the grid inter-
sections. Sampling
with two
points at each station and re-
cording only the first species hit
by the descending needles (with
a distance of three inches be-
tween prongs) gave the mini-
mum number of points necessary
to provide some information on
species relationships
over the
mosaic. This procedure enabled
the data to be used for mathe-
matical characterisation of the
vegetation and also for the con-
struction of a “point” map to
show its distribution (Figure 1).
In the field, transects laid out
with a theodolite were perma-
nently marked at various points
according to the terrain.
The
three-yard sampling interval
was estimated by pacing after
previous practice under various
slope and other conditions. Al-
though the transects were ac-
curately positioned, the vertical
axes of the grid were thus only
estimated. As the errors in pac-
ing were different for each tran-
sect, the vertical axes therefore
departed from straight lines ac-
cording to the magnitude of the
errors on each transverse.
In
practice, as shown later, this did
not constitute a serious limita-
tion of the method.
Consfrucfbn of the Map
The outline of the map (Fig-
ure 1) is drawn to scale and the
transects shown as belts, stations
being represented by 99 pairs of
squares straddling
the center
line. Intervals between stations
are eliminated and the stations
are represented by a sequence
of contiguous squares in which
the appropriate species symbols
are drawn.
Statistical Treatment
In this paper, statistical work
is restricted to an examination
of the associations between each
of three selected species and all
other species. The main purpose
of this is to indicate, by applica-
tion of a chi-square test, how the
data can be used to give con-
siderably more information
about the vegetation than by the
use of frequency alone. (For an
account of a similar approach
using a more critical technique,
see Williams and Lambert {1959
and 1960) .)
In preparing the data for anal-
ysis contingency
tables were
constructed showing the class
frequencies
(number
of sta-
tions) of all relevant paired oc-
currences. Only class frequen-
cies with expected values of >5
were examined and the signifi-
cance level was fixed at P< .05.
Examination of the Method Field Work
The most laborious part of the
work lay in marking out the par-
allel transects,
a procedure
which required one theodolite
operator and two assistants. The
time taken per transect varied
with topography and thus the
distance which could be ranged
from the theodolite
without
changing its position. On mod-
erately sloping ground, however,
any incompleted section of line
was easily continued by unaided
visual ranging with surveyor’s
poles. On the easiest terrain the
transects were marked out al-
most as rapidly as the position
of the theodolite
could be
changed. The sampling time for
a 300-yard-long transect varied
from about ten minutes
in
shrubby communities to about
thirty-five minutes where short
close-grazed turf predominated.
Accuracy in Delineating Plant Communifies
tograph (Figure 1) shows a
close similarity in the vegeta-
tional pattern as expressed by
the two methods. The main
zones of heather dominance for
example are clearly shown, to-
gether with the peripheral
Pteri- dietum.It should also be noted
that in the aerial photograph the
top section of the plot is shown
in fairly uniform dark shades
(apart from the patchwork
caused by the burning pattern)
giving no indication of the spe-
cies associated with the domi-
nant. The map shows that a
variety of species are present in
this area and that the main
heather areas lack uniformity
both in the associated species
and in their frequency.
A series of measurements on
the photograph and on the map
have been used to estimate the
error in delineating community
boundaries along each transect.
Differences as low
.as 0.3 per-
cent have been found where the
ground was fairly level, though
in one or two cases on very bro-
ken ground discrepancies as high
as 13 percent have been found4.
To mitigate the tendency for high
errors on undulating terrain it
is an advantage if several ver-
tical lines are laid down at right
angles to the transects to reduce
the cumulative pacing error.
Florisfic Composition and Species Relationships
The species recorded on the
map and the appropriate sym-
bols or index letters used are
shown in the list below.
’As the first species hit by each
needle of the sampling fork is
the only one recorded there is a
tendency for the shorter or pros-
trate species to be underesti-
4It
should be noted that the aerial photograph was not specially taken for the purpose and as the projec- tion is not vertical, some discrep- ancy is inevitable. As it was in- tended to use the same photograph forsuccessive
ground surveys, how- ever, this objection is not unduly serious.mated. The most detailed infor-
mation on the composition of
the community
is therefore
given in short single-layered
types, but even in tall dense veg-
etation such as vigorous Callune-
turn or bracken stands, differ-
ences in community structure
are revealed except where the
upper canopy
is completely
closed. In many types of exten-
sive characterisation, however,
any lack of detail in this respect
may not be regarded as a serious
disadvantage, particularly
as
any further information con-
sidered necessary can
be ac-
quired by more detailed local
studies as and when required.
n
cv
T
E
0
L/I
G
P
R
W
IQ
&I
Z
cx
Ea
Ev
Je
I
XHeather
(Calluna vulgaris(L.) Hull)
Mouse-eared
chickweed
(Cerastium vulgatum L.)
Marsh thistle (Cirsium
pal- ustre(L.) Stop.)
Crowberry
(Empetrum ni- grumL.)
Bell-heather
(Erica cinerea L*)Crossleaved heather
(E.
tetralix L.)
Heath bedstraw
(Gal&m hercynicumWeigel)
Common tormentil
(Poten- tilla erecta(L.) Rausch)
Sheep’s sorrel
(Rumex ace- tosellaL.)
White clover
(Trifolium re- pensL.)
Blaeberry
(Vaccinium myr- tillusL.)
Cowberry
(V. vitis-ideae LJSpeedwells
(VeronicaL.
sPP*)
Sedges (Carex L. spp.)
Common cotton-grass
(Eri- ophorum angustifoliumHonck.)
Draw-moss
(E. vaginatum LJSoft rush (Juncus effusus
L.)
Heath rush (J.
squarrosus L-1L
N
m
un
Ao
AP
l?5%!
E!l
!%I
Hl
H
Lo
Pa
Pt
cl a
cl 8
q
Woodrush
(LuxulaDC.
SPP.)
Bog asphodel
(Narthecium ossifragum(L.) Huds.)
Brown bent-grass
(Agrostiscanina L.)
Common bent-grass
(A. tenuisSibth.)
Sweet vernal-grass
(An- thoxanthum odoratumL.)
Early hair-grass
(Aira prae- coxL.)
Wavy hair-grass
(Des- champsia flexuosa(L.)
Trin.)
Sheep’s
fescue
(Festuca ovinaL.)
Red fescue
(F. rubraL.)
Yorkshire fog (Holcus
Zan- atusL.)
HOZCUS
L. spp.
Perennial rye-grass
(Lo- Zium perenneL.)
Annual meadow-grass
(Poa annuaL.)
Rough-stalked
meadow-
grass
(P. trivialisL.)
Bracken fern
(Pteridium aquilinum(L.) Kuhn)
Misc. mosses
Bare ground
Although the use of a two-
pronged fork imposes some sta-
tistical restrictions, it is of inter-
est to ascertain whether the as-
sociations of species pairs re-
corded in this way can give use-
ful guidance on the classification
of communities with the area
as a whole.
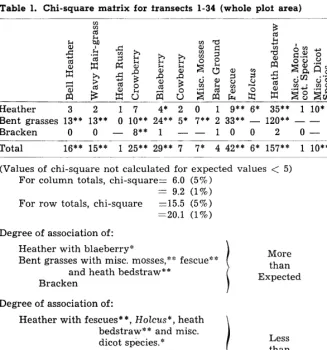
Table 1. Chi-square matrix for fransecfs 1-34 (whole plot area)
Heather 3 2 17 4* 2 0 1 9** 6* 35** 1 lO* 81** Bent grasses 13** 13** 0 lo** 24** 5* 7** 2 33** _ 120** _ _ 227** Bracken 0 0 -8**1 --100 2 0- 12 Total 16** 15”” 1 25** 29”” 7 7” 4 42*” 6” 157”” 1 10”” 320*” (Values of chi-square not calculated for expected values < 5)
For column totals, chi-square= 6.0 (5%) = 9.2 (1%) For row totals, chi-square X15.5 (5%) =20.1 (1%) Degree of association of:
Heather with blaeberry’$
Bent grasses with misc. mosses,** fescue*!‘* and heath bedstraw * *
Bracken
Degree of association of:
Heather with fescues* *, HoZcus*, heath bedstraw** and misc. dicot species. * Bent grasses with bell heather**, wavy
hair-grass**, crowberrvzk” ” and blaeberry” *
Bracken with crowberry * *
ties” occur with a frequency less than the expectation. The bent- grasses are positively associated with the fescues, mosses and heath bedstraw and negatively with bell heather, wavy hair- grass, crowberry and blaeberry. Bracken fern shows a positive association with no other species and is negatively associated with crowberry (one percent level). The main species groupings dem- onstrated by this analysis are thus:
a) heather/blaeberry b) bent/fescue grassland The exclusion of the large number of self: self occurrences from the analysis obscures the existence of large areas of rela- tively pure heather though in the case of bracken areas the ab- sence of significant associations with other plants indicates its presence in relatively pure stands.
More than Expected
Less The chi-square matrix for
than zone (1) is shown in Table 2.
Expected Heather is positively associated
The area was further ex- amined by division into three zones, namely:
(1) Transects 1 - 9, character- ised by a predominance of gram- inaceous communities, bracken communities and zones of heather dominance.
(2) Transects 10 - 20, consist- ing mainly of heather but also containing small graminaceous and bracken areas.
(3) Transects 21- 34, contain- ing mainly heather.
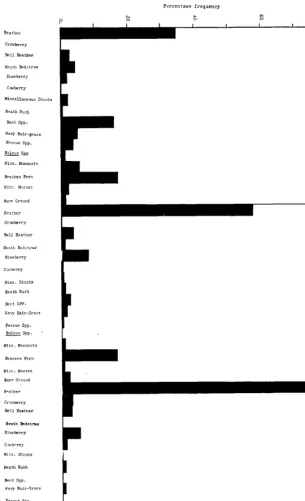
These zones can be picked out on the “point” map and specific frequencies for each zone are shown in Figure 2. Contingency tables were prepared for each zone, but owing to the large number of expected frequencies of < five in zones (2) and (3) and the high self: self occur- rences, especially of heather, a valid analysis of these zones was not possible.
only with wavy hair-grass, which in this area has received
Table 2. Chi-square matrix for fransecfs 1-9
Heather 1 21”” - - 1 - 0 - 3 - 16** 0 3 45** Bent grasses 5” 19** - - 3 _ 0 - 4* - 15** - - 46** Bracken - 1 - - - 0 - 0 - - 1 Total 6* 41** _ _ 4 _ - - 7* - 31** - 3 92**
(Values of chi-square not calculated for expected values < 5) Degree of association of:
Heather with wavy hair-grass**
!
More Bent grasses with fescues* and heath bedstraw** than
Bracken Expected
Degree of association of:
Heather with heath bedstraw” * Bent grasses with bell heather* and
wavy hair-grass* * Bracken
FIGURE 2. Percentage frequency of species and groups of species in zones 1, 2 and 3.
a competitive advantage as a re- sult of burning and heavy graz- ing pressure. On suitable soils the succession from heather to bent/fescue grassland appears to have been completed as a result of these two factors, and the sep- aration of soils on this basis re- ceived added emphasis by the highly significant negative as- sociation (one percent level) of heather with heath bedstraw,
of bent/fescue grassland. The bent-grasses are positively as- sociated with fescues and heath bedstraw and negatively with bell heather and wavy hair- grass. Bracken shows no signifi- cant associations.
Floristic Change
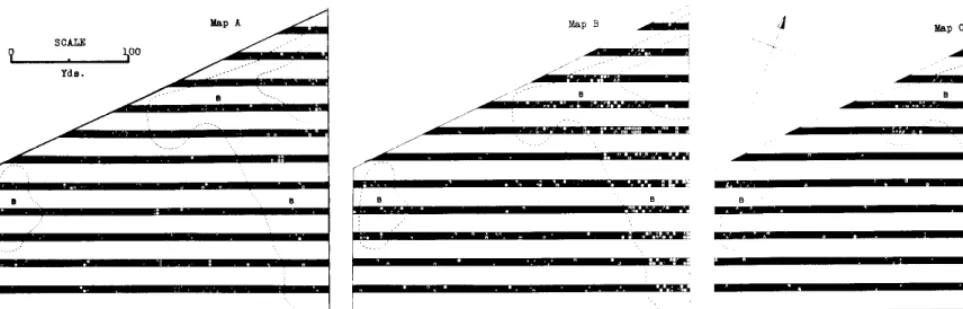
The comparisons discussed above are concerned with spatial differences in vegetation at a given time. Two areas of strongly dominant heather, at the north end of the area (be- tween transects 21 and 34)) were burnt however after the first analysis in 1956. The effect of burning on the vegetation and the subsequent nature of regen- eration is illustrated diagram- matically by construction of the “point” maps in Figure 3. Map A shows the condition before burning, Map B two years later and Map C eight years after burning.
Table 3 shows the percentage frequency of species for tran- sects 22 - 34 in the burnt and un- burnt areas for the three years 1954, 1958 and 1961. The general rise in frequency of heather in the unburnt area reflects the increasing dominance of the plant. In 1958, two years after burning area B (the area was practically devoid of vegetation after the burn in 1956) consider- able recolonisation had taken place. Heather had greatly in- creased and bare ground was only 18 percent. Other species including wavy hair-grass were
Table 3. Florisfic changes in burnf and unburnt areas, 1954-61 (percent frequency)
Unburnt Burnt
_
1954 1958 1961 1954 1958 1961 Heather 82.8 89.9 94.3
Blaeberry 5.1 0.9 0.7 Cowberry 1.6 0.6 0.3 Heath rush 1.1 0.9 0.4 Wavy hair-grass 1.0 0.6 0.2 Other species 7.1 6.0 4.0 Bare ground 1.3 1.1 0.1
- P - 100.0 100.0 100.0
/ 24
23
22
FIGURE 3. “Point” maps of area covered by transects 22-34. Map A shows vegetation in 1954, Map R in 1958 two years after burning and Map C in 1961. Areas marked B on all maps indicate location of 1956 burn.
contributing noticeably to the vegetation. By 1961 the succes- sion was considerably more ad- vanced with heather approach- ing its former prominent posi- tion. Other species were corres- pondingly reduced though still more prominent than before burning.
Unfortunately the sampling intensity was such that the data available from the two small burnt areas were considered to be insufficient to allow a valid chi-square analysis to be carried out at the various successional phases. The use of frequency and preparation of a series of “point” maps for comparisons in time, however, do demonstrate the manner in which segments of the survey area can be iso- lated easily for more specific study without repetition of the entire survey.
Conclusions
The technique has been found to satisfy the requirements for
certain agronomic studies in terms of speed and accuracy in the general characterisation of spatial pattern over an area, or on a given area at different times. It is simple and objective to operate and a map of con- siderable value can be produced readily. It is thought that the method might be applicable to a wide range of vegetation types, but from present evidence it is most suitable for use when the vegetation is disposed as a mo- saic of different communities, rather than where extensive uni- form areas occur. For many pur- poses, at least in preliminary work, it may be unnecessary to record individual species and in this case the use of a life form characterisation may be ade- quate, thus considerably reduc- ing the work.
The dimensions of the sam- plinz fork i.e., the length of the prongs and their distances apart will depend on the nature of the vegetation, particularly regard-
ing its height and whether closed or open communities are being studied. Although two in- dependent points recorded at each station would be statis- tically more acceptable, experi- ence has shown that even this departure from the technique adds considerably to the sam- pling time.
LITERATURE CITED
DAVIES, WILLIAM. 1960. Pastoral sys- tems in relation to world food supplies. The Advancement of Sci- ence, 17, 67, 272-280.
BROWN, DOROTHY. 1954. Methods of Surveying and Measuring Vegeta- tion. Commonwealth Bureau of Pastures and Field Crops Bulletin 42.
WILLIAMS, W. T. AND LAMBERT, J. M.
1959 and 1960. Multivariate Meth- ods in Plant Ecology.
I Association analysis in plant com- munities. Jour. of Ecol. 47: 83-101. II The use of an electronic digital computer for association analysis. Jour. of Ecol. 48: 689-710.
SpeciaMs
in
Qualify
N AT
1 V E G R A S S
E S
I
Wheatgrasses l Bluestems l Gramas l Switchgrasses l Lovegrasses l Buffalo l and Many OthersWe grow, harvest, process these seeds Native Grasses Harvested in ten States I Your Inquiries