Recognition and Depth Approximation of Dry
& Filled Potholes
Inderjeet Saluja
1, Radhika Karwa
2, Prof. Asha Bharambe
3, Dr. Manoj Sabnis
4Department of Information Technology, Vivekanand Education Society’s Institute of Technology
Maharashtra, India
Department of Information Technology, Vivekanand Education Society’s Institute of Technology
Maharashtra, India
Department of Information Technology, Vivekanand Education Society’s Institute of Technology
Maharashtra, India
Department of Information Technology, Vivekanand Education Society’s Institute of Technology
Maharashtra, India
ABSTRACT:The proper planning of repairs and rehabilitation of the asphalt pavement is one of the important tasks for safe driving. The most common form of distress on asphalt pavements are potholes. While travelling through roads in India, a person frequently finds potholes which could be either dry or water-filled. Therefore, to asseverate safe driving, its highly essential to detect / recognise potholes along with estimating their respective depth & area independent of their condition. One of the major reasons of improper road track happens due to unawareness of government towards the condition of road. Timely repairing potholes is crucial in safety, quality of driving, and reducing the cost of vehicle maintenance. Road pothole detection system will detect the potholes and also estimates its depth, area and count of potholes using Matplotlib, OpenCV and Machine Learning trained model respectively. The system will generate 3D plot for estimating the depth of the pothole thus making it easier to visualize it. The proposed system acquires potholes images through camera using Android application. After checking the redundancy of the image, it will be directly send to the official site of higher authorities along with dimensions / parameters and estimated material for repair. Using latitude and longitude information from the images, potholes are geotagged on the selected map.
KEYWORDS:Pothole, Depth, 3D Plot, Pothole Detection, Matplotlib, OpenCV, Machine Learning, Geotagged.
I. INTRODUCTION
II. RELATED WORK
2.1 Potholes Detection Based on SVM in the Pavement Distress Image
Jin Lin, et al [3], recommended a solution for recognition of potholes, constructed on Support Vector Machine which differentiated potholes from different deformities present on the road, for example splits or cracks etc. Inorder to detect the presence of potholes, the Support Vector Machine (SVM) was trained with a group of images of different pavements. The limitation of this model is that the model which is trained failed in detecting the defects on pavement if the pictures of the pavement are not properly taken or are not properly enlightened.
2.2 Metrology and Visualization of Potholes using the Microsoft Kinect Sensor
Moazzam, et al [4] recommended a solution which was economical for examining 3D pavement distress images that were captured. The cost of computation here is reduced by composite utilization of a low-cost Kinect sensor which aided by giving the undeviating depth measurement. The sensor used in the device consists of an RGB camera and an IR camera which would capture the depth images and RGB pictures that are put under examination using the MATLAB environment by extracting the characteristic and the metrological features to determine the exact depth of the potholes present in the image.
2.3 Pothole Detection and Warning System
Sudarshan S. Rode, et al [5], proposed to warn the vehicles nearby, vehicles furnished with Wi-Fi, collects data regarding the surface of road and transmit the data to Wi-Fi access point which broadcast to other vehicles. For that vehicles with Wi-Fi devices and adequate access point needs to be set up which was expensive.
2.4 An Intelligent System to Detect, Avoid and Maintain Potholes: A Graph Theoretic Approach
Sandeep Venkatesh, et al [6] recommended a solution to would detect along with which it would also avoid potholes making use of laser line striper along with a camera. The system consists of a database which is of central distribution wherein the location of the potholes was stored and maintained, along with this the system also sends a warning or an alert to the neighbouring transportation vehicles informing them about the presence of potholes utilizing Dedicated Short-Range Communication Protocol.
2.5.Pothole detection and severity measure-ment using laser imaging
Yu and Salari [7], implemented a system that uses laser imaging for detecting potholes. Pavement distress such as pothole is detected when the laser source deformation is observed in the captured images. Different techniques such as multi-window median filtering and tile partitioning are applied to detect the presence of potholes. These potholes are further classified based on their shapes and severity. Although this is an accurate and efficient method for detecting potholes, the cameras capture shaky images due to uneven road surface,which reduces the efficiency of pothole detection.
2.6 Road Hazard Detection and Sharing with Multimodal Sensor Analysis on Smartphones
III. METHODOLOGY
Even though there are other traditional systems for performing pothole detection which are involving vehicles equipped with sensors and camera provide accurate results, but the cost overhead associated with them makes them infeasible. But this paper aims at introducing a system that is highly inexpensive and provides accurate results with maximum precision.
3.1 Flow of Operations
First the user logs into his/her account and takes a picture of the pothole along with the current location of the user using the android application and upload the image to the server.The server performs threes actions on the image. By image processing the server first finds the number of potholes present in the image, secondly it finds the area of pothole(s) present and finally find the depth by generating a 3D plot.
3.2 Image Processing
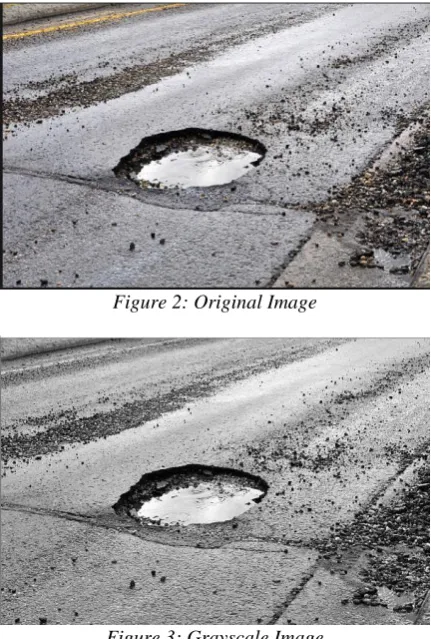
Firstly we find out the size of the image of the decoded image by using the function of OpenCV known as Numpy.shape, which return the height and width of the current image, this is required to create a mask of the image. As the next step the input image i(x,y) shown in Figure 2 is converted to grayscale image g(x,y) as seen in Figure 3 using the cv2.cvtColor() function of OpenCV. As the primary input, the function accrues the original form of the image from the user. Further as the secondary input, it acquires the color space conversion code. Considering that our goal is to convert the obtained original image from the BGR color space to grayscale, we tend to utilize the code COLOR_BGR2GRAY.
Figure 2: Original Image
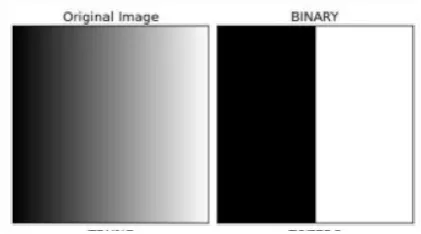
Then the grayscale image is converted into binary image. When the value of the pixel is found higher than a threshold value, the result is assigned as one value (which could be white) else it is assigned as another value (which could be black). This is achieved using the OpenCV function cv2.threshold. The primary parameter taken is the source image, such image should be a grayscale image. Secondary parameter is the threshold value which is utilized for classification of the pixel values. Tertiary parameter is the maxVal that is utilised to represent the value given if the value of the pixel is less than or is sometimes more than the specified threshold value.
Figure 4:Original Figure 5:Binary
In conversion of original image to binary image the pixels get rearranged in the below given format. Consider an example of the image as Figure 4 when converted to binary, the image gets converted into Figure 5.
Figure 6: Conversion of Original to Binary
The figure 6 shows the result of converting the original image to binary image. The next step is to get the object of interest, this is done with the help of the GrabCut algorithm. This GrabCut algorithm cuts the background object and removes it from the image which gives us the object of interest on which we perform some processing.
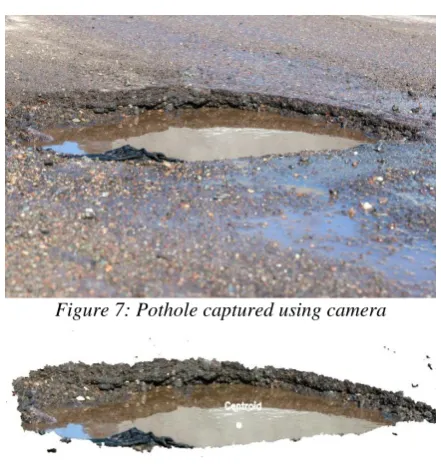
Figure 7: Pothole captured using camera
Figure 8: Masked Pothole
Once the object of interest is extracted, then the area of the pothole is found. For the area of pothole the function of OpenCV is used, the function cv2.contourArea() works by finding the number of counters in an image. To find the area first moments are found using cv2.moments(), which performs computations of all the moments until the third order of a polygon or rasterized shape while it tries to determine the center of the blob .Image Moment is a specific weighted average of pixel intensities present in the image, through the help of which we would be able to find some properties associated to the image, for example area, radius, centroid etc. Similarly to find the centroid of the original image, we normally convert the image to binary format and later detect its center. The centroid is represented by the:-
represents the x coordinate & represents the y coordinate of the centroid along with M denoting the Moment. After finding out the moments we calculate the area of object using the centroid already found. The function used for computing the area of the contour is cv2.contourArea(). Homogeneous to moments, computation of the area is done by the utilization of the Green formula. Thus, the result is the area returned along with the count of the non-zero pixels present. Since the image is made from a group of pixels, so the area calculated using the function is in pixels, therefore the area calculated is converted from pixels to square cm.
3.3 Deep Learning CNN Model
driving events.In theory, a single car could use the opinions of thousands or even millions of individual AI as it navigates a street. It is the key to voice control in consumer devices like smartphones, tablets, laptops, TVs, etc. Human level performance can be exceeded sometimes by using deep learning with state-of-the-art accuracy model. Large set of labeled data and neural networks architecture are used to train models which contains many layers without the use for manually extracting the data feature. One of the most popular types of deep neural networks is known as convolutional neural networks or CNN .[9] This system too uses the Convolutional Neural Network( CNN ), an example of which is shown in figure 9. In CNN we have used SqueezeNet Architecture for identifying whether the object of interest is present or not.
Figure 9: Example of CNN
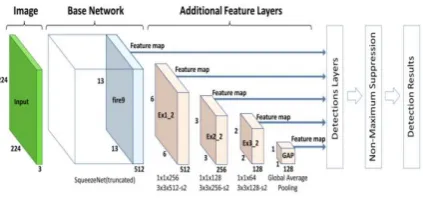
The architecture used in the system is given below in figure 10.
Figure 10: SqueezeNet Architecture
Figure 11: Multiple pothole
Figure 12: Potholes(s) Identified using CNN Model
3.4 Matplotlib 3D Depth Plot
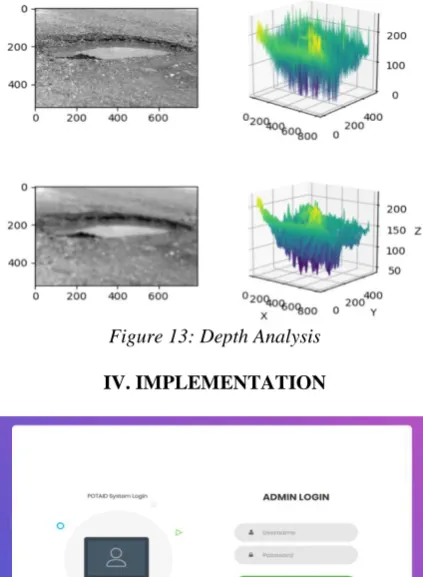
pothole(s) are uneven surface object, therefore we consider the lowest / the most deepest point from the 3D plot as depth of the pothole. From Figure 13 we can see that the 2D image of a pothole is inputted by the user & processed, a 3D projection is generated from it. If the original 2D image of pothole sent by the user is taken to form a 3D projection then we get a 3D plot with lots of noises present in the it. Therefore we have applied gaussian blur to the original image and then is processed for forming the 3D plot which reduces the noises present in the plot and which results in a better values of depth. Here the z axes gives us the depth.
Figure 13: Depth Analysis
IV. IMPLEMENTATION
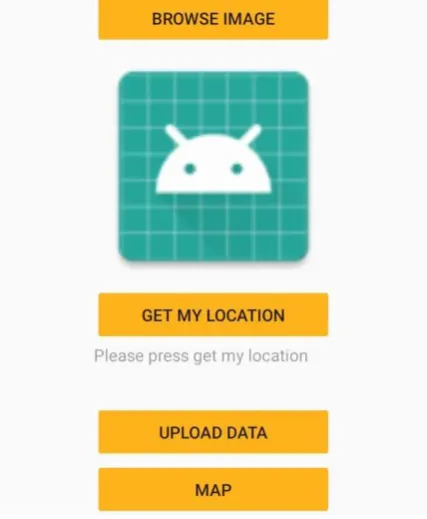
Figure 14: Admin Login
This will be the admin login page which will be operated by the user authorised through the administrator.
This is the dashboard visible to the system admins through which they will be able to see & operate the following functionalities: (i)The date and time at which the pothole was reported.
(ii)Area of the potholes in the image provided by the user. Area that will be displayed will be in sq cm. (iii)Depth of the pothole in cm.
(iv)Number of Pothole present in the image uploaded by the user.
(v)The admin will also be able to view the pothole on the Google Map by accessing the link of a particular entry in the table. (vi)The dashboard also gives the facility of viewing the pothole to admin which the user had sent using the app.
(vii)Admin will be also given a button on the top of the table “Process current reported images”, which will be used when there are entries made with the word “None” in columns of recently reported potholes.The admin will press the button and will get the measures of the pothole like area, depth etc which had been reported by the user.
Figure 16: Pothole Location
This will be viewed to admin when he/she tries to locate the pothole.The location from which the user had sent the image will be marked using red marker & shown to the admin on the map.
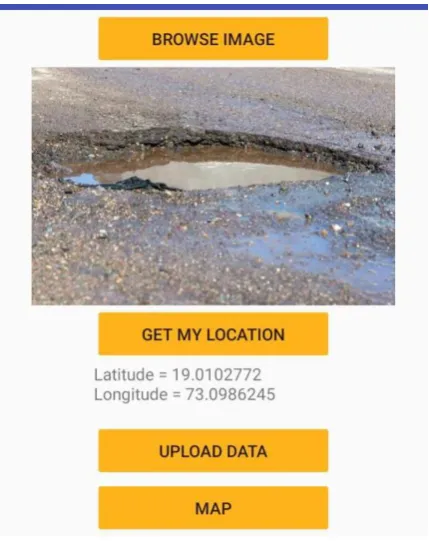
The android app shown in Figure 17 will be used by the user to report a pothole to the officials. Firstly the user has to capture theimage of pothole using the built-in camera of the phone then the image is browsed from gallery, next the user will get his/her location using Get Location button and finally the user will press the upload button.If the upload is successful then Thank You message will be displayed else an error message will be displayed. An example of this is shown below where a user is uploading a pothole image which he / she has captured using his/her phone built in camera, and then clicked the Get My Location button to get the current location in the form of latitude and longitude. Once the location of user is successfully then the user presses the Upload Data button, which sends all the data that is image, latitude and longitude is sent to the server for further processing which has been depicted below in Figure 18.
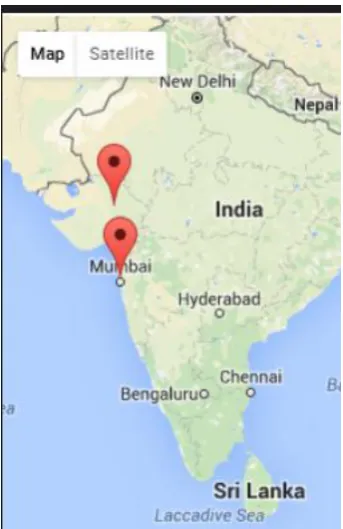
Figure 19: Map with pothole reported locations
The user has been given one more functionality that will allow the user to be able to view a google map containing all the potholes which had been reported by different users all around the country. Figure 19 shows the different locations within the country at which a pothole has been spotted.
V. CONCLUSION
We have performed various testing experiments in term of calculating count, area and depth of pothole. The most crucial key is to entirely use the information obtained. Firstly the model with false positive and negative image of pothole is trained to identify whether it’s pothole after identifying the count calculated after that the area and then the depth from a single image is obtained by using 3D plot algorithm.Results show that application can detect potholes and reckon all the parameters accurately.The government body are also intimated about the location of the pothole using the latitude and longitude while capturing image and thus the potholes can be recovered soon.
REFERENCES
[1]Christian Koch, Ioannis Brilakis, “Pothole Detection in Asphalt Pavement Images”, Journal Advanced Engineering Informatics Archive, Vol.25, No.3, pp.507-515, 2011.
[2]A REVIEW PAPER ON EXISTING POTHOLE DETECTION METHODS, International Research Journal of Engineering and Technology (IRJET) , e-ISSN: 2395-0056, p-ISSN: 2395-0072, Volume: 05 Issue: 12 | Dec 2018 .
[3] Jin Lin, Yayu Liu, “Potholes Detection Based on SVM in the Pavement Distress Image”, In Proceedings of International Symposium on Distributed Computing and Applications to Business, Engineering and Science, pp.544-547,2010.
[4] I. Moazzam, K. Kamal, S. Mathavan, S. Usman, M.Rahman, “Metrology and Visualization of Potholes using the Microsoft Kinect Sensor”, In Proceedings of IEEE Conference on Intelligent Transport System, pp.1284- 1291, 2013
Conference on Electronic Computer Technology, pp.286- 290, 2009
[6] Sandeep Venkatesh, Abhiram E, Rajarajeswari S, Sunil Kumar K M and Shreyas Balakuntala, “An Intelligent System to Detect, Avoid and Maintain Potholes: A Graph Theoretic Approach”, In Proceedings of International Conference on Mobile Computing and Ubiquitous Networking, pp.80, 2014.
[7] X. Yu and E. Salari, “ pothole detection and severity measure-ment using laser imaging,” in Proc. IEEE Int. Conf. EIT, May 2014,pp. 1–5. [8] Faith Orhan, P. Erhan Eren, “Road Hazard Detection and Sharing with Multimodal Sensor Analysis on Smartphones”, In Proceedings of International Conference on Next Generation Mobile Apps, Services and Technologies, pp. 56-61, 2013.
[9]https://www.mathworks.com/discovery/deep-learning.html (Available Online)
[10] A Mobile Outdoor Augmented Reality MethodCombining Deep Learning Object Detection and Spatial Relationships for Geovisualization, Published: 24 August 2017