ISSN(Online): 2320-9801
ISSN (Print): 2320-9798
I
nternational
J
ournal of
I
nnovative
R
esearch in
C
omputer
and
C
ommunication
E
ngineering
(An ISO 3297: 2007 Certified Organization)
Vol. 3, Issue 5, May 2015
Intelligent Portable Data Acquisition System
with Predictive Features
Neeraj A. Kulkarni, S.O. Dahad
M.E. Student, Dept. of Electronics and Telecommunication, Government College of Engineering, Jalgaon, North
Maharashtra University, Maharashtra, India
Associate Professor, Dept. of Electronics and Telecommunication, Government College of Engineering, Jalgaon, North
Maharashtra University, Maharashtra, India
ABSTRACT: Day by day advancement of technology, advances the industry and agricultural field. So continuous monitoring is required in industry and agricultural field. Monitoring established in many ways. Data acquisition does monitoring easily. Data acquisition unit mentioned in this paper have sensor circuitry. These sensor circuitry connected to AVR ATMEL microcontroller. AVR ATMEL microcontroller is main processing unit in this project. This microcontroller sends sensors value to android mobile. Android mobile application which is designed in ECLIPSE software. Android mobile transfers the data to the server and to the client module which is designed in NETBEANS software. Client module controls the devices which are connected to microcontroller. Client module can remotely switched ON and OFF devices
KEYWORDS: sensor, microcontroller, eclipse, netbeans, client module , server etc.
I. INTRODUCTION
In the field of industry , agriculture continuous monitoring of farm and industry is important in today’s scenario. So that system is require which monitors the farm and industry and transfers the monitored data to remote location. The objective is that to design such data acquisition system. Enhancement of technology, researchers desire to obtain their sensor data faster and to make remotely data available over longer distance Data acquisition is defined as the process of taking a real world signal as input, forward to the computer, for further processing, analysis, storage. Component of data acquisition system includes sensors, that convert physical parameter to electrical signals, signals conditioning circuitry to convert sensor signals into a form that can be converted to digital values, and Analog to digital convertor, which convert conditioned sensor signal to digital values. Data acquisition system are controlled by software programs developed by programming language JAVA in eclipse and NETBEANS software. So the main that to design complete hardware and software section for remotely data acquisition and remotely controlling using software which are mentioned above. “Predictive features” involves in this paper, software takes the further decision by applying ID3 algorithms on the database which are available on server.
II. RELATEDWORK
In 1963 IBM produced computers which specialized in data acquisition system. Firstly they produce IBM 7770 DAQ system and than their higher version which is IBM 1800 data acquisition and control system. These are very expensive data acquisition system. Their improved version launched in 1974 by techmar / scientific solution named as S 100 computers and data acquisition card. In 1981 first data acquisition pc introduced by IBM personnel computer and scientific solution.[7] After that various processor are used for the data acquisition and transmission of data to a longer distance. Various microcontroller are used for the data acquisition and transmission. RS 232 cable is used for interfacing between microcontroller and personnel computer. In 1998 Edwards uses a system which has 2 PC 104 which are connected to central monitoring system. These system was designed for analysis and monitoring potential failure of a design in field condition.[6] In 2001 Adcock et al. use a microcontroller ad RF modem to transmit data back to PC. Their system was designed to replace traditional data acquisition system used in wind tunnel.[6]
ISSN(Online): 2320-9801
ISSN (Print): 2320-9798
I
nternational
J
ournal of
I
nnovative
R
esearch in
C
omputer
and
C
ommunication
E
ngineering
(An ISO 3297: 2007 Certified Organization)
Vol. 3, Issue 5, May 2015
a remotely controlled boat. These system collect water from depth.[5] In 2009 paper is published in world academy of science which uses microcontroller and LABVIEW software for totally integrated smart energy system.[2] In 2009 Ali Ziya Alkar and Mehmat aatif karaca explain the embedded DAQ system communicates with GPRS which accessible through web.[1] In 2011 manivannan M and kumaresan explains design of data acquisition system using ARM 9 platform in a published paper to ICETECT.[3]
III.PROPOSED SYSTEM
A. Hardware Explanation: Hardware of proposed system have mainly sensor’s , microcontroller, bluetooth connector.
SENSOR : This system have totally 6 sensor temperature , light , Gas sensor , humidity sensor , moisture sensor and level.
Temperature sensor : Thermistor is used in temperature sensor. A thermistor is a type of resistor whose resistance varies significantly with temperature. Thermistor is differ from RTD in that the material used in thermistor is generally a ceramic or polymer while RTD uses pure metal. Thermistor typically achieve higher precision within a limited temperature r ang typically –90 degree Celsius to 130 degree Celsius.[7]
Light sensor : Light sensor uses LDR. 2 cadmium sulphide photo conductive cells with spectral responses similar to that of the human eye. The cell resistance falls with increasing light intensity . Application include smoke detection, automatic lightning control.[7]
Gas sensor : MQ-6 sensor used in place of gas sensor. MQ 6 sensor have high sensitivity to LPG, iso butane and propane and small sensitivity to alcohol and smoke. MQ 6 has fast response , stable and long life and simple drive circuit. MQ 6 composed by micro AL2O3 ceramic tube, Tin dioxide sensitive layer , measuring electrode and heater and fixed into a crust made by plastic and stainless steel.
Humidity sensor : Humidity is defined as the amount of water vapour in atmosphere of air or other gases. The humidity sensor SY HS 220 as of capacitive type , comprising on chip conditioner. It is mounted on PCB and PCB consists of cmos timer , AC amplifier , Oscillator. This sensor provides DC voltage depending upon humidity of surrounding in RH%. The operating humidity range is 30% RH to 90% RH.[4]
Moisture sensor : This Moisture Sensor uses Immersion Gold which protects the nickel from oxidation. This Moisture Sensor can read the amount of moisture present in the soil surrounding it. These items have low power consumption, and high sensitivity, which are the biggest characteristics of this module. This sensor has Working voltage: 5V ,Working Current: <20ma, Interface: Analog, Working temperature: 10~60.
Level sensor : Forlevel measurement POT is used. A potentiometer, informally a POT, is a three-terminal resistor with a sliding or rotating contact that forms an adjustable voltage divider. If only two terminals are used, one end and the wiper, it acts as a variable resistor or rheostat.
ISSN(Online): 2320-9801
ISSN (Print): 2320-9798
I
nternational
J
ournal of
I
nnovative
R
esearch in
C
omputer
and
C
ommunication
E
ngineering
(An ISO 3297: 2007 Certified Organization)
Vol. 3, Issue 5, May 2015
Fig 1. Circuit diagram using microcontroller
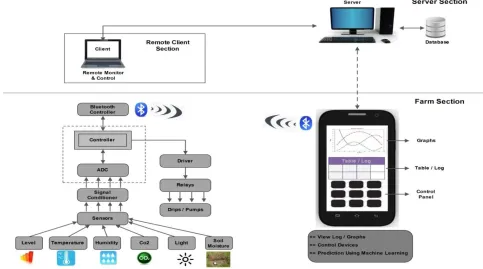
B. General block diagram – General block diagram consist a simple DAQ unit which have microcontroller unit interface with Bluetooth connector which is connected through Bluetooth device(mobile). Mobile puts the data on server. Fig 2 shows the general block diagram.
ISSN(Online): 2320-9801
ISSN (Print): 2320-9798
I
nternational
J
ournal of
I
nnovative
R
esearch in
C
omputer
and
C
ommunication
E
ngineering
(An ISO 3297: 2007 Certified Organization)
Vol. 3, Issue 5, May 2015
Fig 3. Photograph of Hardware of system
BLUETOOTH CONNECTOR : Bluetooth device is connected to microcontroller. Microcontroller sends the sensor’s data to another Bluetooth device (android mobile) as shown in fig 2 via Bluetooth connector. After sending data to android device, android device can monitor the sensor’s value with help of android application.
B. Software Explanation : Basically 3 software are used in above proposed system.
MICRO C AND AVR FLASH : Micro c pro for AVR is powerful, feature rich development tool for AVR microcontroller. It is design to provide the programmer with easiest possible solution for developing application for embedded system without compromising performance and control. The software used for burning the program in the microcontroller is the WinAVR(AVR Flash). WinAVR is comprised of many open source projects. As the microcontroller AT-MEG32 itself contains ADC at its port A terminal. So there is no need for external ADC circuit. Different pins of port A are allotted to different sensor circuit. There are total 73 cases involved in microcontroller, one case for each pins of its I/O operations, then for each ports along with its I/O operations and lastly one case is for ADC.
ECLIPSE : Android application for controlling devices (which is connected to microcontroller) is designed inn eclipse software. Eclipse is a multi-language software development environment comprising an integrated development environment (IDE) and an extensible plug-in system. It is written mostly in Java. The Eclipse SDK (which includes the Java development tools) is meant for Java developers. The Eclipse SDK includes the Eclipse Java development tools (JDT), offering an IDE with a built-in incremental java compiler and a full model of the Java source files. This allows for advanced refactoring techniques and code analysis.
ISSN(Online): 2320-9801
ISSN (Print): 2320-9798
I
nternational
J
ournal of
I
nnovative
R
esearch in
C
omputer
and
C
ommunication
E
ngineering
(An ISO 3297: 2007 Certified Organization)
Vol. 3, Issue 5, May 2015
D. Flow chart :
Figure 4 Flow Chart Of Whole System Operation
IV.EXPERIMENTAL RESULTS
Experiment results shows the all the sensor value. In which all 6 sensor value shows in fig 5 in android application. Value is increase and decrease as par the value of corresponding environment. Fig. 5 shows the experimental result of above proposed system.
Initialize All System Variables
Initialize Serial Port
Connect Pins of Port A to Respective Sensors
Send Data to Port A for Respective Parameters
Digital Value is obtained at Port A
Initialize Bluetooth Connection
Enter IP Add.
Send Data to Android Smart Phone
Start Monitoring Temp., light, humidity, gas,level,moisture
Display Values on Smart Phone
Initialize Server PC with WIFI
Send Data to Server PC
Display Temp., Level gas,level,moisture.humidity
ISSN(Online): 2320-9801
ISSN (Print): 2320-9798
I
nternational
J
ournal of
I
nnovative
R
esearch in
C
omputer
and
C
ommunication
E
ngineering
(An ISO 3297: 2007 Certified Organization)
Vol. 3, Issue 5, May 2015
Fig 5 All Sensor value
Fig 6 shows incremented value of humidity sensor(sensor 3) when the humidity is incremented as compare to fig 5 similarly other sensor also shows the changed value
Fig 6. Incremented value of Humidity sensor
ISSN(Online): 2320-9801
ISSN (Print): 2320-9798
I
nternational
J
ournal of
I
nnovative
R
esearch in
C
omputer
and
C
ommunication
E
ngineering
(An ISO 3297: 2007 Certified Organization)
Vol. 3, Issue 5, May 2015
Fig 7 IP Address Entering Pallet
Fig 8 shows the result of server side window and by just clicking on pallet we can control the devices which are connected to the microcontroller ports.
Fig 8. Remote control window at the client side
V. CONCLUSION
ISSN(Online): 2320-9801
ISSN (Print): 2320-9798
I
nternational
J
ournal of
I
nnovative
R
esearch in
C
omputer
and
C
ommunication
E
ngineering
(An ISO 3297: 2007 Certified Organization)
Vol. 3, Issue 5, May 2015
above. Collected data from data acquisition system transfers via bluetooth which is reliable way of communication. Data put on server via Bluetooth can easily accessible via web or internet. So client module can access of server and easily controls the devices. This system can be applied to agricultural field , industry , petroleum and so on.
REFERENCES
1. Ali Ziya Alkar, Member, IEEE, and Mehmet Atif Karaca, An Internet-based interactive embedded data-acquisition system for real-time applications, ieee transactions on instrumentation and measurement, vol. 58, no. 3, march 2009.
2. Muhammad Tahir Qadri, M. Irfan Anis, M. Nawaz Irshad Khan, Totally integrated smart energy system through data acquisition via remote location, World Academy of Science, Engineering and Technology 26 2009.
3. Manivannan M, Kumaresan N, Design of on-line interactive data acquisition and control system for embedded real time applications, IEEE N 978-1-4244-7926-9/11/$26.00 ©2011.
4. B. P. Ladgaonkar and A. M. Pawar, Design and implementation of sensor node for wireless sensors network to monitor humidity of high-tech polyhouse environment , international journal of advances in engineering & technology, july 2011 ©ijaet.
5. Lohachit, W.; Bachnak, R.; Michaud, P.; Duff, S.; Adams, J.; Steidley, C. “Wireless Data Acquisition and Logging in Shallow Water Environments”. IEEE International Symposium on Intelligent Control – Proceedings (pp. 980-984). Institute of Electrical and Electronics Engineers Inc.
6. Douglas John Guardino, Design of Sensor and Wireless Data Acquisition System For Field Testing of Hull Models.