Copyright to IJIRSET www.ijirset.com 42
URBAN PLANNING USING REMOTE SENSING
Mahesh Jhawar, Nitin Tyagi, Vivek Dasgupta
B.TECH Civil, B.TECH Civil, B.TECH Geo Science, University of Petroleum and Energy, Dehradun, India
Abstract: Urbanization is not merely a modern process, but a rapid transformation of human social roots on a global scale, where village culture is being rapidly replaced by the urban culture. In India, the complexity of urban development is so rapid that it demands quick response and perspective physical planning of the cities and towns. Therefore, it is necessary and fundamental for policy makers to incorporate remote sensing into urban planning and management. Remote sensing is the observation and measurement of objects from a distance, i.e. instruments or recorders are not in direct contact with objects under investigation. Remote sensing depends upon measuring some kind of energy that is emitted, transmitted, or reflected from an object in order to determine certain physical properties of the object. One of the most common types of remote sensing is photography. Till date maps and land survey records from the 1960’s and 70’s were used for urban studies, but now the trend has shifted to using digital, multispectral images acquired by EOS and other sensors. The output of a remote sensing system is usually an image representing the scene being observed. Since remote sensing may not provide all the information needed for a full-fledged assessment, many other spatial attributes are needed to be integrated with remote sensing data. This integration of spatial data and their combined analysis is performed through GIS technique.The fashion of using remotely sensed data in urban studies began with first-generation satellite. The high resolution PAN and LISS III merged data can be used together effectively for urban applications. Remote sensing is widely in Cartographic surveys .P-6 data is used for updating terrain visualization, generation of a national topographic database, utilities planning and other GIS applications needed for urban areas. The satellite will provide cadastral level information up to a 1:5,000 scale, and will be useful for making 2-5meter contour map (NRSA 2005). Remote Sensing techniques are extremely useful for selection of sites for specific facilities such as hospitals, restaurants, solid waste disposal and industry. Urban planning requires a large volume of data both at the time of planning and at the time of implementation of the plan to determine the status of the available facilities. Thus remote sensing techniques provide accurate, orderly and reliable information for planning and management of a town or a city. Remote Sensing techniques are extremely useful for change detection analysis and selection of sites for specific facilities such as hospitals, restaurants, solid waste disposal and industry.
Keywords: Urbanization, Remote Sensing, GIS, Cartographic surveys
I. INTRODUCTION
Copyright to IJIRSET www.ijirset.com 43 uncontrolled urbanization has been responsible for many of the problems, our cities experiences today, resulting in substandard living environment, acute problems of drinking water, noise and air pollution, disposal of waste, traffic congestion etc. To improve
these environmental degradations in and around the cities, the technological development in relevant fields have to solved these problems caused by rapid urbanization, only then the fruits of development will reach most of the deprived ones.
The modern technology of remote sensing which includes both aerial as well as satellite based systems, allow us to collect lot of physical data rather easily, with speed and on repetitive basis, and together with GIS helps us to analyze the data spatially, offering possibilities of generating various options (modeling), thereby optimizing the whole planning process. These information systems also offer interpretation of physical (spatial) data with other socio-economic data, and thereby providing an important linkage in the total planning process and making it more effective and meaningful.
Recent technological advances made in domain of spatial technology cause considerable impact in planning activities. This domain of planning is of prime importance for a country like India with varied geographic patterns, cultural activities etc. The purpose of using GIS is that, maps provide an added dimension to data analysis which brings us one step closer to visualizing the complex patterns and relationships that characterize real-world planning and policy problems. Visualization of spatial patterns also supports change analysis, which is important in monitoring of social indicators. This in turn should result in improving need assessment. The objectives of this paper are to explain remote sensing and GIS applications in various stages of planning, implementation and monitoring of the urban area.
II. URBANIATION
Urbanizationor urban driftis the physical growth of urban areas as a result of rural migration and even suburban concentration into cities, particularly the very largest one. It is closely linked to morderniation, industrialisation, and the sociological process of rationalisation. The rapid urbanization of the world’s population over the twentieth century is described in the 2005 Revision of the UN World Urbanization Prospects report. The global proportion of urban population rose dramatically from 13% (220 million) in 1900, to 29% (732 million) in 1950, to 49% (3.2 billion) in 2005. The same report projected that the figure is likely to rise to 60% (4.9 billion) by 2030.
Urbanization has been considered as a problem in India till recently and the city governments in the country have always struggled to solve the problems. But in recent years the perception has changed. With the cities contributing more than 65 per cent of the GDP in the recent years, the government has begun to look at the urban areas as engines of growth. With rapidly increasing population in the urban areas, urbanization has emerged as one of the most serious challenges before the planners. The first appearance of cities and urban development in India was around 2600 BC with the advent of the Indus Valley civilization.
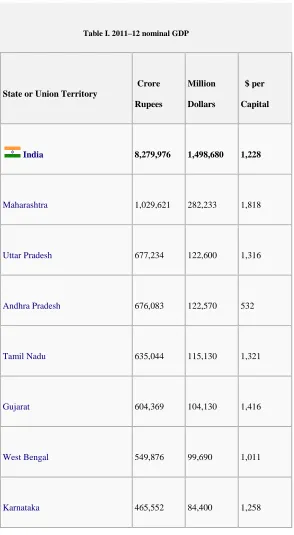
Copyright to IJIRSET www.ijirset.com 44 Fig.1 India- Highest shares in GDP
Copyright to IJIRSET www.ijirset.com 45
Table I. 2011–12 nominal GDP
State or Union Territory
Crore
Rupees
Million
Dollars
$ per
Capital
India 8,279,976 1,498,680 1,228
Maharashtra 1,029,621 282,233 1,818
Uttar Pradesh 677,234 122,600 1,316
Andhra Pradesh 676,083 122,570 532
Tamil Nadu 635,044 115,130 1,321
Gujarat 604,369 104,130 1,416
West Bengal 549,876 99,690 1,011
Copyright to IJIRSET www.ijirset.com 46
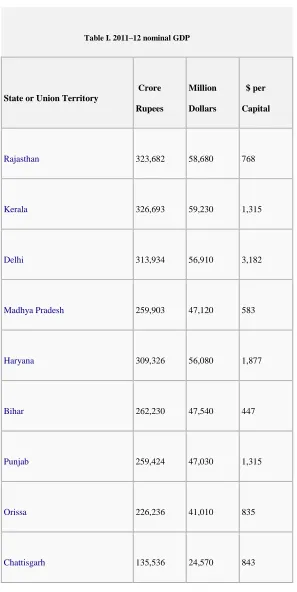
Table I. 2011–12 nominal GDP
State or Union Territory
Crore
Rupees
Million
Dollars
$ per
Capital
Rajasthan 323,682 58,680 768
Kerala 326,693 59,230 1,315
Delhi 313,934 56,910 3,182
Madhya Pradesh 259,903 47,120 583
Haryana 309,326 56,080 1,877
Bihar 262,230 47,540 447
Punjab 259,424 47,030 1,315
Orissa 226,236 41,010 835
Copyright to IJIRSET www.ijirset.com 47
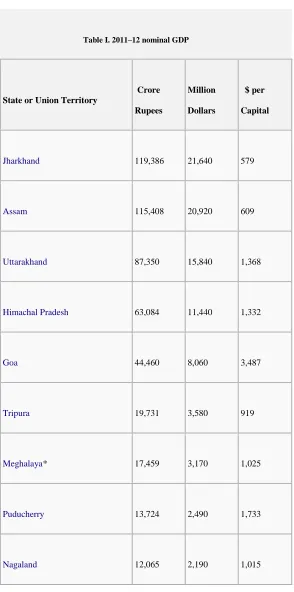
Table I. 2011–12 nominal GDP
State or Union Territory
Crore
Rupees
Million
Dollars
$ per
Capital
Jharkhand 119,386 21,640 579
Assam 115,408 20,920 609
Uttarakhand 87,350 15,840 1,368
Himachal Pradesh 63,084 11,440 1,332
Goa 44,460 8,060 3,487
Tripura 19,731 3,580 919
Meghalaya* 17,459 3,170 1,025
Puducherry 13,724 2,490 1,733
Copyright to IJIRSET www.ijirset.com 48
Table I. 2011–12 nominal GDP
State or Union Territory
Crore
Rupees
Million
Dollars
$ per
Capital
Manipur 10,188 1,850 584
Arunachal Pradesh 9,357 1,700 1,126
Mizoram 6,059 1,100 879
Sikkim 5,652 1,020 1,469
Andaman & Nicobar 4,241 770 1,489
Copyright to IJIRSET www.ijirset.com 49 I. causes of urbanization in India
The main causes of urbanization in India are:
Expansion in government services, as a result of Second World War Migration of people from Pakistan after partition of India
The Industrial Revolution
Eleventh five year plan that aimed at urbanization for the economic development of India Economic opportunities are just one reason people move into cities
Infrastructure facilities in the urban area Growth of private sector after 1990
II. Problems in urbanization
Lack of civic amenities is yet another problem. As per 2001 slum census only 65.4 per cent of the households in the cities and towns had access to drinking water within their premises. Remaining households either had the water supply source outside their premises or away from their houses.
1. Urbanization - Source of lighting: Source of lighting is another important area which was surveyed during the census. Though the percentage of households having an electric source of energy was much higher than in the rural areas, yet more than 12 per cent of the households in the urban areas did not have an electric source of lighting and had to depend on other sources like kerosene. About 0.4 per cent of the households in cities and towns had no source of lighting at all.
2. Urbanization - Availability of education facilities: In the urban areas is also a key area, particularly for the poor. While the affluent and upper middle classes normally have best of educational facilities available to them in the cities, the poorer sections find it hard to have access even to basic educational facilities. The level of male and female literacy rates in the slum areas is distinctly lower than non-slum population of cities, with Patna recording highest difference of almost 30 per cent between the level of literacy rates in slum and non-slum areas of the city.
3. Urbanization – Healthcare facilities: Lack of good healthcare facilities is also an area of serious concern. As per the report of a Task Force appointed by the government of India to advise on health scenario in the urban slums, it was pointed out that 6 out of 10 children in slum areas are delivered at home in Indian slums. Further, more than half of India’s urban poor children are underweight and the state of under-nutrition in urban areas is worse than in the rural areas. Reach and utilization of essential preventive health services by the urban poor is generally found to be very low and about 60 per cent of the children below one year of age are not fully immunized. Only 4 per cent couples use birth spacing methods.
Copyright to IJIRSET www.ijirset.com 50 Urbanization – Government Role
For the last about six decades, the government has focused on rural development and rural poverty alleviation. Billions of rupees have been spent but even after 60 years of concentration on this sector, the absolute number of rural poor in the country has actually increased. The government is now viewing the urbanization process as an alternative strategy to eradicate rural poverty. Growth rate of population in the cities in the country is much higher than the general growth rate of population in the country and there is a need to strengthen the cities and towns to be able to brace up to the challenges ahead. The government of India, in December 2005, launched an ambitious programme called Jawaharlal Nehru National Urban Renewal Mission (JNNURM), for renewal of Indian cities on sustainable basis. 63 cities have been chosen under the Mission. There are also two sub-missions. First sub-mission aims at strengthening the urban infrastructure like water supply, sewerage, traffic flow, decongestion, scientific solid waste management, proper storm water drainage, preservation of heritage etc. Second sub-mission is aimed at providing basic services to the urban poor, including proper housing at affordable rates and upgradation of slums to ensure that all the slum areas in the mission cities are provided with the same level of facilities as are available to the better areas in the Mission cities.
Funding pattern under the JNNURM is that for the States of the north east 90 per cent of the cost of projects approved under the mission is to be provided by the Union government as grant in aid and the remaining amount has to be pooled in by the Urban Local Body (ULB) concerned and the State government. For other hilly States and the cities with less than one million population, the percentage of ACA is 80 per cent. For cities with population between one million and four million, the ACA is 50 per cent of the project cost, while the same for the cities with over four million population is 35 per cent. It is expected that after including the State and ULB share, during the mission period (upto 2012-13), more than Rs 1,50,000 crore would be spent for up-gradation of urban infrastructure and for providing basic services for urban poor in the Mission cities. In addition to the JNNURM funding and projects, the city administration has to make special efforts to make sure that the challenges of urbanization are met and the cities and towns are able to cope up with the urban problems in the years to come
Consequences of Urbanization
Rapid rise in urban population, in India, is leading to many problems like increasing slums, decrease in standard of living in urban areas, also causing environmental damage. The Industrial Revolution in the 18th century caused countries like United States and England to become superpower nations but the present condition is worsening. India's urban growth rate is 2.07% which seems to be significant compared to Rwanda with 7.6%. India has around 300 million people living in metropolitan areas. This has greatly caused slum problems, with so many people over crowding cities and forcing people to live in unsafe conditions which also includes illegal buildings. Water lines, roads and electricity are lacking which is causing fall of living standards. It is also adding to the
problem of all types of pollution. Urbanization also results in a disparity in the market, owing to the large demands of the growing population and the primary sector struggling cope with them.
Remote sensingis the collection of information about an object or phenomenon without making physical contact with the object. In modern usage, the term generally refers to the use of aerial sensor technologies to detect and classify objects on Earth (both on the surface, and in the atmosphere and oceans) by means of propagated signals (e.g. electromagnetic radiation emitted from aircraft or satellites).
There are two main types of remote sensing:
Copyright to IJIRSET www.ijirset.com 51 Active remote sensing: Active remote sensing on the other hand, involves transmitting energy, allowing that energy to reflect off to the surrounding environment, and then recollecting that energy using a sensor. RADAR and LiDAR are examples of active remote sensing where the time delay between emission and return is measured, establishing the location, speed and direction of an object.
Remote sensing makes it possible to collect data on dangerous or inaccessible areas. Remote sensing applications include monitoring deforestation in areas such as the Amazon Basin, glacial features in Arctic and Antarctic regions, and depth sounding of coastal and ocean depths. Remote sensing also replaces costly and slow data collection on the ground, ensuring in the process that areas or objects are not disturbed.
Orbital platforms collect and transmit data from different parts of the electromagnetic spectrum, which in conjunction with larger scale aerial or ground-based sensing and analysis, provides researchers with enough information to monitor trends such as El Nino and other natural long and short term phenomena. Other uses include different areas of the earth sciences such as natural resource management, agricultural fields such as land usage and conservation, and national security and overhead, ground-based and stand-off collection on border areas.
By satellite, aircraft, spacecraft, buoy, ship, and helicopter images, data is created to analyze and compare things like vegetation rates, erosion, pollution, forestry, weather, and land use. These things can be mapped, imaged, tracked and observed. The process of remote sensing is also helpful for city planning, archaeological investigations, military observation and geo morphological surveying
.
Copyright to IJIRSET www.ijirset.com 52
Table II. Major regions of the Electromagnetic spectrum
Region Name Wavelength Comments
Gamma Ray < 0.03 nanometers Entirely absorbed by the Earth's atmosphere and not available for remote sensing.
X-ray 0.03 to 30 nanometers Entirely absorbed by the Earth's atmosphere and not available for remote sensing.
Ultraviolet 0.03 to 0.4 micrometers Wavelengths from 0.03 to 0.3 micrometers absorbed by ozone in the Earth's atmosphere.
Photographic Ultraviolet
0.3 to 0.4 micrometers Available for remote sensing the earth. Can be imaged with photographic film.
Visible 0.4 to 0.7 micrometers Available for remote sensing the Earth. Can be imaged with photographic film.
Infrared 0.7 to 100 micrometers Available for remote sensing the Earth. Can be imaged with photographic film.
Reflected Infrared 0.7 to 3.0 micrometers Available for remote sensing the Earth. Near Infrared 0.7 to 0.9 micrometers.
Can be imaged with photographic film.
Thermal Infrared 3.0 to 14 micrometers Available for remote sensing the Earth. This wave length cannot be captured
with photographic film. Instead, mechanical sensors are used to image this wavelength band.
Microwave or Radar 0.1 to 100 centimeters Longer wavelengths of this band can pass through clouds, fog, and rain.
Images using this band can be made with sensors that actively emit microwaves.
Radio > 100 centimeters Not normally used for remote sensing the Earth.
Copyright to IJIRSET www.ijirset.com 53 III. STAGES OF URBAN PLANNING
Urban areas face many critical environmental problems which are manifested at the time of crises. To avoid such occurrences the prime requirement is quantification which requires a comprehensive Urban Information System (UIS) to be developed to cater the developmental needs of the growing urban areas.
Sequential steps followed by urban information system:
1. Thematic map preparation from satellite data using visual interpretation techniques.
2. Generation of spatial framework in GIS for perspective and development plans.
3. Integration of thematic maps using GIS techniques for urban sprawl analysis and urban land use change analysis.
IV. REMOTE SENSING AND GIS APPLICATIONS IN URBAN PLANNING
In India, the complexity of urban development is so dramatic that it demands immediate attention and perspective physical planning of the cities and towns. it is necessary and fundamental for policy makers to integrate like remote sensing into urban planning and management. New approaches are required, and new methods must be incorporated into current practice.
Until recently, maps and land survey records from the 1960’s and 70’s were used for urban studies, but now the trend has shifted to using digital, multispectral images acquired by EOS and other sensors. The trend towards using remotely sensed data in urban studies began with first-generation satellite sensors such as Landsat MSS and WAS given impetus by a number of second generation satellites: Landsat TM, ETM+ and SPOT HRV. The recent advent of a third generation of very high spatial resolution (˂5meter/pixel) satellite sensors is stimulating.
Advancement in the technology of remote sensing has brought miracle in the availability of the higher and higher resolution satellite imageries. They are IRS-P6 Resourcesat imagery with 5.8 meter resolution in multispectral mode, IRS-1D Pan image with 5.8 meter resolution, Cartosat-I imagery of 2.5 meter resolution with stereo capabilities, Cartosat-II with 1 m, IKONOS imageries of Space Imaging with 4 meter in multispectral mode and 1 meter in panchromatic mode, Quickbird imagery of Digital Globe with 61 cm resolution in panchromatic mode. These high resolutions of the sensors provide a new methodology.
Apart from Cartographic applications, P-6 data will be useful in cadastral mapping and updating terrain visualization, generation of a national topographic database, utilities planning. The satellite will provide cadastral level information up to a 1:5,000 scale, and will be useful for making 2-5 meter contour map (NRSA 2005).
The output of a remote sensing system is usually an image representing the scene being observed. Since remote sensing may not provide all the information needed for a full-fledged assessment, many other spatial attributes from various sources are needed to be integrated with remote sensing data. This integration of spatial data and their combined analysis is performed through GIS technique. It is a computer assisted system for capture, storage, retrieval, analysis and display of spatial data and non-spatial attribute data. The data can be derived from alternative sources such as survey data, geographical/topographical/aerial maps or archived data. Data can be in the form of locational data (such as latitudes/longitudes) or tabular (attribute) data.
I.Application of Remote Sensing technology can lead to innovation in the planning process in various ways:
Copyright to IJIRSET www.ijirset.com 54 different scales is feasible. Similarly superimposition of revenue maps on basemaps with reasonable accuracy is great advantage compared to manually done jobs.
2. Digital formate: correlating various layers of information about a feature from satellite imagery, planning maps and revenue maps is feasible with the help of image processing software like ERDAS Imagine, ENVI and PCI Geomatica, ILWIS. Such super imposed maps in GIS software like Map info, Geomedia, Arc View, Auto CAD Map and Arc GIS provide valuable information for planning, implementing and management in urban areas.
Fig.5 Satellite Image
Table III. List of Indian Remote Sensing Satellites
Serial
No. Satellite Date of Launch Launch Vehicle Status
1 IRS 1A 17 March 1988 Vostok, USSR Mission Completed
Copyright to IJIRSET www.ijirset.com 55
3 IRS P1 (also IE) 20 September 1993 PSLV-D1 Crashed, due to launch failure of PSLV
4 IRS P2 15 October 1994 PSLV-D2 Mission Completed
5 IRS 1C 28 December 1995 Molniya, Russia Mission Completed
6 IRS P3 21 March 1996 PSLV-D3 Mission Completed
7 IRS 1D 29 September 1997 PSLV-C1 Mission Completed
8 IRS P4 (Oceansat-1) 27 May 1999 PSLV-C2 Mission Completed
9 Technology Experiment Satellite(TES) 22 October 2001 PSLV-C3 In Service
10 IRS P6 (Resourcesat-1) 17 October 2003 PSLV-C5 In Service
11 IRS P5 (Cartosat 1) 5 May 2005 PSLV-C6 In Service
12 Cartosat 2 (IRS P7) 10 January 2007 PSLV-C7 In Service
13 Cartosat 2A (IRS P?) 28 April 2008 PSLV-C9 In Service
Copyright to IJIRSET www.ijirset.com 56
15 Oceansat-2 23 September 2009 PSLV-C14 In Service
16 Cartosat-2B 12 July 2010 PSLV-C15 In Service
17 Resourcesat-2 20 April 2011 PSLV-C16 In Service
18 Megha-Tropiques 12 October 2011 PSLV-C18 In Service
19 RISAT-1 26 April 2012 PSLV-C19 In Service
V. CONCLUSION
Planning and managing cities in the new era of globalization and economic liberalization would be a demanding task calling for new skills and approach. Indian cities will have to compete with others to attract investors and, therefore, issues like quality of infrastructure, energy efficient services provision and environmental conditions in a city besides economic stability would play a significant part in such competition. Urban planning profession in general will have to address these issues and respond rapidly. It is worthwhile noting that spatial dynamics of cities is complex to fathom and urban theory is still static. In other words, the urban planning authorities and agencies in every parts of the country should adopt new technologies like remote sensing and GIS. These have capability to provide necessary physical input and intelligence for preparation of basemaps, for planning proposals and act as monitoring tool during implementation phase(s). Satellite remote sensing with repetitive and synoptic viewing capabilities, as well as multispectral capabilities, is a powerful tool for mapping and monitoring the ecological changes in the urban core and in the peripheral land-use planning, will help to reduce unplanned urban sprawl and the associated loss of natural surrounding and biodiversity.
On the other hand, moving further, interfacing of urban planning models with GIS should now receive due attention. Incorporation of land-use transportation models, water distribution network analysis, stimulation of urban activities to evaluate different urban development alternatives in the GIS framework needs to be explored for added advantage.
ACKNOWLEDGEMENT
Mahesh Jhawar ,Nitin Tyagi and Vivek Dasgupta are thankful to their family. They inspired them during their research work. They are also thankful to Mr. H.C. Gupta (HOD- CIVIL Dept.) and Mr. K.S Mishra for their co-ordination and devoting their precious time to them.
At last, constructive criticism and valuable suggestions from readers are welcome.
REFERENCES
[1]Sudhir. H. S., Ramachandra, T.V., and Jagadish, K.S. (2003)
[2]“Urban Sprawl pattern recognition and modelling using GIS,” GIS@development,
Copyright to IJIRSET www.ijirset.com 57
[5][email protected],http://www.gisdeveloment.net/application/urban/oveview/ma03 224.htm, Map Asia conferences 2003, Urban Planning. [6] Patkar, V.N. (2003), “Directions for GIS in Urban Planning”, GIS@development,
http://www.gisdevelopment.net/application/urban/overview/urban0042pf/htm,Map Asia Conferences, Urban Planning. [7]http://www.satimagingcorp.com/galleryimages/ikonos-new -delhi-taj-mahal.jpg
[8]http://media.wiley.com/product_data/excerpt/8X/04707495/047074958X-192.pdf [9]http://www.satimagingcorp.com/characterization-of-satellite-remote-sensing-systems.html [10]http://www.eoearth.org/article/Remote_sensing
[12]http://www.earthzine.org/2011/07/20/remote-sensing-%E2%80%93-an-effective-data-source-for-urban-monitoring/ [13]http://www.sensysmag.com/article/features/13931-remote-sensing-and-urban-planning-a-common-future-.html
[14]http://ieeexplore.ieee.org/xpl/articleDetails.jsp?reload=true&arnumber=1219987&contentType=Conference+Publications [15]http://www.isprs.org/proceedings/XXXVI/8-W27/netzband.pdf
Biography
Mahesh Jhawar born on 3rd of July is presently working as a student. He is pursuing his B.Tech in Civil engineering from University of Petroleum and Energy Studies, Dehradun. He has been in the field of research since the last six months and this is his first research paper. He was recently asked to present this paper at a Tech Fest in IIT-BHU. He has also been the Event head of many events conducted in U.P.E.S.
Nitin Tyagi born on the 4th of September is pursuing his B.Tech in Civil engineering from University of Petroleum and Energy Studies, Dehradun. His research interests lies in water resource and irrigation engineering and also in rural development and planning. He is currently doing a minor project on Light Transmitting Concrete. He is also doing a research on providing structural stability in black cotton soil. He was also the member of the team whose industrial problem got selected in a event conducted at IIT,Kharagpur. His team was among the top ten teams. He has also been the Event head of a number of events conducted at U.P.E.S. Vivek Dasgupta born on the 14th of October is currently working as a student. He is pursuing his B.Tech in Geo Science engineering from University of Petroleum and Energy Studies, Dehradun. He has been in the field of research of since the last six months and this is his first research paper. He was recently asked to present this paper at a Tech Fest in IIT-BHU. He has also presented a Model on Generation of Electricity at U.P.E.S. where he was declared the winner. His research interests lies in Remote Sensing and Petroleum Exploration.