arXiv:astro-ph/0104429v1 26 Apr 2001
Department of Astronomy, University of Wisconsin-Madison, 5534 Sterling, 475 North Charter St., Madison WI 53706, USA
Accepted 2001 April 23.
ABSTRACT
We present high dispersion echelle spectroscopy of the very luminous, young super star cluster (SSC) ‘F’ in M82, obtained with the 4.2-m William Herschel Telescope (WHT), for the purpose of deriving its dynamical mass and assessing whether it will survive to become an old globular cluster. In addition to the stellar lines, the spectrum contains complex NaIabsorption and broad emission lines from the ionized gas. We measure a stellar velocity dispersion of 13.4±0.7 km s−1
, a projected half-light radius of 2.8±0.3 pc from archivalHST/WFPC2 images, and derive a dynamical mass of 1.2±0.1×10⁶
M⊙, demonstrating that M82-F is a very massive, compact cluster. We determine that the current luminosity-to-mass ratio (LV/M)⊙ for M82-F is 45±13. Comparison with spectral synthesis models shows that (LV/M)⊙ is a factor of ∼ 5 higher than that predicted for a standard Kroupa (2001) initial mass function (IMF) at the well-determined age for M82-F of 60±20 Myr. This high value of (LV/M)⊙ indicates a deficit of low mass stars in M82-F; the current mass function (MF) evidently is ‘top-heavy’. We find that a lower mass cutoff of 2–3 M⊙ is required to match the observations for a MF with a slope α= 2.3.Since the cluster apparently lacks long-lived low mass stars, it will not become an old globular cluster, but probably will dissolve at an age of62 Gyr. We also derive up-dated luminosity-to-mass ratios for the younger SSCs NGC 1569A and NGC 1705-1. For the first object, the observations are consistent with a slightly steeper MF (α= 2.5) whereas for NGC 1705-1, the observed ratio requires the MF to be truncated near 2 M⊙ for a slope ofα= 2.3. We discuss the implications of our findings in the context of large scale IMF variations; with the present data the top-heavy MF could reflect a local mass segregation effect during the birth of the cluster. M82-F likely formed in a dense molecular cloud; however, its high radial velocity with respect to the centre of M82 (∼ −175 km s−1
) suggests it is on an eccentric orbit and now far from its birthplace, so the environment of its formation is unknown.
Key words: galaxies: evolution – galaxies: individual (M82) – galaxies: starburst – galaxies: star clusters – galaxies: stellar content
1 INTRODUCTION
M82 is usually considered the prototype of starburst galax-ies since the luminosity and star formation rate of its central star-forming region is comparable to the luminosity of a typ-ical giant spiral galaxy (e.g. Telesco 1988; Lester et al. 1990). Imaging studies at optical and infrared wavelengths have shown that young, compact, luminous star clusters (‘super
⋆ Based in part on observations with the NASA/ESA Hubble
Space Telescope, obtained at the Space Telescope Science Insti-tute, which is operated by the Association of Universities for Re-search in Astronomy (AURA), Inc., under NASA contract NAS 5-26555. Also based on observations obtained with the William Herschel and the WIYN telescopes.
star clusters’ or SSCs) are very numerous in the actively star-forming regions of M82 (O’Connell & Mangano 1978; O’Connell et al. 1995; Satyapal et al. 1995, 1997; de Grijs et al. 2001). M82 provides an excellent and nearby setting in which to study the properties of young SSCs. We adopt a distance to M82 of 3.6 Mpc by assuming that it is at the same distance as M81 (Freedman et al. 1994), consis-tent with the red giant branch tip distance to M82 found by Sakai & Madore (1999).
globular cluster systems may present a problem. While glob-ular star cluster luminosity functions peak atMV ≈ −7.5
(corresponding to M ∼105M⊙; see Harris 1991; Ashman,
Conti & Zepf 1995), the raw luminosity functions of clus-ters spawned in starbursts typically resemble the power law distributions found for open star clusters (e.g. Whitmore et al. 1999; Zhang & Fall 1999), although incompleteness may be an issue (de Grijs, O’Connell & Gallagher 2001). A fur-ther complication can arise in the evolution of populations of star clusters within galaxies. Fritze - v. Alvensleben (1998, 1999) emphasized the possible importance of differential sur-vival rates, which favour dense, massive star clusters, such as compact SSCs, and might transform the power luminos-ity functions of star clusters at birth into those of globular clusters (see also Chernoff & Weinberg 1990; Elmegreen & Efremov 1997; Gnedin & Ostriker 1997). Luminosity func-tion measurements alone for populafunc-tions of star clusters do not resolve this issue.
The questions of masses and densities of SSCs are there-fore critical; do SSCs have the mass densities of globular star clusters? This is a necessary but not a sufficient condition for SSCs to survive for∼10 Gyr time scales to become globular
clusters. Ho & Filippenko (1996a,b) measured stellar veloc-ity dispersions for two SSCs, NGC 1569A and NGC 1705-1, with the HIRES echelle spectrograph on the Keck I 10-m telescope. Combining these data with half-light radii in the literature derived from observations with the Hubble Space Telescope (HST), they found dynamical masses consistent with those of globular clusters. Both of these SSCs are rela-tively bright (V = 14.8 and 14.7, respectively), young (ages of<20 Myr), and in small galaxies with low metallicities.
The recognition that compact SSCs may indeed be proto-globular clusters opens up the possibility of studying their formation conditions, evolution and destruction pro-cesses. One issue of particular interest is whether SSCs have sufficient numbers of low mass stars to remain as bound systems over long time-scales. The slope of the stellar initial mass function (IMF)1
is critical since too high a fraction of high mass stars will cause the cluster to evaporate within a few Gyr due to stellar mass-loss (e.g. Chernoff & Weinberg 1990; Goodwin 1997; Takahashi & Portegies Zwart 2000). It is not obvious whether all young SSCs have ‘normal’ MFs. For example, the best studied Galactic example, NGC 3603, has a normal MF extending down to <1 M⊙ according to
Eisenhauer et al. (1998). The compact young Galactic centre clusters, the Arches and Quintuplet, appear to have remark-ably flat MFs for M>10 M⊙ (Figer et al. 1999), although
they have probably undergone rapid mass segregation (Kim, Morris & Lee 1999) and could even represent the dense cores of dissolved clusters (Gerhard 2001).
In the LMC SSC R136, Massey and Hunter (1998) demonstrated a normal mass function for stars with M >
2.8 M⊙while Sirianni et al. (2000) find that the mass
func-tion flattens below 2 M⊙; the R136 MF could be slightly
1
There is some confusion in the literature over the use of the term ‘IMF’ to describe the observed properties of evolved star clusters. We will use the term ‘IMF’ for the theoretical initial distribution of masses, and the term ‘mass function (MF)’ to refer to the present-day mass distribution of a cluster inferred from observation.
‘top-heavy’ compared to that for LMC field stars. Simi-larly, Sternberg (1998) suggests a deficiency of low mass stars in NGC 1705-1. Spectra of SSCs in the peculiar galaxy NGC 1275 taken with the Keck I telescope show unusually strong H-Balmer lines; Brodie et al. (1998) interpret these as evidence for flat MFs in clusters that are about 350 Myr old.
More generally there has been much debate over the slope of the IMF in starburst galaxies, and particularly, in M82. Rieke et al. (1980) first suggested that the M82 starburst has a deficit of stars below 3 M⊙ on the basis of
its highK band luminosity and relatively small dynamical mass. Rieke et al. (1993) used up-dated models and observa-tional constraints from McLeod et al. (1993) to demonstrate further that the M82 starburst has an MF biased towards more massive stars. Doane & Mathews (1993) also find that the M82 MF must be top-heavy to explain both the high su-pernova rate and low dynamical mass. On the other hand, Satyapal et al. (1995, 1997) derived a smaller value for the extinction-correctedK band luminosity and found that the MF could be consistent with a Salpeter slope.
In a previous paper (Gallagher & Smith 1999; hereafter Paper I), we presented a spectroscopic study of two M82 SSCs, denoted F and L by O’Connell & Mangano (1978). M82-F is one of the most luminous SSCs known (O’Connell et al. 1995) and is located 440 pc south-west of the nucleus. We found that its radial velocity indicated that it could be buried deep within M82 and fortuitously viewed through a hole in the dust layer. Conversely, the nearby cluster M82-L is highly reddened but its radial velocity indicates that it lies near the middle of the M82 disc. Our blue spectrum of M82-F shows mid-B type spectral features and the red spectra of M82-F and M82-L have a strong CaII triplet
and numerous F- and G-type absorption lines. We compared the blue spectrum of M82-F with theoretical model cluster spectra using thePEGASEspectral synthesis code (Fioc &
Rocca-Volmerange 1997), and derived an age of 60±20 Myr.
For M82-L, we find that the similarities in the strength of the CaIItriplet and overall spectral appearance with M82-F suggest a similar age.
the F814W filter. There are also V-band (two 350 s expo-sures in the F555W filter) andB-band (two 400 s exposures in the F439W filter) images available. These images were taken as part of the GO 7446 program (R. W. O’Connell, P.I.) to investigate star clusters and other features of the visible surface of the M82 starburst (see de Grijs et al. 2000, 2001). They were not designed for measurements of bright star clusters such as M82-F, and this introduced some com-plications.
Images of M82-F and M82-L are both on the WFPC2 WF4 CCD, which has an image scale of 0.1 arcsec pixel−1
. We worked from combined pairs of images in each filter, and used standard IRAF2
software to remove cosmic rays (there were no major cosmic ray hits on or near M82-F). The F439W short exposure images are unsaturated and give a true measure of the M82-F brightness profile. Both the F555W and F814W images contain 9 saturated pixels (due to the WFPC2 A/D converter response) in the M82-F clus-ter centre. We corrected these by using the F439W image as a template and replaced the saturated pixels with val-ues scaled from the surrounding regions of the cluster in the F555W and F814W bands. To estimate the error, we arbi-trarily increased the values of all saturated pixels by 30 per cent, and find that this leads to an increase of slightly more than 0.1 magnitudes in the brightness of M82-F in both the F555W and F814W images. The method we have used assumes that there is no radial colour gradient present in M82-F. Any colour changes are expected to be small since typical gradients of at most∼0.1 mag are observed in rich
LMC clusters (Elson, Fall & Freeman 1987). We therefore adopt an error of±0.10 mag for theV andImagnitudes of
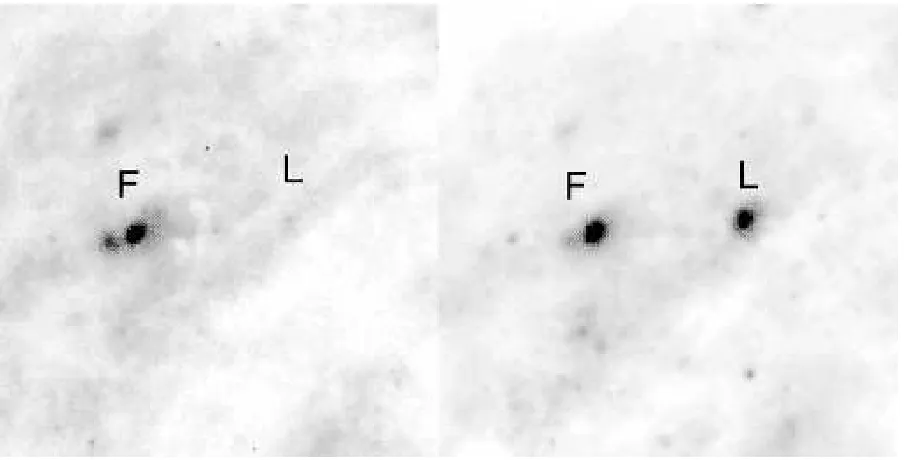
M82-F. The F439W and F814W images of M82-F are shown in Fig. 2. M82-L is very bright in the F814W-band but es-sentially absent in F439W. We also see that M82-F has a companion star cluster at a projected distance of 0.7 arcsec along a position angle of 50◦
.
Aperture photometry was performed on M82-F and its companion. The region of the companion cluster was re-placed with the mean background for the M82-F photom-etry. A circular aperture with a 7 pixel radius was cho-sen for the total magnitude measurement. The background was measured from the centroid of the distribution of pixel brightnesses in an annulus at 12–14 pixels. Magnitudes were transformed to the LandoltBV I system following the pre-cepts of Holtzman et al. (1995). We obtainV = 16.12 and
V −I= 1.51±0.10 (Table 1). Using a smaller aperture of
2
The Image Reduction and Analysis Facility (IRAF) is dis-tributed by the National Optical Astronomy Observatories which is operated by the Association of Universities for Research in Astronomy, Inc. under cooperative agreement with the National Science Foundation. STSDAS is the Space Telescope Science Data Analysis System; its tasks are complementary to those in IRAF.
yielded for the M82-F companion cluster V = 18.4±0.2
andB−V = 0.9±0.3 using a 5 pixel radius circular
aper-ture. Due to the faintness of this object with respect to the galaxy background and proximity of M82-F, we could not obtain reliable photometry from the F814W WFPC2 image. From circular aperture photometry on M82-F, we mea-sure a half-light radius rh(F439W)= 0.22±0.02 arcsec (1
pixel = 0.1 arcsec). The ratio of major to minor axes was determined to be about 1.3 using an ellipse fitting routine in theIRAFsoftware package. This gives a negligible ellip-ticity correction of < 0.01 arcsec for the effective radii of circular apertures used for the photometry. To correct for the effects of blurring of the point-spread-function (PSF) of the WF cameras of WFPC2, we used the simple approach of Phillips et al. (1997) who suggest subtractingrh= 0.15
arc-sec from the observed value in quadrature. This then gives a projected half-light radius ofrh= 0.16 arcsec or 2.8±0.3 pc
for an adopted distance to M82 of 3.6 Mpc. O’Connell et al. (1995) derived dimensions of 9×5 pc or a mean FWHM of
2.8 pc from their deconvolved WFPC images.
The SSC NGC 1705-1 is an important comparison object for M82-F. Short exposure, unsaturated archival WFPC2 images of NGC 1705-1 on the PC are available in the F380W and F439W filters fromHSTprogram GO 7506 (M. Tosi, P.I.). The guiding in these exposures is not good. Images are elongated in both exposures, with the problem being more serious in the F439W than F380W image. These images show an extended halo of luminous stars around NGC 1705-1 and a bright object nearby that is identified as the second brightest cluster in the galaxy by O’Connell et al. (1994).
The half-light radius of NGC 1705-1 is uncertain, with O’Connell et al. (1994) estimating 0.14 arcsec and Meurer et al. (1995) re-deriving 0.04 arcsec from the same WFPC PC data. We therefore measured rh from the F380W archival
WFPC2 image which appears to have the best image qual-ity. Our technique is the same as that used for M82-F. A PSF correction was derived from measurements of stars surround-ing the cluster to be 1.8 WFPC2/PC pixels, or 0.082 arcsec. The measured projected half-light radius for the central star cluster measured from multiple aperture photometry is 2.25 pixels, and thusrh = 0.062±0.01 arcsec. O’Connell et al.
(1994) measured a distance to NGC 1705 of 5.0±2.0 Mpc;
this has been revised recently by Tosi et al. (2001, in prep.) to 5.3±0.8 Mpc from the tip of the red giant branch. We
adopt this new distance and find thatrh= 1.6±0.4 pc.
We also re-measured the total magnitude of NGC 1705-1 from aperture photometry of the 1705-140 s exposure F439W image. The photometry is complicated by the presence of the nearby bright cluster (at a projected distance of 0.9 arcsec) and the extended halo. Aperture photometry with a radius of 25 pixels (= 1.2 arcsec), a reasonable estimate of the max-imum cluster size, givesmF439W= 14.85 with small aperture
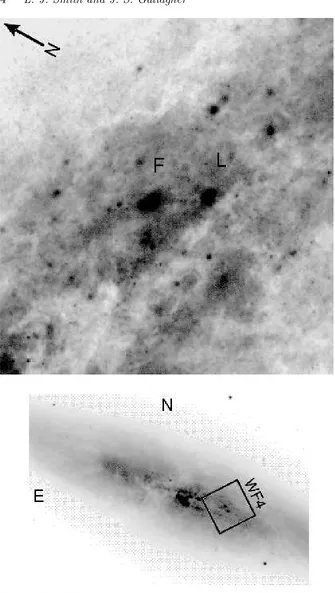
Figure 1. TheseI-band images show the locations of clusters F and L in M82. The lower picture was taken with a CCD camera on the WIYN 3.5-m telescope in≈1 arcsec seeing. The location of the 25×25 arcsec section of the WFPC2 WF4 CCD containing the clusters
Figure 2. Blue (left panel, F439W filter) and red (right panel, F814W filter) WFPC2HSTobservations of an 8 arcsec field around M82 clusters F and L are shown. M82-L is so heavily reddened as to be invisible in the blue, while the companion cluster located to the left and slightly below M82-F is most pronounced in the blue.
Figure 3. Greyscale images are shown for the individual orders of echelle spectra from the first night of WHT observations. The major emission lines are marked, where we have chosen the stronger of the [NII] and [SII] doublets. A heliocentric velocity scale is plotted above the spectra, and the location of M82-F along the 6 arcsec slit in each echelle spectral order and in radial velocity is marked with arrows.
has B−V ≈0, in which casemF439W ≈ B = 14.9±0.1,
where the error range includes a provision for transforma-tion problems (see Holtzman et al. 1995). Aperture pho-tometry to 50 pixels with the companion cluster subtracted gives B = 14.75±0.1. This value agrees well with the
value of V = 14.7 reported by O’Connell et al. (1994) for NGC 1705-1 for a 3.4 arcsec radius aperture. We adopt
B=V = 14.9±0.1 for NGC 1705-1.
2.2 Spectra
M82-F was observed with the Utrecht echelle spectrograph (UES) at the Nasmyth focus of the WHT on 1999 Febru-ary 26 and 27. The 31.6 grooves mm−1
echelle grating was used with a 2048×2048 SITe CCD to record the wavelength
pix-els) to ensure no overlap between adjacent orders while still providing a reasonable sample of the background. The slit was kept at a position angle of 139◦
throughout the observa-tions. A slit width of 1.3 arcsec was used which projected to 2.3 detector pixels on the detector (as measured from ThAr comparison arc lines), giving a resolving power of 45 000. The total integration time over the two nights was 23 200 s in seeing conditions of 0.8–1 arcsec. In addition, two atmo-spheric standards and eight template stars were observed ranging in spectral type from A7 III to M2 Iab.
The echelle data were reduced using the FIGARO
software package (Shortridge et al. 1997). Each frame was cleaned of cosmic rays, bias corrected and divided by a nor-malized flat field. The individual orders were next extracted for the object and two adjacent background regions (sky + galaxy) and wavelength calibrated. The orders were then background-subtracted, binned to 4 km s−1
wide intervals, and co-added. Finally the orders were merged in the over-lap regions and normalized to unity using spline fits. The final spectrum of M82-F has a resolution of 8 km s−1
and a signal-to-noise per pixel of 15–25. The template spectra were reduced in exactly the same manner.
3 INTERSTELLAR MEDIUM
3.1 Ionized Gas
To investigate the dynamics of the ionized gas in the line of sight to M82-F, we simply took the median of the echel-lograms obtained on the first night since this night had the best seeing conditions. The resulting image is shown in Fig. 3 in the region of the Hα, [NII] and [SII] emission lines. All
these emission lines show an identical dynamical structure. Examining the line profiles along the 6 arcsec slit (= 18 pix-els), we find that there are at least three components present at +50, +120 and +180 km s−1
with an overall FWHM of
∼120 km s−1. The peak of the CO rotation curve lies
be-tween the 120 km s−1
and 50 km s−1
emission components (Shen & Lo 1995). The heliocentric radial velocity of M82-F is measured to be +24 km s−1
from the CaII triplet lines,
in good agreement with the value of +35 km s−1
obtained in Paper I.
The first two velocity components are resolved in the first three spatial pixels but appear to merge to produce two components at +124 and +180 km s−1
at the position of M82-F on the slit (Fig. 3). The strongest component at +124 km s−1
then weakens and the last three spatial pixels show an unresolved broad (FWHM = 135 km s−1
) emis-sion feature at +137 km s−1
. In Paper I we found that the same emission lines are split into two components at +114 and +181 km s−1
with the lower velocity component occur-ring along the sight line between M82-F and M82-L. The positions angles used in the two sets of observations are quite different: 139◦ for the UES and 20◦ for the
observa-tions in Paper I. In this region of M82 the CO emission ex-tends over≈150 km s−1
and shows a pronounced extension towards low radial velocities that also is seen in radio H-recombination lines (e.g. Seaquist et al. 1996). We conclude that no association exists between ionized gas and M82-F; this is not surprising given the age and high orbital velocity of the cluster (see Sect. 7.3).
Figure 4.Portion of the WHT+UES spectrum of M82-F showing the region of the interstellar NaID lines. The velocity scale is heliocentric and the spectra are normalized. The velocities of the resolved components are indicated. The strong narrow feature at
−16 km s−1 is due to interstellar absorption in the Milky Way. The radial velocity of M82-F is also indicated.
3.2 Neutral Sodium Absorption
Figure 4 shows the NaI D1 and D2 absorption line profiles
observed towards M82-F. The presence of multiple sharp components in the D1line demonstrates that this feature is
due to intervening interstellar gas rather than stellar pho-tospheres as assumed in some previous studies (e.g. Sait¯o et al. 1984; G¨otz et al. 1990). The individual components can be seen more clearly in the D1line, indicating that
op-tical depth variations are occurring between the D1 and D2
lines; these features are formed in low column density neu-tral gas in M82. The heliocentric centroid velocity of about 190 km s−1
agrees with the NaIabsorption radial velocities
in Paper I.
With the resolution of the echelle, we see that these lines extend from approximately 115 to 240 km s−1
at a location in M82 where the rotation peak is blueshifted to
∼80 km s−1
(see Sect. 3.1). Adopting a systemic velocity of 200±10 km s−1
and a rotational velocity amplitude of
≈100 km s−1 for M82 (Yun, Ho & Lo 1993; Achtermann
& Lacy 1995), we see that absorbing gas in circular orbits within the disc must lie in the approximate velocity range of 100 km s−1
< Vc <200 km s−1 i.e. between the rotation
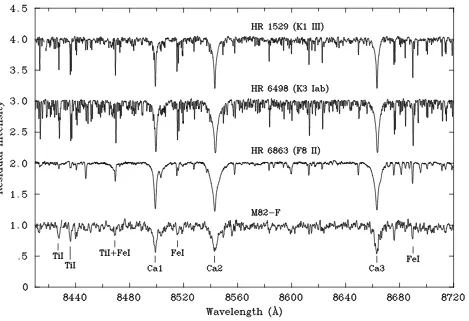
ve-Figure 5.WHT+UES spectra covering the CaII triplet region at a resolution of 8 km s−1
for M82-F and the three template stars which show the closest spectral match. The spectra have been normalized and shifted in velocity space to match the radial velocity of M82-F, and the M82-F spectrum has been lightly smoothed for presentation purposes. Absorption features due to the CaII triplet and FeIand
TiIare indicated.
locity are forbidden for circular rotation. This gas could be associated with infalling tidal debris or gas outflow from M82, although the HI map of Yun et al. (1993) suggests
that most of the gas near M82-F has a velocity of less than 150 km s−1
.
On the other hand, the CO 1-0 maps of Shen & Lo (1995) and Sofue et al. (1992) show a large redward velocity extent to the south-west of the nucleus that becomes more pronounced above the galaxy’s midplane. Since M82 is seen nearly edge on, the location of M82-F with respect to the mid-plane is uncertain, and we could be sampling some of this gas. Shen & Lo (1995) propose that the high veloc-ity dispersion molecular emission originates in spiral arms where previous starburst activity disrupted the interstellar medium. High angular resolution maps of gas kinematics in the outer disc of M82 would be very useful in disentangling the multiple interactions in this peculiar system.
4 PARAMETERS OF M82-F
The wavelength region of the UES observations (5760– 9140 ˚A) was chosen because, as discussed by Ho & Filip-penko (1996a,b), and demonstrated by our intermediate dis-persion spectra of M82-F (Paper I), the spectral region long-ward of 5000 ˚A is dominated by the light of cool evolved stars. Thus by cross-correlating the cluster spectrum with a
suitable template spectrum, it is possible to recover the line-of-sight velocity dispersion of the cluster, and hence derive its dynamical mass by application of the virial theorem.
4.1 The Velocity Dispersion
The spectrum of M82-F was compared with the spectra of the eight template stars to find the best match in spectral type. In Fig. 5, we show the region containing the CaII
triplet for M82-F and the closest three template stars: HR 6863 (F8 II), HR 1529 (K1 III) and HR 6498 (K3 Iab). The metal lines in this wavelength region are mainly due to FeI
and TiI. Comparison of the ratios of the strengths of these
lines to the CaIItriplet lines shows that the closest spectral
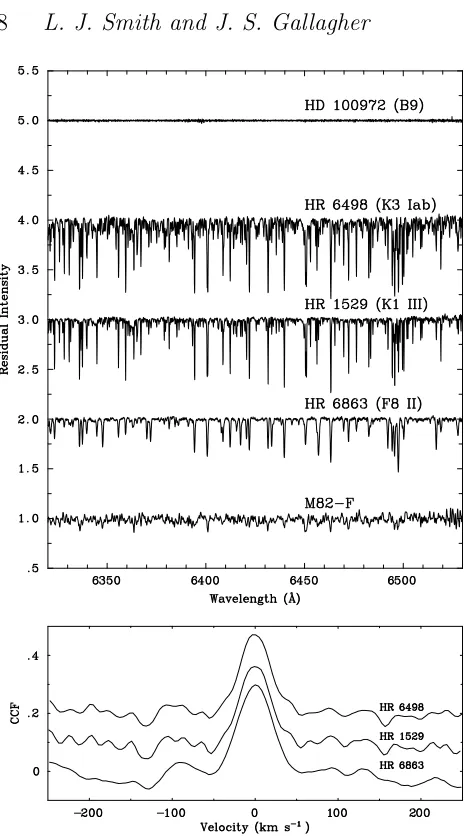
match is to the two K stars. We have used these three stars as templates and cross-correlated their spectra with that of M82-F. We chose four spectral regions which are free of telluric absorption lines: 6010–6275 ˚A, 6320–6530 ˚A, 7340– 7590 ˚A, and 7705–8132 ˚A for the analysis. All these regions gave a strong cross-correlation signal; an example is shown in Fig. 6 where we also show the spectrum of an atmospheric standard. We ignored the region containing the CaIItriplet
because these lines are saturated in the template spectra and broad Paschen absorption lines from early-type stars are present in the M82-F spectrum.
Figure 6.Top panel: Comparison of the normalized spectra of M82-F and the three template stars for one of the wavelength regions used for the cross-correlation. The spectrum of the B9 at-mospheric standard is also shown to demonstrate the absence of telluric features. Again the spectra have been shifted to match the velocity of the cluster, and that of M82-F is lightly smoothed for presentation purposes.Bottom Panel:The cross-correlation func-tions (CCFs) between the cluster and the three template stars. The velocity dispersion of M82-F can be derived from the FWHM of the CCF.
Gaussian profiles using least-squares to obtain the FWHMs. The relationship between the FWHM and the velocity dis-persion was empirically calibrated by broadening the tem-plate spectra with Gaussians of different velocity dispersions and cross-correlating with the original spectra. We find that relative to HR 6863 (F8 II), HR 1529 (K1 III) and HR 6498 (K3 Iab), the velocity dispersion of M82-F is 13.4±0.7,
15.4±1.6 and 15.3±1.5 km s−1
respectively, where the er-rors represent the 1σ dispersion on the mean. The values derived using the F and K template spectra are different be-cause the intrinsic photospheric absorption line widths are smaller in the two K stars. It is surprising to find that the K3 Iab star in our sample has the same line widths as the K1 giant, suggesting the K3 star may be wrongly classified in terms of its luminosity. The velocity dispersions derived
from cross-correlating the two K stars (HR 1529 and 6498) with the F8 bright giant are 8.8±0.6 and 8.7±0.3 km s−1
respectively, and are entirely consistent with the differences in the cluster velocity dispersions found from the various template stars.
To choose the appropriate velocity dispersion value for M82-F, we need to determine which template star provides the best spectral/luminosity match and consider the effects of macroturbulent broadening in the atmospheres of cool evolved stars. In bright giants macroturbulence is the dom-inant factor in setting weaker stellar absorption line profile widths, and this depends primarily on luminosity class for cooler stars. As discussed above, the closest spectral match is to the two K stars. Inspection of the Starburst99 code (Lei-therer et al. 1999) shows that K II stars dominate the UES wavelength region at an age of 60 Myr (Paper I). We thus choose the F8 II template star since Gray & Toner (1986) show that the macroturbulent broadening in F5–K4 lumi-nosity class II bright giants is very similar with a mean value of 7.2±1.5 km s−1
, while the K III stars have sharper lines, in agreement with our results.
We therefore adopt a velocity dispersion σ of 13.4±
0.7 km s−1
for M82-F.M82-F has a sufficiently large stellar velocity dispersion to be a proto-globular cluster.
4.2 The Dynamical Mass
The mass of M82-F can be obtained from the virial theorem since the average stellar crossing time of ≈ 4×10⁵ yr is
much less than the cluster age, and thus the cluster should be near virial equilibrium. The virial massM is given by
M= 7.5σ
2 rm G
where it is assumed that the cluster is spherical with an isotropic velocity distribution such that σ represents the one-dimensional rms velocity dispersion along the line-of-sight (Spitzer 1987). With the radius expressed in terms of the half-mass radius rm (rather than the gravitational
ra-dius), the constant of proportionality is 7.5 (see e.g. the re-view of Gerhard 2000). Further assuming that the half-light radius derived from the WFPC2 image (Sect. 2.1) repre-sents the projected half-mass radius and takingrm= 4/3rh
(Spitzer 1987), we derive a mass of 1.2±0.1×10⁶M⊙,
and a mass density within the half-mass radius of 6.4±
0.9 × 10³M⊙pc−3
. M82-F is clearly a very massive young cluster that might become a globular cluster.
4.3 The Luminosity-to-Mass Ratio
One of the most important parameters to derive when con-sidering whether M82-F will survive to become an old glob-ular cluster is the luminosity-to-mass ratio (LV/M)⊙ (see
discussion in Sect. 1). This tells us if a cluster has suffi-cient mass in the form of lower luminosity, long-lived stars to avoid possible dynamical disruption. To determine this ratio we require the absolute magnitude and thus the red-dening towards M82-F. O’Connell & Mangano (1978) esti-matedE(B−V)≈1.0. In Paper I, we estimated a reddening
of∼1.5 by comparing the theoretical flux distribution of a
(V −Ic) 1.54±0.10 Radial velocityVr +24.3±1.7 km s−1 Velocity dispersionσ 13.4±0.7 km s−1 MassM 1.2±0.1×10⁶
M⊙
Densityρ 6.4±0.9×10³
M⊙pc−3
E(B−V) 0.9±0.1
MV −14.5±0.3
LogLV/L⊙ 7.73±0.12
(LV/M)⊙ 45±13
not correct the data in the near-UV. We now realise that this disparity is partially due to contamination from the close companion at the bluest wavelengths since this cluster was in the slit.
We are now able to obtain an accurate value for the reddening towards M82-F by comparing the WFPC2 (B−V)
and (V −I) observed colours with the colours predicted for
a 60 Myr old cluster. From the spectral synthesis models, Starburst99 (Leitherer et al. 1999) and PEGASE(Fioc & Rocca-Volmerange 1997), we derive E(B−V) = 0.86 and
0.82 using the observed (V−I) colour given in Table 1, and
correcting for the different photometric systems used in the two synthesis models. From the observed (B−V) colour, we
obtainE(B−V) = 1.11 and thus adopt a reddening towards
M82-F of 0.9±0.1 where the error reflects the range in the
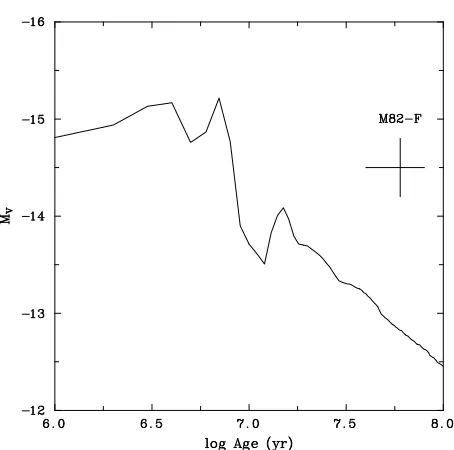
reddening derived from the different photometric indices. In Table 1, we list all the parameters derived for M82-F. Using these values, we obtain MV =−14.5±0.3, and a
luminosity-to-mass ratio (LV/M)⊙= 45±13. In Fig. 7, the
predicted variation ofMV with age is shown for a cluster of
the same mass as M82-F at 60 Myr with a standard IMF where the slope is flatter below 0.5 M⊙. We have adopted the
parameterisation of Kroupa (2001):α= 1.3 for masses in the range 0.16M <0.5M⊙andα= 2.3 forM >0.5 M⊙. We
used the Starburst99 population synthesis code (Leitherer et al. 1999) with lower and upper mass limits equivalent to 0.1 and 100 M⊙. Mass-loss due to stellar winds and supernovae
are accounted for using the mass-loss rates of the Geneva models and assuming that stars more massive than 8M⊙
explode as supernovae and leave 1.4M⊙remnants.
It is clear that M82-F is too bright for its age by
≈ 1.7 mag (a factor of 5). A standard IMF would give
an acceptable fit to the measured (LV/M)⊙ only if
M82-F was near the peak of its optical luminosity, with an age of ∼8 Myr. We thus find that our derived parameters for
M82-F strongly suggest an abnormal MF. We now review the likely sources of error and their impacts on our derived parameters for M82-F before discussing this result. The con-siderable discrepancy shown in Fig. 7 indicates that we are looking for large factors in the uncertainties.
Figure 7.The absolute magnitude MV plotted as a function
of age for a cluster of the same mass as M82-F at 60 Myr for solar metallicity, a Kroupa (2001) IMF (α= 1.3 for masses in the range 0.16M <0.5M⊙andα= 2.3 forM >0.5 M⊙), lower
and upper mass limits of 0.1 and 100 M⊙, calculated using the
Starburst99 code (Leitherer et al. 1999). The derivedMV and
age for M82-F are plotted. It is clearly too bright for its age by
∼1.7 mag, indicating that the IMF as shown is not appropriate
for this cluster.
5 UNCERTAINTIES
5.1 Age
The age of M82-F is probably the most critical parameter since if it substantially younger than 60 Myr old, then this will reduce the discrepancy we have found. We have there-fore carried out a careful re-analysis of the age of M82-F as follows. In Paper I, we determined an age for M82-F by com-paring the observed blue spectrum from 3510–5000 ˚A with model cluster spectra generated from thePEGASEspectral synthesis code (Fioc & Rocca-Volmerange 1997). We used the Jacoby et al. (1984) spectral library, the ‘Geneva’ stellar evolutionary tracks and a Salpeter IMF. By matching the depth of the Balmer absorption lines and the Balmer jump, an age of 60±20 Myr was determined. We noted that the
spectral library of Jacoby et al. had lower resolution and often inferior signal-to-noise to the WHT+ISIS spectrum of cluster F. Since Paper I, a new synthetic library has become available for the H Balmer and HeI absorption lines with a sampling of 0.3 ˚A (Gonz´alez Delgado & Leitherer 1999). Using this new dataset we have re-visited the age of M82-F by performing a detailed line profile comparison for the H Balmer series and the HeIlines.
We used the output of the evolutionary synthesis code Starburst99 (Leitherer et al. 1999) for an instantaneous burst and a Salpeter IMF with upper and lower mass cutoffs of 1 and 80 M⊙at solar metallicity. Gonz´alez Delgado,
Figure 8.The observed Hδand HeIλ4922 line profiles for
M82-F compared with synthetic profiles from the population synthesis models of Gonz´alez Delgado et al. (1999) for ages of 20, 60 and 100 Myr. The M82-F data were obtained with the WHT+ISIS and were presented in Paper I. The synthetic data have been binned to match the 1.6 ˚A resolution of the M82-F data and all spectra have been smoothed usingσ= 1.0 ˚A. An age of 60±20 Myr is
obtained from the best fits to the wings of the Hδline profile (the core is affected by nebular emission) and the absorption depth of HeIλ4922.
an age of 100 Myr. They also investigate the sensitivity of the Balmer lines to changes in the IMF parameters and find that a flatter IMF produces weaker Balmer features only for the first 4 Myr because of the greater proportion of O stars on the main sequence.
To compare observed and synthetic profiles, the M82-F spectrum was smoothed (σ = 1.0 ˚A) and pseudo-continua were fitted to the Hβ–H13 and HeI profiles using the
windows defined in Gonz´alez Delgado & Leitherer (1999). The synthetic spectra were treated in the same way and smoothed and binned to match the resolution of the M82-F spectrum. The observed and synthetic line profiles for Hδ
and HeI λ4922 are shown in Fig. 8 for ages of 20, 60 and
100 Myr. Since the cores of the lower members of the Balmer lines are affected by nebular emission, we use fits to the line profile wings as the main age discriminator. It can be seen that the 20 Myr H line profiles are too narrow and that HeI
λ4922 is too strong. Conversely, at 100 Myr, the H lines are too broad and HeI is too weak. We thus confirm the age
determined in Paper I of 60±20 Myr.
Most importantly, M82-F cannot be as young as the age of ∼ 8 Myr required for agreement between the predicted
and observed MV shown in Fig. 7. At this age, RSGs will
dominate but no molecular bands are detected (Paper I; cf. Bica, Santos & Alloin 1990; Schiavon, Barbuy & Bruzual 2000). The predicted (V −I) colour at 8 Myr gives a low
E(B−V) = 0.4 in contradiction to the (B−V) colour,
indicating that M82-F cannot have the colours of a starburst dominated by RSGs. If M82-F was as young as 4 Myr then we would expect to see Wolf-Rayet features in the spectra but these are clearly absent (Paper I).
5.2 Luminosity and Radius
M82-F is observed on a complicated background, as shown in Figs. 1 and 2. We have measured this ‘background’ relatively far from the cluster, and so could have made the cluster too bright. However, a 50 per cent increase in the background only decreases the observedV by 0.1 mag. Furthermore, it seems equally likely that we could have underestimated the luminosity by not including light outside of our 0.7 arcsec radius aperture.
The measurements of the half-light radius are reason-ably robust, and will only change slightly even if a moderate amount of luminosity has been missed. A key assumption here is that the half-light radius is the same as the pro-jected half-mass radius. This cluster appears to be too young to have experienced significant dynamical mass segregation since the half-mass relaxation time (Spitzer & Hart 1971) is
≈2 Gyr giving a mass segregation time scale of≈160 Myr
for stars with masses near the main sequence turn-off at the age of M82-F. Massive stars could, however, be cen-trally concentrated in M82-F due to processes at birth or associated with early evolution (see discussion in Sect. 7.2). Our procedure to correct saturated pixels could have fur-ther exacerbated this effect if it exists. If massive stars are extremely centrally concentrated in M82-F, we could have underestimatedrhand therefore the mass.
5.3 Extinction
The range of possible interstellar obscurations remains a ma-jor source of uncertainty. The combination of spectropho-tometry in Paper I and results presented here suggest that the colour excess is unlikely to beE(B−V)<0.8.
Further-more if we are not in the pure interstellar extinction case, then the absorption will be larger at a fixed colour excess (e.g. Calzetti, Kinney & Storchi-Bergmann 1994). The best way to remove this as an issue would be to obtain high an-gular resolution infraredK-band images which would mini-mize the effects of interstellar obscuration. For the present it seems more likely that we have, if anything, underestimated the amount of visual obscuration towards M82-F.
We must also consider that we have used the predic-tions of stellar synthesis codes to provide the intrinsic colour. These were based on a Salpeter IMF with upper and lower mass cutoffs of 0.1 and 120 M⊙. For a flatter IMF with
α= 1.5, the predicted (B−V) and (V−I) colours differ by
less than 0.1 mag at an age of 60 Myr.
5.4 Distance
cross-correlation function of M82-F with an F8 II template star. If instead, we had chosen a velocity dispersion value given by one of the narrower-lined template stars, this would increase the dispersion by a maximum amount of 15 per cent, and the mass estimate by 30 per cent.
5.6 Metallicity
We have assumed that the metallicity of M82-F is solar. McLeod et al. (1993) summarise and discuss the metallic-ity of M82. They conclude that the present-day interstellar medium has solar or slightly greater than solar metallicity.
5.7 Mass Model
In Sect. 4.2 we followed the approach adopted by earlier studies in using the virial theorem applied at the half-mass radius to calculate the dynamical mass (e.g., Ho & Filip-penko 1996a,b). However, other dynamical models for star clusters yield different masses. For example, Dubath & Grill-mair (1997) derived masses for globular star clusters in M31 from integrated velocity dispersions using both King models and the virial theorem. They find King models yield masses that are 60-80% of those derived from the virial theorem applied to the same globular star clusters. That this effect is possible can be seen from the form of the Jeans equation (e.g., Binney & Tremaine 1987), which also could allow our virial mass to be an underestimate in some cases.
We have also assumed that M82-F is spherical with an isotropic velocity distibution, but the real shape is elliptical (see Fig. 2). We can estimate the effect of an anisotropic ve-locity distribution on the dynamical mass by assuming that we are viewing the cluster along one long axis. In this case, we are likely to be overestimating the mass by about 30 per cent since we have overestimated the internal energy. We therefore conclude that our mass estimate could be uncer-tain by a factor of (up to)±50% if M82-F has a dynamical
structure similar to that of globular star clusters.
In summary, we conclude that our errors appear to pro-vide a reasonable assessment of the uncertainties as they are currently understood. There is no clear path that would lead to a mass increase by a factor of several. The largest re-maining ambiguity is with interstellar obscuration, and this should be removed by future IR photometry.
6 PARAMETERS OF SSCS NGC 1569A AND
NGC 1705-1
Stellar velocity dispersions have been measured by Ho & Filippenko (1996a,b) for the young SSCs NGC 1569A and NGC 1705-1. Sternberg (1998) derived their luminosity-to-mass ratios using revised parameters and found that NGC 1705-1 could have a top-heavy MF while NGC 1569A has
Metallicity (Z⊙) 0.20c 0.45d 1.0e
MV (mag) −14.0±0.4a −13.8±0.4 −14.5±0.3
rh(pc) 2.3±0.3a 1.6±0.4 2.8±0.3
σ(km s−1
) 15.7±1.5f 11.4±1.5g 13.4±0.7
Mass (×106
M⊙) 1.3±0.2 0.48±0.12 1.2±0.1
(LV/M)⊙ 26±11 60±24 45±13
aHunter et al. (2000); bHeckmann & Leitherer (1997); cKobulnicky & Skillman (1997);dDevost, Roy & Drissen (1997); eMcLeod et al. (1993);fHo & Filippenko (1996a);gHo &
Filip-penko (1996b)
a steep MF with a slope of ∼ 2.5. Since this study, the
structural characteristics of the two SSCs have been further updated, and we have therefore re-derived their luminosities and masses for comparison with M82-F, as shown in Table 2. The two nearest SSCs, NGC 3603 in the Galaxy and R136a in the LMC, do not have velocity dispersion measurements and therefore cannot be compared directly with our results for M82-F.
6.1 NGC 1569A
The star clusters in the nearby starburst galaxy NGC 1569 have been studied most recently by Hunter et al. (2000) using newHSTWFPC2 data. We will use their parameters, adopting a distance to NGC 1569 of 2.5 Mpc (O’Connell et al. 1994). O’Connell et al. (1994) first noted that NGC 1569A has two peaks in its light distribution from WFPC images, suggesting it may consist of two sub-clusters A1 and A2. This was later verified by De Marchi et al. (1997) using WFPC2 data. Gonz´alez Delgado et al. (1997) suggested that the two sub-clusters have different ages of 3 and 9 Myr on the basis of Wolf-Rayet (WR) and red supergiant (RSG) features detected in ground-based spectroscopy.
Hunter et al. (2000) performed a careful analysis of the structure of NGC 1569A and find that the two components have similar colours, with A2 being fainter than A1 by 1.7 mag in the F555W filter. They suggest that there is no con-tradiction in the presence of both WR and RSG stars at the same age in a low metallicity environment, or alterna-tively that there may be a small age spread of several Myr in NGC 1569A. We therefore adopt an age for this clus-ter of 4–10 Myr, and assume that the velocity dispersion measurement of Ho & Filippenko (1996a) represents the en-tire cluster. We derive a mass of 1.3±0.2×10⁶ M⊙ and
(LV/M)⊙= 26±11. The uncertainties were determined
us-ing the errors given in Table 2, where the error onMV is
6.2 NGC 1705-1
NGC 1705 is a nearby dwarf galaxy which is dominated by a single super star cluster, NGC 1705-1. The main observa-tional uncertainties in previous mass derivations for NGC 1705-1 have been the half-light radius and the distance. As discussed in Sect. 2.1, measurements based on WFPC data have ranged from 0.9–3.4 pc for a distance of 5.0±2.0 Mpc
(Meurer et al. 1995; O’Connell et al. 1994). Using archival WFPC2 images, we deriverh = 1.6±0.4 pc, using a new
distance estimate of 5.3±0.8 Mpc (Tosi et al. 2001, in
prep.) With the velocity dispersion determined by Ho & Filippenko (1996b), we derive a mass of 4.8±1.2×10⁵ M⊙
and (LV/M)⊙= 60±24, withV = 14.9±0.1 (Sect. 2.1).
7 DISCUSSION
7.1 The Top-Heavy MF
In Table 2, we list the parameters of NGC 1569A, NGC 1705-1 and M82-F. The absolute magnitude and mass of M82-F are similar to NGC 1569A but M82-F is a factor of 3–6 times older and thus it is exceptionally bright. Stern-berg (1998) derived (LV/M)⊙ = 29 for NGC 1569A and
found by comparison with population synthesis models that this cluster has a steep MF (α ∼ 2.5) and will probably
evolve to a globular cluster-type object. Conversely, he de-rived (LV/M)⊙= 126 for NGC 1705-1 and found that the
MF is either flat (α <2) or truncated between 1–3 M⊙,
im-plying that this cluster will not survive. While the (LV/M)⊙
we derive for NGC 1569A is identical within the errors to the Sternberg value, the revised value for NGC 1705-1 is a factor of∼2 lower.
To investigate the form of the mass function for M82-F and the two other SSCs, we have calculated (LV/M)⊙ as
a function of age for various IMF parameterisations with the Starburst99 code. Spectral synthesis codes usually make the unrealistic assumption that the mass-loss due to stellar evolution remains in the cluster. In calculating (LV/M)⊙,
we have therefore allowed for a decreasing cluster mass by subtracting the stellar ejecta at each time step.
We adopt the parameterisation of Kroupa (2001) to rep-resent our IMF model: α = 1.3 for masses in the range 0.16M <0.5 M⊙ andα= 2.3 forM > 0.5 M⊙ with an
upper mass limit mu = 100 M⊙, and lower mass limits in
the rangeml=0.1–3 M⊙. These models are shown in Fig. 9.
It is clear that there is a fundamental mismatch by a factor of ∼5 between the derived (LV/M)⊙for M82-F and that
predicted by a ‘simple stellar population’ (SSP) model with a standard Kroupa (2001) IMF withml= 0.1 M⊙.
Both NGC 1569A and NGC 1705-1 have metallicities below solar (Table 2). We have investigated the effect of a lower metallicity on (LV/M)⊙by running the Starburst99
code for Z = 0.2 and 0.4Z⊙. We find that the difference
in (LV/M)⊙is well within the observational errors because
at lower metallicities and young ages, the luminosity is in-creased but the mass loss rate is lower. Sternberg (1998) finds that NGC 1569A has a steep MF withα∼2.5,
extend-ing to 0.1 M⊙. This is confirmed in Fig. 9 where we show
(LV/M)⊙as a function of time for the Sternberg (1998) IMF
parameters. For NGC 1705-1, Sternberg (1998) finds that the MF is either flat or truncated. Our revised (LV/M)⊙for
Figure 9.(LV/M)⊙plotted as a function of age using the
Star-burst99 code (Leitherer et al. 1999) taking into account mass-loss due to stellar evolution. The solid curves shown are for solar metallicity, an IMF parameterised byα = 1.3 for 0.1 6M < 0.5M⊙andα= 2.3 forM >0.5 M⊙, an upper mass cut-off of
100 M⊙, and lower mass cut-offs of 0.1, 1.0, 2.0 and 3.0 M⊙. The
derived (LV/M)⊙ and age values for M82-F, NGC 1569A and
NGC 1705-1 are plotted. The dotted curve is for solar metallicity, a single slopeα= 2.5, and lower and upper mass cut-offs of 0.1 and 100 M⊙.
this cluster is lower by a factor of 2 but it still lies well above the IMF curve extending down to ml = 0.1 M⊙ (Fig. 9),
indicating that NGC 1705-1 probably has a truncated MF withml≈1–3 M⊙.
The high visual luminosity-to-mass ratio that we have derived for M82-F indicates that this SSC has an abnormal MF with a minor fraction of its stellar mass concentrated in long-lived, low mass stars. To explore this possibility, we change the mass distribution by raising the lower cut-off mass in the SSP models until we fit the observed (LV/M)⊙
ratio for M82-F. As shown in Fig. 9, we needml=2–3 M⊙.
A similar lower mass range is indicated for a flatter IMF with a slope of 2.0. This exercise then implies a ‘top-heavy’ MF where most of the stellar mass is in stars with M>2 M⊙
in the tightly gravitationally bound regions of the cluster. This conclusion merits careful examination; previous claims for highly abnormal MFs often have proven incor-rect. Scalo (1998) summarized the evidence for variations in the IMF. A key point from Scalo’s review is that most docu-mented IMF variations seem to occur within individual star-forming regions. On large scales, the present-day IMF seems to be remarkably constant (e.g. Kroupa 2001), and this trend appears to extend to the MFs of the nearby SSCs NGC 3603 and R136a (see discussion in Sect. 1). Thus it is not clear whether M82-F represents a high- and intermediate-mass star-enriched core of a larger star-forming complex, within which the overall MF is relatively normal (see Sect. 7.2).
erate mass (∼10 M⊙ ) systems have peculiarly flat MFs
for M>10 M⊙. They attribute this behaviour to the strong
tidal field near the Galactic centre that could inhibit the formation of lower mass stars.
Or is M82-F an example of an abnormal mode of star formation of the type suggested from Kroupa’s (2001) anayl-sis of Galactic globular clusters? With respect to this point, we can see from Fig. 9 that an SSP model with a single IMF is unlikely to fit all three SSCs with mass determinations. A larger sample of SSCs with mass and size determinations is needed to resolve properly this issue. Until we do so it is premature to generalize our result to the overall pattern of star formation in M82.
7.2 Formation and Mass Segregation
Tightly bound star clusters are now widely recognized to be products of locally efficient star formation; typically half or more of the gas in the initial cloud’s densest region must be converted into stars to yield these types of objects (e.g. Goodwin 1997). M82-F must have originated in a molecular cloud core with a density ofn∼105 cm−3
and a very high pressure (Elmegreen & Efremov 1997). The discussion of these points by Ho and Filippenko (1996b) on the connection between massive SSCs and ultra-dense molecular clouds in M82 is borne out by our observations.
The high peculiar velocity of M82-F then is interest-ing. At present neither dense molecular gas nor HII
emis-sion are found at the cluster’s velocity, blueshifted by almost 170 km s−1
with respect to the centroid of M82. The cluster evidently has had time to completely separate itself from any natal gas. This is consistent with our finding that the cluster is old enough to have made more than one revolu-tion about the centre of M82; it is now well-removed from its birthplace and faces an uncertain future.
As discussed in Sect. 5.2, M82-F is too young to have ex-perienced significant dynamical mass segregation. Some star clusters, however, seem to have been born with their massive stars centrally concentrated. The Orion nebula cluster sets an example of this phenomenon; massive stars are centrally located but the cluster is far too young for two-body relax-ation to have played a role (Hillenbrand & Hartmann 1998). Another example, NGC 2098 in the LMC, has a similar age to M82-F, and shows some signs of mass segregation (Konti-zas et al. 1998). Fischer et al. (1998) reach a similar conclu-sion for the 100 Myr old LMC star cluster NGC 2157. Thus, if mass-segregation is playing a significant role in M82-F, it must have been present at birth.
M82-F should therefore have an extended halo of low mass stars if primordial mass segregation has occurred. To test for this possibility, we take an extreme model where the velocity dispersion is the same and assume that low mass stars affect the mass and not the luminosity. The half-light radius has then to increase by a factor of 5 to 14 pc for
centre clusters (Gerhard 2001). While M82-F does have a pe-culiar orbit, it seems unlikely that it could have been born in a location with large tidal stresses because such an envi-ronment is not obviously present in M82. The data for the two younger SSCs NGC 1569A and 1705-1 are inconclusive. The former cluster appears to have a normal MF while the latter has a truncated MF yet both clusters reside in the inner parts of their galaxies.
We conclude that while mass segregation at birth may have occurred in M82-F, the current observational evidence favours the view that the IMF of M82-F was abnormal in being deficient in low mass stars. Future spatially-resolved spectroscopy of M82-F is needed to investigate the signifi-cance of mass segregation.
7.3 Long Term Survival?
Predicting the lifetime of a star cluster is difficult. The sim-plest model assumes a cluster is in virial equilibrium and therefore must expand in response to any mass loss. In the case of M82-F this will be dominated by effects due to stellar evolution. At the age of M82-F, the SSP models with lower mass cut-offs of 2 and 3 M⊙, show that 49 and 60 per cent
of the original mass has been ejected. Therefore, the cluster should soon have too little mass to remain bound with a constant stellar velocity dispersion; i.e. it will reach positive total energy. How long the cluster can endure depends on the actual form of the IMF, but since we expect that less than half of the original stellar mass resides in stars with M<2 M⊙, the cluster should begin to dissolve in the next
1–2 Gyr as stars in this mass range complete their evolution. We therefore adopt a probable lifetime for the SSC M82-F in its present massive form of62 Gyr.
Of course star clusters are subject to a variety of inter-nal and exterinter-nal evolutionary influences beyond those im-posed by stellar evolution and the IMF, including tidal ra-dius limits, stellar mass segregation, and the nature of the stellar velocity distribution function (see Chernoff & Shapiro 1987). The general impact of these additional influences is to promote cluster expansion and thereby reduce the clus-ter lifetime, since expansion causes increased vulnerability of stars to tidally-induced mass loss (Spitzer 1987; Chernoff & Weinberg 1990).
the ancient globular clusters, and especially those near the dense centres of giant galaxies, were formed by some pro-cess that was preferred at early epochs (see Zhang & Fall 1999)? Alternatively, it may simply be that the survivors were picked out from what was initially a varied population of SSCs (e.g. Gnedin & Ostriker 1997).
The large radial velocity of M82-F with respect to its host galaxy implies that M82-F cannot be on a simple cir-cular orbit within the disc of M82. It may be subject to some degree of disc shocking as well as a moderate tidal radius constraint of about 35 pc produced by M82. This is sufficiently large that tides should not have an immediate impact on the structure of M82-F. However, if the cluster begins to expand due to mass loss, as expected within the next 2 Gyr, then tides will help to disperse the escaping stars.
8 CONCLUSIONS
We measure a stellar radial velocity dispersion of 13.4±0.7 km s−1 for the super star cluster M82-F. This
re-sult in combination with a new determination of the pro-jected half-light radius of rh =2.8±0.3 pc yields a
dy-namical mass estimate of 1.2±0.1×10⁶ M⊙ for M82-F.
WFPC2 archival observations together with a revised esti-mate for the minimum amount of interstellar obscuration give MV =−14.5±0.3 orLV = 5.4±1.4×10
7
L⊙. The
luminosity-to-mass ratio is then (LV/M)⊙= 45±13. These
parameters show that M82-F has the luminosity and mass to qualify as a young globular star cluster.
Unlike most optically luminous SSCs, M82-F is middle-aged; we reconfirm our earlier age estimate of 60±20 Myr
from Paper I based on fits to the Hδand He Iλ4922 absorp-tion line profiles.M82-F is a factor of 5 times too luminous for a star cluster of its age with a standard stellar mass func-tion extending to 0.1 M⊙. Our data require that M82-F has
a deficiency of low mass stars, at least within the optically bright component of the cluster.
M82-F appears to be unique for an object of its age in displaying the enhanced (LV/M)⊙ predicted for top-heavy
IMFs that are deficient in low mass stars. While this type of behaviour is seen in Galactic centre clusters for M>10 M⊙,
it is not yet known if this behaviour applies to lower stellar masses within these star clusters, or if such objects should be expected to exist outside of the very dense centres of giant galaxies. Our models suggest that the lower mass limit for M82-F is 2–3 M⊙for an IMF slope of 2.3, and much of the
mass is then near the lower stellar mass cutoff.
We have considered obvious sources of error but have found none that would substantially change our conclusions. In particular, we have investigated the question of mass seg-regation and find no current observational evidence to sup-port this possibility. While modern forms of the IMF which have fewer low mass stars than a Salpeter IMF provide bet-ter agreement with our observed (LV/M)⊙ ratio, they do
not help with the dynamical problem of having sufficient low mass stars to hold the cluster together over cosmic time spans. In this case, the M82-F cluster is steadily losing mass due to mass lost by evolving stars, and should dissolve within the next 1–2 Gyr.If the cluster is limited to what we see, its high mass and density are not sufficient to assure its survival
without sufficient mass in the form of long-lived, low mass stars. M82-F cannot then be considered as a proto-globular cluster.
The history of evidence for substantial variations in the IMFs of star clusters is chequered. For example, Elson, Fall & Freeman (1989) suggested that intermediate mass stars have a flat IMF in some LMC star clusters, a view that gained support from an observed range in cluster core radii consistent with expansion due to mass loss in the presence of a flat IMF (Elson et al. 1989). However, in one of her last papers, Elson et al. (1999) present deep STIS photometry of two LMC star clusters that show rather normal MFs in both cases, even though one cluster has a compact core and the other a large core of the type previously associated with a flat IMF. In his review of IMFs, Scalo (1998) suggests that significant IMF variations may occur between star clusters, but finds no signs of IMF variations at the level we require in M82-F. Similarly, as we discussed earlier in Sect. 1, neither of the nearest SSCs, NGC 3603 and R136, have abnormal intermediate mass stellar MFs.
Further afield we re-examined properties of NGC 1569A from new structural information published by Hunter et al. (2000) and in NGC 1705-1 from size and photometric mea-surements taken from WFPC2 archival exposures for a new distance estimate (Tosi et al. 2001, in prep.). We confirm the features discussed by Sternberg (1998) for NGC 1569A which is well fit by SSP models with a slightly steeper IMF with a single slope of 2.5. The new data for NGC 1705-1 also confirm the results of Sternberg (1998) that this cluster has a top-heavy MF; for aα= 2.3 slope, we find that the MF is truncated near 2 M⊙.
An indirect factor in favour of a possible top-heavy MF in M82-F is the long held suspicion that this type of situ-ation might generally prevail in M82. Bernl¨ohr (1992) and Rieke et al. (1993) suggested a deficit of low mass stars from fits to the spectral energy distribution. Unfortunately, the luminosity of M82 depends critically on assumptions con-cerning the degree of interstellar obscuration. Satyapal et al. (1997) find that these earlier studies over-corrected for interstellar obscuration, leading to an artificially high stellar power output and the need for a top-heavy MF. Doane and Mathews (1993) took a different approach. In modelling the power requirements for the superwind, they needed a high supernova rate that could be naturally explained by a top-heavy IMF. Again more modern approaches suggest that a normal IMF might be sufficient (Strickland & Stevens 2000).
the ideas presented here were discussed. JSG similarly ex-presses his appreciation to participate in the Modes of Star Formation workshop that took place at the Max Planck In-stitut f¨ur Astronomie in Heidelberg during October 2000. JSG thanks the Vilas Trustees for a Vilas Associate through the University of Wisconsin-Madison Graduate School. Key support was provided by the U.S. National Aeronautics and Space Administration and Space Telescope Science Institute for studies of massive star clusters through research funds as-sociated with Hubble Space Telescope observing programs, most recently as part of General Observer Program 7446. LJS thanks the Department of Astronomy at the University of Wisconsin-Madison for their warm hospitality and finan-cial support during the writing of this paper. The William Herschel Telescope is operated on the island of La Palma by the Royal Greenwich Observatory in the Spanish Obser-vatorio del Roque de los Muchachos of the Instituto de As-trof´ısica de Canarias. The WIYN Observatory is a joint fa-cility of the University of Wisconsin-Madison, Indiana Uni-versity, Yale University and the National Optical Astronomy Observatories.
REFERENCES
Achtermann J. M., Lacy J. H. 1995, ApJ, 439, 163 Ashman K.M., Conti A., Zepf S.E., 1995, AJ, 119, 1164 Bica E., Santos J.F.C., Alloin D.,1990, Revista Mexicana de
As-tronomia y Astrofisica, 21, 202 Bernl¨ohr K., 1992, A&A, 263, 54
Binney J., Tremaine S., 1987, Galactic Dynamics, Princeton Uni-versity Press, Princeton
B¨oker T., van der Marel R. P., Mazzuca L., Rix H.-W., Rudnick G., Ho L. C., Shields J. C., 2001, AJ, 121, 1473
Brodie J. P., Schroder L. L., Huchra J. P., Phillips A. C., Kissler-Patig M., Forbes D. A. 1998, AJ, 116, 691
Calzetti D., Kinney A. L., Storchi-Bergmann T. 1994, ApJ, 429, 582
Chernoff, D. F., Shapiro, S. L. 1987, ApJ, 322, 113 Chernoff D.F., Weinberg M.D., 1990, ApJ, 351, 121
De Marchi G., Clampin M., Greggio L., Leitherer C., Nota A., Tosi M., 1997, ApJ, 479, L27
Devost D., Roy J.-R., Drissen L., 1997, ApJ, 482, 765 Doane J.S., Mathews W.G., 1993, ApJ, 419, 573 Dubath, P. & Grillmair, C. J. 1997, A&A, 321, 379 Eisenhauer F. et al 1998, ApJ, 498, 278
Elmegreen B., Efremov Y., 1997, ApJ, 480, 235
Elson R. A., Fall S. M., Freeman K. C. 1987, ApJ, 323, 54 Elson R. A., Fall S. M., Freeman K. C. 1989, ApJ, 336, 734 Elson R. A., Freeman K. C., Lauer T. R. 1989, ApJ, 347, L69 Elson R., Tanvir N., Gilmore G., Johnson R. A., Beaulieu, S.
1999, in Chu Y.-H., Suntzeff N. B., Hesser J. E., Bohlender D. A., eds., IAU Symp. No. 190. New Views of the Magellanic Clouds, Astron. Soc. Pac., San Francisco p. 417
Figer D. F., Kim S. S., Morris M., Serabyn E., Rich R. M., McLean I. S., 1999, ApJ, 525, 750
Ser. Vol. 211, Massive Stellar Clusters. Astron. Soc. Pac., San Francisco p. 12
Gerhard O., 2001, ApJL, 546, L39
Gnedin O. Y., Ostriker J. P. 1997, ApJ, 474, 223
Gonz´alez Delgado R.M., Leitherer C., 1999, ApJS, 125, 479 Gonz´alez Delgado R.M., Leitherer C., Heckman T.M., 1999,
ApJS, 125, 489
Gonz´alez Delgado R.M., Leitherer C., Heckman T.M., Cervi˜no M., 1997, ApJ, 483, 705
Goodwin S. P. 1997, MNRAS, 286, 669
G¨otz M., McKeith C. D., Downes D., Greve A. 1990, A&A, 240, 52
Gray D.F., Toner C.G., 1986, ApJ, 310, 277
de Grijs R., O’Connell R. W., Becker G. D., Chevalier R. A., Gallagher J. S., III, 2000, AJ, 119, 681
de Grijs R., O’Connell R. W., Gallagher J. S., III, 2001, AJ, 121, 768
Harris W. E. 1991, ARA&A, 29, 543
Heckman T.M., Leitherer C., 1997, AJ, 114, 69
Hillenbrand L. A., Hartmann L. W., 1998, ApJ, 492, 540 Ho L.C., Filippenko A.V., 1996a, ApJ, 466, L83 Ho L.C., Filippenko A.V., 1996b, ApJ, 472, 600
Holtzman J.A., Burrows C.J., Casertano S., Hester J.J., Trauger J.T., Watson A.M., Worthey G., 1995, PASP, 107, 1065 Hunter D.A., O’Connell R.W., Gallagher J.S., Smecker-Hane
Y.T., 2000, AJ, 120, 2383
Jacoby G.H., Hunter D.A., Christian C.A., 1984, ApJS, 56, 257 Kim S.S., Morris M., Lee H.M., 1999, ApJ, 525, 228
Kobulnicky H. A., Skillman E. D., 1997, ApJ, 489, 636
Kontizas M., Hatzidimitriou D., Bellas-Velidis I., Gouliermis D., Kontizas E., Cannon R. D., 1998, A&A, 336, 503
Kroupa P. 2001, MNRAS, 322, 231 Larson R.B., 1985, MNRAS, 214, 379
Larson R. B. 1999, in T. Nakamoto, ed., Star Formation 1999, Nobeyama Radio Observatory, p.336-340,
Leitherer C. et al., 1999, ApJS, 123, 3
Lester D. F., Carr J. S., Joy M., Gaffney N. 1990, ApJ, 352, 544 Massey P., Hunter D. A. 1998, ApJ, 493, 180
McCleod K.K., Rieke G.H., Rieke M.J., Kelly D.M., 1993, ApJ, 412, 111
Meurer G.R., Heckman T.M., Leitherer C., Kinney A., Robert C., Garnett D.R., 1995, AJ, 110, 2665
O’Connell R.W., Mangano J.J., 1978, ApJ, 221, 62
O’Connell R.W., Gallagher J.S., III, Hunter D.A., 1994, ApJ, 433, 65
O’Connell R.W., Gallagher J.S., III, Hunter D.A., Colley W.N. 1995, ApJ, 446, L1
Phillips A.C., Guzman R., Gallego J., Koo D.C., Lowenthal J.D., Vogt N.P., Faber S.M., Illingworth, G.D., 1997, ApJ, 489, 543 Rieke G.H., Lebofsky M.J., Thompson R.I., Low F.J., Tokunaga
A.T., 1980, ApJ, 238, 24
Rieke G.H., Loken K., Rieke M.J., Tamblyn P., 1993, ApJ, 412, 99
Sait¯o M., Sasaki M., Kaneko N., Nishimura M., Toyama K., 1984, PASJ, 36, 305
Sakai S., Madore B.F., 1999, ApJ, 526, 599 Satyapal S. et al., 1995, ApJ, 448, 611
M.A., Smith H.A., Fischer J., Woodward C.E., 1997, ApJ, 483, 148
Scalo J. 1998, in Gilmore G., Howell, D., eds., in ASP Conf. Ser. Vol. 142. The Stellar Initial Mass Function, Astron. Soc. Pac., San Francisco p. 201
Schiavon R.P., Barbuy B., Bruzual A.G., 2000, ApJ, 532, 453 Schweizer F., Seitzer P. 1993, ApJ, 417, L29
Seaquist E.R., Carlstrom J.E., Bryant P.M., Bell M.B., 1996, ApJ, 465, 691
Shen J., Lo K. Y. 1995, ApJ, 445, L99
Shortridge K., Meyerdierks H., Currie M., Clayton M., 1997, Star-link User Note 86.13, Rutherford Appleton Laboratory Sirianni M., Nota A., Leitherer C., De Marchi G., Clampin, M.
2000, ApJ, 533, 203
Sofue Y., Reuter H.-P., Krause M., Wielebinski R., Nakai N. 1992, ApJ, 395, 126
Spitzer L., Jr. 1987, Dynamical Evolution of Globular Clusters, Princeton Univ. Press, Princeton
Spitzer L., Jr., Hart M.H. 1971, ApJ, 164, 399 Sternberg A., 1998, ApJ, 506, 721
Strickland D. K., Stevens I. R. 2000, MNRAS, 314, 511 Takahashi K., Portegies Zwart S.F., 2000, ApJ, 535, 759 Telesco C. M. 1988, ARA&A, 26, 343
Whitmore B.C., Schweizer F., Leitherer C., Borne K., Robert C., 1993, AJ, 106, 1354
Whitmore B.C., Zhang Q., Leitherer C., Fall S.M., Schweizer F., Miller B.W., 1999, AJ, 118, 1551
Yun M. S., Ho P. T. P., Lo K. Y. 1993, ApJ, 411, L17 Zhang Q., Fall S. M. 1999, ApJ, 527, L81
This paper has been typeset from a TEX/ LA