ISSN:2574 -1241
Agreement Between Check Your Hearing Application
and Pure Tone Audiometry
Bambang Udji Djoko Rianto*, Bustanul Ardianto, Anggoro Eka Raditya and Kartono Sudarman
Otorhinolaryngology, Head and Neck Surgery department, Faculty of Medicine, Universitas Gadjah Mada/ DR. Sardjito General Hospital Yogyakarta 55281, Indonesia*Corresponding author: Bambang Udji Djoko Rianto, Otorhinolaryngology, Head and Neck Surgery department, Faculty of Medicine, Universitas Gadjah Mada/ DR. Sardjito General Hospital Yogyakarta 55281, Indonesia
DOI:10.26717/BJSTR.2019.21.003567
Introduction
Hearing loss is associated with a variety of risk factors. This chronic hearing loss can result in depression, decreased self-esteem, anti-social, and cognitive decline. There is association between hearing loss and incident cognitive impairment [1,2]. In general, someone with exposure to loud noises every day is at
risk of hearing loss. Excessively use of certain tools also affects hearing acuity [3]. Pure tone audiometry hearing test is a hearing test using an audiometer instrument performed in a soundproof room. This facility is not always available in clinical practice for otorhinolaryngology specialists [4]. Based on this, a hearing test that is more simple, practical and more accessible is needed.
Received: September 02, 2019
Published: September 09, 2019
Citation: Bambang Udji Djoko R, Busta-nul A, Anggoro Eka R , Kartono S. Agree-ment Between Check Your Hearing Ap-plication and Pure Tone Audiometry. Biomed J Sci & Tech Res 21(2)-2019. BJSTR. MS.ID.003567.
Keywords: Pure Tone Audiometry; Android-Based Hearing Test; Hearing Thresholds; Agreementn
ARTICLE INFO Abstract
Background: Hearing loss is still a problem in otorhinolaryngology practice. Pure tone audiometry is a diagnostic and screening tool for hearing thresholds, but its access is still limited and is not always available at the ENT specialist practice. Check Your Hearing application on smartphone is simple test as alternative methods for hearing acuity examinations, but until now research on this application are still limited.
Objective: To determine the agreement between Check Your Hearing application and a pure tone audiometry test.
Methods: This study was a cross sectional design at Dr. Sardjito general hospital, Yogyakarta, from early May 2018 to the end June 2018. The inclusion criteria:
a) Adult age above 18 years,
b) Normal routine ear nose and throat examination, c) Agreed to participate in research.
Exclusion Criteria Were:
i. Previous history of ear surgery, ii. History of decreased hearing acuity.
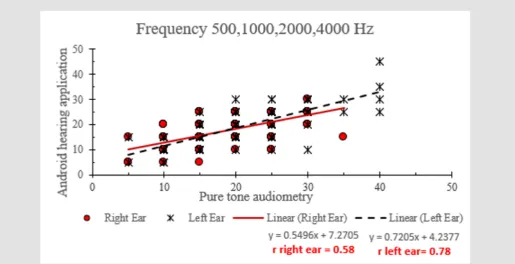
Results: There were 32 samples performed the hearing test using pure tone audiometry and Check Your Hearing application with 30 minutes time interval. Data were analyzed using independent t-test and Pearson product moment. Hearing level value at 500 Hz, 1000 Hz, 2000 Hz and 4000 Hz between Android application and pure tone audiometry is no statistically significance different (p> 0.05), while agreement using Pearson product moment test obtained strong (r right ear= 0.58; left ear= 0.78) and statistically significance (p= 0.001 right and left respectively).
Based on its practicality, many health applications on smartphones have been made to monitor the health of these smartphone owners [5,6]. The use of these health applications can help predict individual health conditions, such as monitoring blood pressure, heart rate and hearing acuity [7-9]. At present there are many Android-based hearing test applications that can be downloaded in the Google Play Store, and several groups have studied the use of smartphones for hearing acuity tests [10,11]. One such application is Check Your Hearing application. This application is very easy and simple, so it can be used in daily practice by Otorhinolaryngology specialists in Indonesia. This research objectives to determine the agreement between the value of the hearing threshold of a Check Your Hearing application and pure tone audiometry hearing test.
Methods
The study started after receiving approval from the Medical and Health Research Ethics Committee (MHREC) Faculty of Medicine, under number KE/FK/0359/EC/2018. This study used a cross-sectional design that was conducted in Dr. Sardjito General Hospital Yogyakarta. The target population in this study were all healthy people who visited in Otorhilolaryngology clinic Dr. Sardjito General Hospital, Yogyakarta from early May 2018 to the end June 2018.
The Inclusion Criterion Was:
1. Adult age above 18 years,
2. The otoscopy results showed normal the outer ear, 3. Agreed to participate in the research.
Exclusion Criteria Were:
1. Previous ear surgery history,
2. Patients with anatomic abnormalities in the external ear. Based on α: 5%, β: 10% and estimate agreement 0.5, total number of samples were 31 samples.
Anamnesis was carried out for all samples, then clinical exam-ination of otorhinolaryngology was performed. Pure tone audiom-etry was performed, where the subject was asked to sit quietly in a quiet room, with a noise level of no more than 30 dB (previously measuring the room noise level, using a sound meter level to deter-mine the sound intensity noise in the room). Air Conduction (AC) measured at a frequency of 250 Hz, 1500 Hz, 2000 Hz, 4000 Hz, and 8000 Hz in sequence, in both ears alternately starting with the right ear, furthermore Bone Conduction (BC) is carried out pure tone audiometry as well. The hearing threshold level is obtained by calculating the average hearing threshold at a frequency of 500 Hz, 1000 Hz, 2000 Hz and 4000 Hz then divided by 4.
The calibration process of the hearing test and Check Your Hearing applications were performed. The calibration process on the hearing test applications was done by selecting the bundled headphones panel on the hearing test application page. This
calibration process used the calibration coefficients set by the developer, which were based on the type of smartphone and built-in earphones. The calibration process built-in the Check Your Hearbuilt-ing application is done by setting the level of sound loudness to the maximum on the applications calibration page [12].
Next, a hearing acuity examination was carried out using an Android-based hearing test application of the Samsung Galaxy S3 GT-I9300® smartphone with an IMEI number: 353719058766310, along with smartphone earphones. Checks are carried out in a room with a noise level of no more than 40 dB. Next the subjects wear earphones and are asked to respond when they hear a tone that is heard. Checks are performed at a frequency of 500 Hz, 1000 Hz, 2000 Hz, 4000 Hz in both ears alternately starting with the right ear. The hearing threshold value is obtained by calculating the hearing threshold frequency of 500 Hz, 1000 Hz, 2000 Hz and 4000 Hz then divided by 4. Each examination was given a 30-minute pause to avoid fatigue in the study subjects. The data obtained were then analyzed using an agreement test. Data is obtained in the form of continuous data, so that statistical analysis of Pearson Product Moment correlation is used. Interpretation of the correlation test results is based on the coefficient value r.
Results
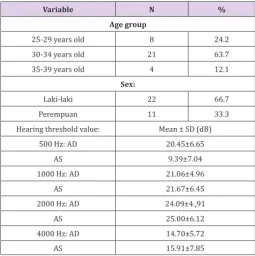
Table 1 shows the characteristics of the study subjects in 32 research subjects. In the study subjects, 22 (66.7%) subjects were male and 11 (33.3%) were female. Based on the age group, the highest distribution was the 30-34 age group as many as 21 subjects (63.7%). In the study subjects, the youngest age was 26 years and the oldest was 37 years. Data on research subject characteristics can be seen in Table 1.
Table 1: Characteristics of research subjects.
Variable N % Age group
25-29 years old 8 24.2
30-34 years old 21 63.7
35-39 years old 4 12.1
Sex:
Laki-laki 22 66.7
Perempuan 11 33.3
Hearing threshold value: Mean ± SD (dB)
500 Hz: AD 20.45±6.65
AS 9.39±7.04
1000 Hz: AD 21.06±4.96
AS 21.67±6.45
2000 Hz: AD 24.09±4.,91
AS 25.00±6.12
4000 Hz: AD 14.70±5.72
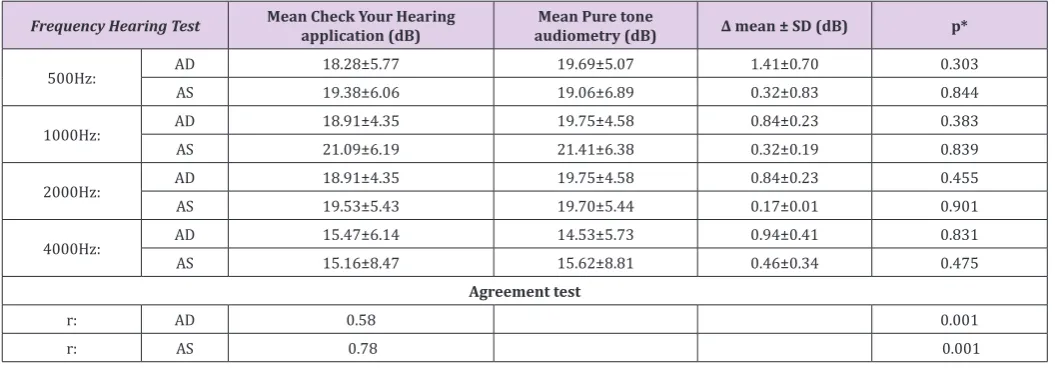
Table 2 shows the comparison of hearing threshold results between the Check Your Hearing application compared to the pure tone audiometry, that there was no statistically significant
difference. The correlation coefficient (r) was obtained between the Check Your Hearing application and the pure tone audiometer on the right and left ears, respectively 0.58 and 0.78.
Table 2: Comparison of hearing threshold results between the check your hearing application compared to the pure tone audiometry.
Frequency Hearing Test Mean Check Your Hearing application (dB) audiometry (dB)Mean Pure tone Δ mean ± SD (dB) p*
500Hz: AD 18.28±5.77 19.69±5.07 1.41±0.70 0.303
AS 19.38±6.06 19.06±6.89 0.32±0.83 0.844
1000Hz: AD 18.91±4.35 19.75±4.58 0.84±0.23 0.383
AS 21.09±6.19 21.41±6.38 0.32±0.19 0.839
2000Hz: AD 18.91±4.35 19.75±4.58 0.84±0.23 0.455
AS 19.53±5.43 19.70±5.44 0.17±0.01 0.901
4000Hz: AD 15.47±6.14 14.53±5.73 0.94±0.41 0.831
AS 15.16±8.47 15.62±8.81 0.46±0.34 0.475
Agreement test
r: AD 0.58 0.001
r: AS 0.78 0.001
Discussion
Pure tone audiometry is an ideal tool for assessment of hearing. However due to its high operating cost, requirement of trained manpower and expensive infrastructure it may not be ideal as a screening test for hearing. A hearing test in a clinic, called Pure-Tone Audiometry (PTA), is performed using an audiometer system in a soundproof room. However, some people have difficulty testing their hearing in a clinic [13]. Smartphone hearing test applications are providing alternative tests in underserved areas that provide low-cost solutions that can result in early detection. This is particularly important in developing areas where audiology services are unavailable. Smart phone application like Hearing check app is a cheap and effective way to assess hearing with reasonable accuracy. This application has high sensitivity and test retest reproducibility makes it an ideal tool for screening and early detection of hearing loss replacing out dated free field hearing. The test retest reproducibility measured with Pearson correlation coefficient was high (0.99) with hearing check application [14]. There are number of application available for ear and hearing assessments; however, very few have been validated in peer-reviewed literature [15].
Many medical applications for smartphones have been developed and widely used by health professionals and patients. The use of smartphones is getting more attention in healthcare day by day. Medical applications make smartphones useful tools in the practice of evidence-based medicine at the point of care [16]. The main determinant of an application value may ultimately be its ability to provide meaningful, accurate, and timely information and guidance to the end user in serve the vital purpose of improving patient outcomes [17]. Smartphone hearing test applications are providing alternative tests in underserved areas that provide low-cost solutions that can result in early detection. This is particularly
important in developing areas where audiology services are unavailable. A smartphone hearing test is easy to perform and can be self-administered at any time.
Other study reported that the mean difference between the pure-tone audiogram and the smartphone hearing test results and found the absolute difference was 8.8 dB. In this present study this the difference between Check Your Hearing application and pure tone audiometry was between 1.41 ± 0.70 dB. The different result between both hearing test equipment are different with study by Renda et al. [18], which showed statistically significant results at a frequency of 500 Hz, 1000 Hz in both ears. This difference can be made possible because in this present study conducted in a room with environmental noise <30 dB, while the study conducted by Renda et al. [18] in a room with environmental noise 35- 40 dB [18]. In this present study, the results of the intensity each frequency on the Check Your Hearing application is not significantly difference compared to pure tone audiometer (Table 2). This result is different from the study of Renda et al. [18] that obtained the intensity of each frequency on the hearing test application on Android was lower than the pure tone audiometry. This result may be caused by the differences in the room environmental noise of examination.
Figure 1: The correlation between check your hearing application and pure tone audiometry.
Conclusion
This present study showed a high agreement enough between hearing threshold values using an Android-based and pure pure-tone audiometer hearing test application. The Check Your Hearing application can be considered as an alternative hearing screening tool, especially in areas that do not yet have a portable audiometer.
Acknowledgement
We are gratefully indebted to our study participants in Yogyakarta. We also express our gratitude to Internal Medicine Clinic Dr. Sardjito General Hospital Yogyakarta Staff, Dr. Sardjito General Hospital and all research assistants (ENT Residences and Nurses) that participated in this research, and to the Health Research Ethics Committee Faculty of Medicine Universitas Gadjah Mada that gave permission, license and approved this research.
References
1. Lin FR, Yaffe K, Xia J, Xue QL, Harris TB, et al. (2013) hearing loss and cognitive decline among older adults. JAMA Intern Med 173(4): 293-299. 2. Davis A, Pauline S (2013) Adult hearing screening: Health policy
issues--what happens next? Am J Audiol 22(1): 167-170.
3. Ramya CS, Karthiyanee K, Vinutha S (2011) Effect of mobile phone usage on hearing threshold: A pilot study. Indian J Otol 17(4): 159-162. 4. Watson CS, Kidd GR, Miller JD, Smits C, Humes LE (2012) Telephone
screening tests for functionally impaired hearing: Current use in seven countries and development of a US version. J Am Acad Audiol 23(10): 757-767.
5. Mena LJ, Felix VG, Ostos R, Gonzalez JA, Cervantes A, Ochoa A, et al. (2013) Mobile personal health system for ambulatory blood pressure monitoring. Comput. Math Methods Med 2013:598196.
6. Petersen CL, Chen TP, Ansermino JM, Dumont GA (2013) Design and evaluation of a low-cost smartphone pulse oximeter. Sensors 13(12): 16882-16893.
7. Macias E, Suarez A, Lloret J (2013) Mobile sensing systems. Sensors 13(12): 17292-17321.
8. Boulos MN K, Wheeler S, Tavares C, Jones R (2011) How smartphones are changing the face of mobile and participatory health care: An overview, with example from eCAALYX. Biomed Eng Online 10:24.
9. Hii P, Chung W (2011) A comprehensive ubiquitous healthcare solution on an androidtm mobile device. Sensors 11(7): 6799-6815.
10. Handzel O, Ben-Ari O, Damian D, Priel MM, Cohen J, et al. (2013) Smartphone-based hearing test as an aid in the initial evaluation of unilateral sudden sensorineural hearing loss. Audiol Neurootol 18(4): 201-207.
11. Kam ACS, Sung JK, Lee T, Wong TK, van Hasselt A (2012) Clinical evaluation of a computerized self-administered hearing test. Int J Audiol 51(8): 606-610.
12. Masalski M, Kipiński L, Grysiński T, Kręcicki T (2016) Hearing tests on
mobile devices: Evaluation of the reference sound level by means of biological calibration. J Med Internet Res 18(5): 1-12.
13. Na Y, Joo HS, Yang H, Kang S, Hong SH, et al. (2014) Smartphone-based hearing screening in noisy environments. Sensors 14(6): 10346-10360. 14. Swami H, Bhargava A, Sabarigirish K, Arvind BM (2017) A comparative
study of smart phone-based app with free field hearing for possible use
as a screening test. Int J Otorhinolaryngol Head Neck Surg 3(3):710-714. 15. Bright T, Pallawela D (2016) Validated smartphone-based apps for ear
and hearing assessments: A review. JMIR Rehabil Assist Technol 3(2): e13.
16. Mosa ASM, Yoo I, Sheets L (2012) A systematic review of healthcare applications for smartphones. BMC Med Inform Decis Mak 12(67): 1-31. 17. Ventola CL (2014) Mobile devices and apps for health care professionals:
18. Renda L, Selcuk OT, Eyigor H, Osma U, Yılmaz MD (2016) Smartphone based audiometric test for confirming the level of hearing; Is it useable
in underserved areas? J Int Adv Otol 12(1): 61-66.
Submission Link: https://biomedres.us/submit-manuscript.php
Assets of Publishing with us • Global archiving of articles
• Immediate, unrestricted online access • Rigorous Peer Review Process • Authors Retain Copyrights • Unique DOI for all articles
https://biomedres.us/ This work is licensed under Creative
Commons Attribution 4.0 License
ISSN: 2574-1241
DOI:10.26717/BJSTR.2019.21.003567