Abstract
ISSA, JOSEPH YOHANE. In Vitro Calcium Bioaccessibility in Moringa oleifera Vegetable Leaves: Potential Plant Food to Increase Dietary Calcium Intake inDeveloping Countries. (Under the direction of Dr. Jonathan C Allen).
Low calcium intake, poor calcium absorption, exessive calcium losses, or some combination of these factors contribute to calcium deficiency diseases. Calcium deficiency can lead
osteoporosis, reduced bone mass, hypertension and colon cancer among other diseases.Calcium in bones plays a role in bone mineralization. In other body tissues it plays roles in mediating vascular contraction and vasodilation, muscle contraction, nerve
transmission, and glandular secretion.The best food sources of calcium include milk and dairy products, especially cheese and yogurt, and selected seafoods, such as salmon and
sardines (with bones), clams, and oysters. Bioavailability and bioaccessibility of calcium is high in milk and dairy products due to the presence of lactose and other factors. However, calcium bioavailability or bioaccessibility is low in most vegetable plants due to presence of
other substances like oxalic acid, phytate and other competing minerals.
Moringa oleifera, a tropical and sub-tropical vegetable plant, has a big potential to contibute a substantive portion of the recommended daily allowance (RDA) for calcium and reduce calcium deficiency diseases. The objective of this study was to determine the calcium
content, digestibility and bioaccessibility in the leaves of Moringa oleifera.
bioaccessibility. The digestible and bioacessible calcium was measured using AAS after an
in-vitro digestion and an in-vitro absorption processes respectively.The results indicated that
Moringa oleifera had higher percentage of calcium than spinach and sweet potato leaves. The mean percentage calcium was 1.67±0.0014, 1.44±0.0014 and 1.55±0.00 for Moringa oleifera
samples from India (M3), from Malawi (M4) and another sample from Malawi (M5) respectively. The mean percentage calcium in spinach and sweet potato leaves were 0.99±0.0007, and 1.06± 0.0014 respectively.The mean percentage digested calcium was
21.68±2.65, 40.48±3.42 and 37.24±1.66 for Moringa oleifera samples from India (M3), from Malawi (M4) and the second Moringa oleifera sample from Malawi (M5) respectively. The mean percentage digested calcium in spinach and sweet potato leaves were 1.63±0.08, and 3.01± 0.68 respectively. The mean percentage dialyzed or bioaccessible calcium was 6.82±1.80, 10.75±0.96 and 11.15 ±2.88 for Moringa oleifera samples from India (M3), from Malawi (M4) and the second Moringa oleifera sample from Malawi (M5) respectively. The mean percentage dialyzed calcium in spinach and sweet potato leaves were 0.55±0.37, and
3.08±2.05 respectively.
The results showed that there was a statistically significant different in percentage calcium
content from the Moringa oleifera samples from India and the two samples from Malawi. The digested calcium in the two Moringa oleifera samples from Malawi was found to be statistically similar; however both samples from Malawi were statistically different from
In Vitro Calcium Bioaccessibility in Moringa oleifera Vegetable Leaves: Potential Plant Food to Increase Dietary Calcium Intake in Developing Countries
by Joseph Yohane Issa
A thesis submitted to the Graduate Faculty of North Carolina State University
in partial fulfillment of the requirements for the degree of
Master of Science
Food Science
Raleigh, North Carolina 2012
APPROVED BY:
________________________ ___________________________ G.Keith Harris, Ph.D. Rick Brandenburg, Ph.D.
________________________________ Jonathan C. Allen, Ph.D.
ii
DEDICATION
iii
BIOGRAPHY
Joseph Issa was born on 5th of January 1982 in Blantyre, Malawi. He grew up in Malawi and did his secondary school education at Chiradzulu secondary school in the same country. He pursued his bachelor’s degree in Education Science at Chancellor College, a constituent
college of the University of Malawi. Joseph graduated with a Bachelor’s degree in May 2006 with a major in Chemistry and minor in Biology.
After graduating from the University of Malawi, Joseph worked in the Ministry of Education,
Malawi where he worked as a secondary school teacher for the sciences. He worked as a teacher from June 2006 to January 2007. Thereafter he joined the Malawi Industrial Research
and Technology Development Centre (MIRTDC) in February 2007. At MIRTDC, Joseph worked as a Chemical scientist.
While at MIRTDC, Joseph got a scholarship from the United States Agency for International
Development (USAID) to study for a Masters degree in July 2009. Joseph pursued a Master of Science degree in Food Science at North Carolina State University under the guidance of
iv
ACKNOWLEDGEMENTS
I thank all my Lecturers, for the support and encouragement given to me during my study at North Carolina State University. Many thanks should go to my Advisor and committee chair of my thesis research, Dr. Jonathan Allen. I thank Dr. Allen for all the support, encouragement and guidance that he gave me during my thesis research work. Thanks should also go to all my committee members, Dr Rick Brandenburg and Dr Keith Harris for their guidance and mentorship. Thanks to Ruth Watkins, the laboratory manager of the Nutrition Technical Services Lab, Food, Bioprocesing and Nutrition Sciences Department at NC State University and Mr. Weiting Cai for their assistance and guidance in conducting my laboratory analysis.
v
TABLE OF CONTENTS
LIST OF TABLES ...vii
LIST OF FIGURES ... viii
CHAPTER 1-LITERATURE REVIEW Introduction ... 1
Calcium sources and functions ... 1
Calcium bioavailability and absorption ... 5
Effects of dietary components on calcium absorption ... 6
Calcium and vitamin D ... 8
Effects of calcium deficiency ... 10
Nutritional needs of calcium ... 11
Calcium toxicity ... 12
Techniques for measuring calcium bioavailability ... 13
In-vivo methods ... 13
In-vitro methods ... 15
References ... 16
BIOACCESSBILITY OF CALCIUM IN MORINGA OLEIFERA LEAVES Introduction ... 23
History and use of Moringa oleifera ... 23
Moringa oleifera nutrition ... 25
Materials and Method ... 26
Sample collection and preparation ... 26
Sample collection ... 26
Sample preparation ... 26
Evaluation of total calcium ... 27
Evaluation of calcium digestibility ... 27
Gastric digestion ... 29
Intestinal digestion ... 29
Evaluation of calcium bioaccessibility ... 29
Calculation of calcium bioaccessibility ... 31
vi
Results ... 32
Calcium content ... 32
Calcium digestibility ... 34
Calcium bioaccessibility ... 35
Discussion ... 37
Conclusion ... 41
References ... 42
APPENDICES ... 44
Appendix 1. SAS output data for percentage Calcium content in M3, M4 and M5 ... 45
Appendix 2. SAS output data for percentage digested calcium in M3, M4 and M5 ... 48
Appendix 3. SAS output data for percentage dialyzed calcium in M3, M4 and M5 ... 51
vii
LIST OF TABLES
Table 1.1 Calcium Dietary Reference Intakes (DRIs) for Adequacy
(Amount/day) ... 4 Table 1.2 Effects of dietary components on calcium absorption ... 7 Table 2.1 Nutrient comparison of Moringa oleifera leaves with other foods,
per 100g ... 19 Table 2.2 Total calcium content from Moringa oleifera, spinach and sweet
Potato leaves ... 27 Table 2.3 Calcium digestibility from Moringa oleifera, spinach and sweet
potato leaves ... 28 Table 2.4 Calcium inaccessibility from Moringa oleifera, spinach and sweet
potato leaves ... 31
viii
LIST OF FIGURES
LITERATURE REVIEW
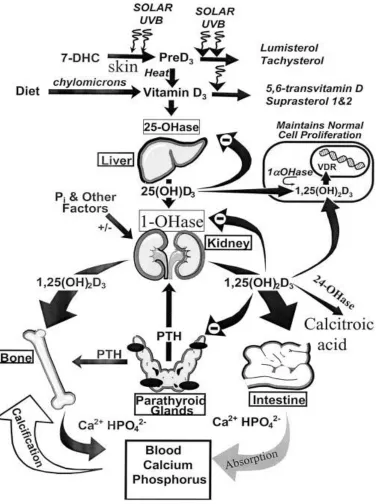
Figure 1. Production, metabolism and calcium homeostasis regulation of vitamin D... 5 MATERIALS AND METHODS
CHAPTER 1
LITERATURE REVIEW
JOSEPH YOHANE ISSA
DEPARTMENT OF FOODBIOPROCESSING AND NUTRITION SCIENCES
1
Introduction
1.1Calcium sources and Functions
Calcium is a very important and abundant mineral in the body and accounts for one to two percent of the body weight. More than 99 percent of the body calcium is found in bones and teeth, the rest is found in blood, muscle, extracellular fluid and other body tissues (Gropper,
2009).In bone, calcium exists primarily in the form of hydroxyapatite (Ca10(PO4)6(OH)2), and
bone mineral is almost 40 percent of the weight of bone (IOM, 1997). Calcium in bones play
a role in bone mineralization, in other body tissues it plays roles in mediating vascular contraction and vasodilation, muscle contraction, nerve transmission, and glandular
secretion. Bone is a dynamic tissue that continuously undergoes osteoclastic bone resorption and osteoblastic bone formation.
In the body, calcium is absorbed by active transport and passive diffusion across the
intestinal mucosa. Active transport of calcium into enterocytes and out on the serosal side depends on the action of 1,25-dihydroxyvitamin D (1,25(OH)2D), the active form of vitamin
D, and its intestinal receptors. However, passive diffusion involves the movement of calcium between mucosal cells and is dependent on the luminal:serosal calcium concentration
2
Fractional calcium absorption varies through the lifespan; it is highest (about 60 percent) in infancy (Abrams et al., 1997a) and rises again in early puberty. Calcium excretion from the
kidneys depends on the filtered load and the efficiency of reabsorption where the latter is regulated primarily by the PTH level.Calcium metabolism differs from one race to
another.Parathyroid Hormone (PTH), calcitonin, and vitamin D regulatecalcium metabolism to maintain serum calcium level. Low intake of calcium leads to release of calcium from bone, thereby increasing the risk of osteoporosis (Bendich, 2001).The best food sources of
calcium include milk and dairy products, especially cheese and yogurt, and selected seafoods, such as salmon and sardines (with bones), clams, and oysters (Gropper et al.,
2009). Bioavailability of calcium from nonfood sources, or supplements, depends on the presence or absence of a meal and the size of the dose. Weight-bearing physical activity or mechanical loading determines the strength, shape, and mass of bone. Although exercise and
calcium intake both influence bone mass, it is unclear whether calcium intake influences the degree of benefit derived from exercise. There is insufficient evidence to justify different
calcium intake recommendations for people with different levels of physical activity. Calcium can be obtained from calcium-rich foods such as milk, dairy products and other
fortified foods such as cereal and juice beverages (IOM, 1997). In other countries however, including USA and Malawi, milk consumption is limited due to the undesirable effects of lactose intolerance (Scrimshaw and Murry, 1988). The Recommended Dietary Allowances
3
Inadequate calcium consumption may have an adverse effect of reducing blood calcium level, resulting in development of tetany, and can lead to respiratory and cardiac failure as a
result of impaired muscle function (Luke, 1984). Increased calcium intake can lower the risks of systolic and diastolic blood pressure, thereby providing some protection against
hypertension (Bucher et al.,1996). About half of calcium in the blood exists in form of free dissolved calcium ion (Ca2+), about 40% is bound to proteins, mainly albumin and prealbumin, and the remaining percentage (up to 10%) is in complexes with sulphate,
phosphate or citrate (Muban, et al., 1996). Calcium helps to initiate the changes needed for the formation of blood clots by binding to fibrin and other proteins in the clotting cascade.
Thrombin requires calcium to help in the polymerization of fibrinogen to fibrin (Czajka-Narins D M, 1992). Calcium is needed for transmitting nerve impulses. Calcium makes acetylcholine available for nerve impulse transmission whereby acetylcholine is required to
pass messages from one nerve cell to the adjacent one. Calcium influences the transmission of ions across membranes of cell organelles, the release of neurotransmitters at synaptic
4
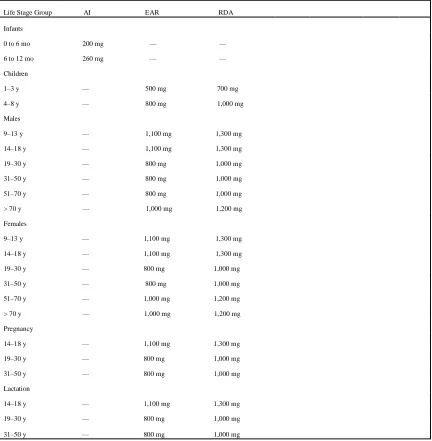
Table 1.1:Calcium Dietary Reference Intakes (DRIs) for Adequacy (Amount/day)
Life Stage Group AI EAR RDA
Infants
0 to 6 mo 200 mg — — 6 to 12 mo 260 mg — —
Children
1–3 y — 500 mg 700 mg 4–8 y — 800 mg 1,000 mg
Males
9–13 y — 1,100 mg 1,300 mg 14–18 y — 1,100 mg 1,300 mg 19–30 y — 800 mg 1,000 mg 31–50 y — 800 mg 1,000 mg 51–70 y — 800 mg 1,000 mg > 70 y — 1,000 mg 1,200 mg
Females
9–13 y — 1,100 mg 1,300 mg 14–18 y — 1,100 mg 1,300 mg 19–30 y — 800 mg 1,000 mg 31–50 y — 800 mg 1,000 mg 51–70 y — 1,000 mg 1,200 mg > 70 y — 1,000 mg 1,200 mg
Pregnancy
14–18 y — 1,100 mg 1,300 mg 19–30 y — 800 mg 1,000 mg 31–50 y — 800 mg 1,000 mg
Lactation
14–18 y — 1,100 mg 1,300 mg 19–30 y — 800 mg 1,000 mg 31–50 y — 800 mg 1,000 mg
5
1.2.1 Calcium Bioavailability and Absorption
Bioavailability for dietary supplements is defined as the proportion of a substance capable of
being absorbed and available for use or storage in the body (Srinivasan, 2001). Bioacessibility is the potential of a nutrient to interact with (and be absorbed by) an
organism. There are many chemical structures of calcium in food; however its bioavailability varies from one source to another. Calcium may be poorly absorbed from foods rich in
oxalic acid (spinach, sweet potatoes, rhubarb, and beans) or phytic acid (unleavened bread, raw beans, seeds, nuts and grains, and soy isolates). Some nutrients such as sodium, protein and caffeine have a great impact on calcium absorption and retention. High sodium chloride
intake results in increased absorbed sodium, increased urinary sodium, and an increased obligatory loss of urinary calcium (Kurtz et al., 1987). Protein increases urinary calcium
excretion, but its effect on calcium retention is not well described. However, available evidence does not warrant adjusting calcium intake recommendations based on dietary protein intake. Caffeine has a negative impact on calcium retention and has been associated
with increased hip fracture risk in women (Kiel et al., 1990).Conditions that produce lower levels of circulating estrogen alter calcium homeostasis; lower levels of estrogen are
associated with decreased calcium absorption efficiency. However, from available evidence, the calcium intake requirement for women does not appear to change acutely with menopause. Lactose-intolerant individuals absorb calcium normally from milk; however they
6
In addition, consumption of vegetarian diets may influence the calcium requirement because of their relatively high contents of oxalate and phytate, compounds that reduce calcium
bioavailability. Calcium is transported from the intestinal lumen into the body mainly by an active transport mechanism. Active transport requires energy, involves a calcium binding
protein (calbindin) and is regulated by vitamin D3 (calcitriol). Vitamin D3 calcium dependent
transport is stimulated with the ingestion of low calcium diets, and conditions of growth, pregnancy and lactation in which calcium requirements are increased (National Research
Council, 1989). Calcium is also absorbed in the body via a passive transport mechanism. Absorption of calcium is increased via passive transport if there is an increased intake of the
mineral (National Research Council, 1989).
1.2.2 Effects of dietary components on calcium absorption
Lactose has been reported to increase calcium absorption and is possibly why calcium from
milk is highly bioavailable. The lactose-calcium complex prevents the precipitation of calcium in an insoluble complex as the contents of the intestinal tract changes from acid to
alkaline (Kocian et al., 1973).Vitamin D regulates the synthesis of a calcium binding protein that serves as calcium carrier in the intestinal cell. Increased concentration of the active form of vitamin D results in a 10 to 30% increase in calcium absorption (Burton, 1976). Insoluble
7
Processing methods such as dehulling, soaking, ordinary cooking, pressure cooking and germination have been found to beneficially lower phytic acid content and improve the
bioavailability of minerals(Bishnoiet al., 1994). Oxalic acid binds with Ca, Fe and Mg, making these minerals unavailable for absorption. Generally, oxalic acid is highest in the
leaves, higher in the seeds and the lowest in the stems (Osweileret al., 1985).
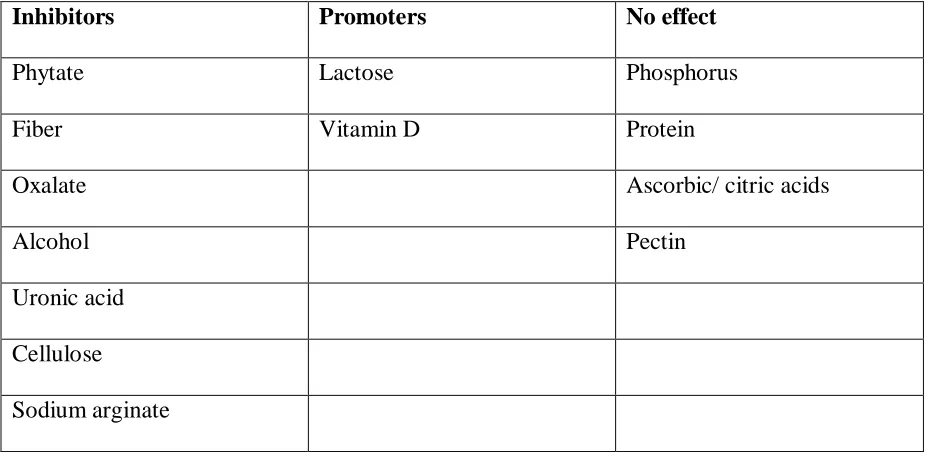
Table 1.2: Effects of dietary components on calcium absorption
Inhibitors Promoters No effect
Phytate Lactose Phosphorus
Fiber Vitamin D Protein
Oxalate Ascorbic/ citric acids
Alcohol Pectin
Uronic acid
Cellulose
Sodium arginate
8
1.2.3 Calcium and Vitamin D
The active form of vitamin D, 1,25 dihydroxy-vitamin D3 (calcitriol), regulates blood
calcium by increasing absorption of calcium through the small intestine, reducing calcium excretion through the kidney and regulating calcium deposition in the bones (Wardlaw,
1999).
The intestinal calcium absorption is mainly regulated by vitamin Dwhen increases in 1,25 dihydroxy-vitamin D increase active transport. The main biological function of vitamin D3
on regulators of calcium metabolism are stimulating the absorption of calcium from food across the intestine and participating in the incorporation of the absorbed calcium into the
skeleton (Norman, 1979). Adequate amounts of calcium and vitamin D throughout life helps reduce the risk of osteoporosis and reduces risk of fractures and falls (Calvo et al., 2005 and Iwamoto et al., 2004). Vitamin D deficiency causes poor bone mineralization of the collagen matrix in young children’s bones leading to growth retardation and bone deformities known
9
10
1.2.4 Effects of calcium deficiency
Inadequate calcium intake, poor calcium absorption, exessive calcium losses, or some
combination of these factors contributes to calcium deficiency (Gropper, et al.,2009). Calcium deficiency is associated with many chronic diseases. In the United States, 10 million
people have osteoporosis and another 18 million are at increased risk; 80% of those affected are women (Bronner, 1992). Osteoporosis is a disease characterized by low bone mass and
structural detoriation of bone tissue, leading to bone fragility and increased susceptability to fractures, especially of the hip, spine and wrist (Kanis, et al., 1994). Ingestion of diets rich in calcium and vitamin D, weight bearing exercise, a healthy life style with no smoking or
excessive alcohol use can reduce the risks of developing osteoporosis(Riggs, et al., 1992; Vuori, 1996). Inadequate amounts of calcium and phosphorus coupled with insufficient
activity of vitamin D results in failure of bones to mineralize properly and bones weaken and soften, causing rickets in young children and osteomalacia in adults. Osteomalacia may cause fractures in the hip and spine bones while rickets can result into bowed bones, curved bones
and lumpy joints. Severe loss of calcium and phosphorus may lead to formation of cysts in the bones (Rasmussen, et al., 2000).
Research indicates that low calcium intake increases the risk of high blood pressure (Miller et
11
It has been found that calcium may inhibit the formation of colon cancer cells by binding with bile acids and fatty acids, both of which can trigger abnormal cell growth within the
colon (Lupton, et al., 1996; Holtet al., 1998).
1.2.5 Nutritional needs for calcium
The nutritional requirements for people varies with age and activity. The dietary reference
intakes may vary in different countries. In America, the Dietary Reference Intakes (DRI) establish and Adequate Intake (AI) at 200mg/day and 260mg/day for infants aged 0-6 months
and 7-12 months, respectively. For children aged 1-3years and 4-8 years the DRIs set a Recommended Dietary Alllowance (RDA) at 700mg/day and 100mg/day, respectively, based
in an Estimated Average Requiremetn (EAR) of 500 mg/day and 800 mg/day.The calcium RDAs for both males and females in America are 1300mg/day, 1000mg/day and 1200mg/day for ages 9-18years, 19-70years and above 70 years respectively. The RDAs for pregnant and
lactating women are 1300mg/day and 1000mg/day for women aged 14-18years and 19-50years respectively(IOM., 2011).According to a study done in Malawi, a developing
country, food eaten at main meals, dinner and lunch contributed the largest proportions on energy, protein and calcium intakes (Hallund, etal., 2008).The study however showed that calcium intakes from women in the study was lower than the recommended intakes with
average intakes of 620mg/day and 622mg/day for non-lactating women and lactating women respectively.These values are far lower than the recommended intakes of 1000-1300mg/day
12
The study was conducted between the months of March and May (the peak season for many fruits and vegetables) and fruits and vegetables contributed more to calcium intake.A nutrient
intake study among a longitudinal cohort of black South African children at four inceptions (from birth to ten years) found that calcium intake fell below the recommended intakes at all
the inceptions (Mackeown et al., 2003). During the four inceptions; 70%, 90%, 77% and 90% of the children under study were below the RDA at the first (1995), second (1997), third (1999) and fourth (2000) inception respectively.Another study on nutrient intake was
conducted in South Africa in three ethnic groups (black, white and mixed ancestry subjects) and found that mean dietary calcium was higher in white subjects than in black and mixed
ancestry subjects; however, calcium intake was low in all the groups with about half of the DRI of 1000mg/day (Charlton et al., 2005).In black, mixed ancestry, and white subjects, 84.4%, 88.4% and 78.6% respectively had inadequate (<67% DRI) calcium intakes.
1.2.6 Calcium Toxicity
Intakes of calcium of up to 2,500mg per day appears to be safe for most people (Gropper, et
al., 2009). There is no documented information on calcium overconsumption from food, as opposed to from dietary supplements. Overconsumption of calcium lead to elevated blood calcium (hypercalcemia) which results in loss of appetite, nausea, vomiting, constipation,
13
People with hypercalciuria (urinary calcium intake levels of more than 4mg/kg body weight per day), or who ingest large amounts of calcium, are at the risk of developing
calcium-containing kidney stones (Gropper, et al., 2009).
The tolerable upper intake level (UL) of calcium has been recommended for people aged one
to eight years old and 19 to 50 years old to be 2500mg/day, for 9 to 18 years old, 3000 mg/day, and over 50, 2000 mg/day (IOM, 2011).
1.2.7 Techniques for Measuring Calcium bioavailability
Bioavailability of nutrients is either estimated by in-vivo or in-vitro experimental studies. In-vivo studies use animals as models for human calcium absorption.In-vitro studies use solubility or dialysability tests to simulate the conditions in the human stomach and intestines. Compared to in-vitro experiments, in-vivo experiments are time consuming, very expensive and often give variable results that are difficult to interpret. In in-vivo studies, laboratory animals are used as models for humans. In-vitro studies are popular nowadays because of their simplicity, accuracy, speed of analysis and relatively low cost (Wolter, et al.,
14
1.2.7.1In-vivo methods
In-vivo studies are balance studies, which include chemical balances, radioactive balances and stable isotope balances. Balance studies have been conducted in both animals and humans in order to measure the apparent absorption of calcium from various diets, and under
different physiological conditions (Allen, 1982).
The difference between calcium intake and fecal calcium is defined as apparent absorption. Radioactive balance studies correct for endogenous excretion to determine true absorption.
Chemical balance studies do not expose subjects to ionizing radiation hence giving it preference as compared to other balance methods when human subjects are involved. Errors
when determining either intake or excretion can result in significant errors in absorption estimates (Hegsted, 1973).
There are a number of methods that use calcium isotopes; with those commonly used being radioactive such as 45Ca and 47Ca, however 47Ca is frequently used in humans because of its shorter half-life (Allen, 1982). To estimate calcium absorption using isotopes of calcium, the
difference between the intake and fecal output of the isotope is assumed to be the true absorption. There are two types of calcium isotope techniques; namely single-isotope and
15
However the disadvantage is that if used in humans, the subjects are exposed to ionizing radiation, which may be unadvisable to some target groups such as pregnant women, infants
and young children (Layrisse, et al., 1990). Apart from radioactive isotopes, stable isotopes of calcium have also been used in different bioavailability studies. Use of these isotopes
employs the same mathematical techniques as in the other balance studies, but different instrumentation for measurement. Stable isotopes have an advantage over the radioactive isotopes because they have no health risks from ionizing radiation, do not decay and can be
freely used in food samples or food processing equipment without causing radioactive contamination. Stable isotope technique is however disadvantageous in that it is more
expensive than radioactive techniques (Weaver, 1988).
1.2.7.2In-vitro methods
Some in-vitro methods involve determining solubility of trace elements in different solutions whereas some methods involve extraction of the trace elements with chelating agents. Many
16
This method has been the basis for many in-vitro methods for estimating the bioavailability of iron and other minerals including calcium. Miller’s in-vitro method used equilibrium dialysis of minerals and trace elements across a semi-permeable membrane as a model for the passage across the walls of the intestines. The assumption here is that the minerals and trace
elements that are dialyzable are available for absorption in the small intestines.
Calcium absorption in infants is mainly through passive diffusion (Barltrop et al., 1977, and
Bronner, 1992), however in adults it is mainly absorbed through an active transport mechanism and passive transport only when the intake has been increased to saturation. Some improved in-vitro dialysis methods have been developed to continuously remove the dialyzable components (Minihane et al., 1993).Minihane et al., (1993) used an Amicon stirred cell for continuous dialysis and the pH was gradually adjusted over 30 minutes period
to 7 before dialysis. The results indicated that the gradual change of pH during dialysis is very important in evaluating calcium bioavailability.
REFERENCES
Abrams SA, Stuff JE, (1994). Calcium metabolism in girls: Current dietary intakes lead to
low rates of calcium absorption and retention during puberty. Am J ClinNutr60:739–743.
Allen LH, (1982). Calcium bioavailability and absorption: a review. Am J
17
Barltrop D, Mole RH and Sutton A,(1977). Absorption and endogenous fecal excretion of calcium by low birth weight infants on feeds with varying contents of calcium and
phosphate. Arch Dis Child52:41-9.
Bendich A (2001). Calcium supplementation and iron status of females.Nutr17: 46-51.
Bishnoi S, Khetarpaul M, and Yadav RK,(1994).Effect of domestic processing and cooking methods on phytic acid and polyphenol contents of pea cultivars (PisumSativum). Plant
Foods Human Nutr 45:381-88.
Bronner F. Transcellular Calcium transport. In Bronner F, (1990).Intracellular
CalciumRegulation. New York: Wiley-Liss, 415-37.
BronnerF(1992) Current concepts of calcium absorption : an overview. J Nutr 122:641-3.
Bucher HC,Cook RT, Guyatt GH, (1996).Effect of dietary calcium supplementation on blood
pressure.JAMA 275;1016.
Burton BT(1976).Human Nutrition, 3rded. New York: McGraw-Hill.
Calvo, MS., Whiting SJ, Barton CN(2005). Vitamin D: a global perspective of current
status. JNutr135:310-316.
Charlton KE, Steyn K, Levitt NS, Zulu JV and Jonathan D (2005) Diet and blood pressure in
18
Cummings JH, Southgate DAT, Branch WG (1979).The digestion of peptic in the human gut
and its effect on calcium absorption and large bowel functions. British J Nutr41:447-85.
Czajka-Narins DM. Minerals.In : Krause’s Food Nutrition and Diet Therapy. Mahan L K. eds (1992). Philadelphia : WB Saunders Company; 109-40.
Gropper SA, Smith JL, Groff JL(2009).Advanced Nutrition and Human Metabolism. Fifth ed.Belmont, CA: Wadsworth.
Guillemant J, Accarie C, Gueronniere V de la, Guillemant S (2002). Calcium in mineral water can effectively suppress parathyroid function and bone resorption.Nutr Res 22: 901-910.
Hullund J, Hatloy A, Benesi I and Thilsted SH (2008). Snacks are important for fat and vitamin intakes among rural African women: a cross-sectional study from Malawi. JClinNutr62:866-871.
Hegsted D, Major minerals. In: Goodheart,Shils, Meds (1973), Modern Nutrition in Health
and Disease. Philadelphia ;Lee and Febiger;275.
Holick MF( 2005) The vitamin D epidemic and its health consequences. JNutr135:2739S-2748S.
19
IOM (Institute of Medicine) (1997) Dietary Reference Intakes for Calcium, Phosphorus, Magnesium, Vitamin D, and Fluoride. Washington, DC: National Academy Press.
IOM (Institute of Medicine) (2011) Dietary Reference Intakes for Calcium and Vitamin D. Washington DC: National Academy Press.
Ireland P, Fordtran JS (1973) Effect of dietary calcium and age on jejunal calcium absorption
in humans studied by intestinal perfusion. J Clin Invest 52:2672–2681.
Iwamoto J, Yeh JK, Takeda T, and Sato Y (2004) Effect of vitamin D supplementation on calcium balance and bone growth in young rats fed normal or low calcium diet. Hormone
Research 61: 293-299.
Kanis JM, Melton LT, Christiansen C, Johnston CC,(1994).The diagnosis of osteoporosis.Int Bone Miner Res 918:1137-41.
Kiel DP, Felson DT, Hannan MT, Anderson JJ, Wilson PW(1990). Caffeine and the risk of
hip fracture: The Framingham Study. Am J Epidemiol 132:675–684.
KocianJ,Skala I and Bakos K (1973) Calcium absorption from milk and lactose free milk in
healthy subjects and patients with lactose intolerance. Lancet9:311-24.
Kurtz TW, Al-Bander HA, Morris RC(1987)―Salt sensitive‖ essential hypertension in men. N
20
Layrisse M, Martinez-Torres C, Mendez-castellano (1990) Relationship between iron
bioavailability from diets and the prevalence of iron deficiency. Food Nutr Bull12:301-9.
Luke B(1984) Principles of Human and Diet Therapy.USA; 101-106.
LuptonJR,Steinbach G, Chang WC(1996) Calcium supplementation modifies the relative
amounts of bile and acids in bile affects key aspects of human Colon physiology. J Nutr126:1421-8.
Maban LK, Stump SE(1996)Food, Nutrition and Diet Therapy. 9th Ed. WB Saunders Company, pp. 124-130.
Mackeown JM, Cleaton-Jones PE and Norris SA (2003)Nutrient intake among a
longitudinal group of urban black South African children at four interceptions between 1995 and 2000 (Birth-to-ten Study). Nutr Res23:185-197.
Miller GD(2000) Benefits of diary product consumption on blood pressure in humans: a summary of the biomedical Literature. J Am ClinNutr19:1475-645.
Minihane AM, Fox TE, Fair weather –Tait SJ. (1993) A continuous flow in-vitro method to
predict bioavailability of Fe from foods. In : BIOAVAILABILITY. Nutritional, Chemical and food processing implications of nutrient availability, proceedings part 2.
21
Norman AW(1979). Vitamin D: The calcium homeostatic steroid hormone. New York;
Academic Press.
Osweiler GD, Carson TL, Buck WB, (1985). Clinical and Diagnostic Veterinary Toxicology, 3rd ed. Dubuque,Iowa: Kendall/Hunt, pp. 471-5.
Pearce SH,Thakker RV (1997). The calcium sensing receptors; Insights into extracellular calcium homeostasis in health and disease . J Endocr154:3731-78.
Rasmussen LB, Hansen GL, Hansen GL, Hansen E(2000). Vitamin D; should the supply in
the Danish population be increased? Int. J Food Sci209-15.
Riggs BL and Melton LJ (1992)The prevention and treatment of osteoporosis. N Engl J Med
327:620-6.
Scrimshaw NS,MurryEB(1988) The acceptability of milk and milk products in populations
with a high prevalence of lactose intolerance. Amer JClinNutr 48: 1083-1159.
Srinivasan VS,(2001) Bioavailability of nutrients: a practical approach to in-vitro
demonstration of the availability of nutrients in multivitamin-mineral combination products.
J Nutr 131;4:1349S-50S.
22
Weaver C (1988) Isotopic tracer methodology: Potential in mineral nutrition. In: Smith
KT.ed, Trace minerals in foods. New York: Marcel Dekker:429-54.
Wolter MGE, Schreuder HAW, Heurel GVD, Lonkhuijsen HIV, Hermus RIJ, (1993) A continuous in-vitro method for estimation of the bioavailability of minerals and trace elements in foods: Application to breads varying in phytic acid content. Brit J Nutr
23
CHAPTER 2
BIOACCESSBILITY OF CALCIUM IN MORINGA OLEIFERA LEAVES
JOSEPH YOHANE ISSA
DEPARTMENT OF FOOD, BIOPROCESSING, AND NUTRITION SCIENCES
24
2.1Introduction
2.1.1 History and uses of Moringa oleifera
Moringa oleifera is the best known of the thirteen species of the genus Moringacae. Moringa oleifera was originated from India in some 5,000 years ago. Moringa is mainly grown in the tropical and sub-tropical regions of the world. Moringa grows well in the dry sandy soils but it also tolerates poor soils, including coastal areas. In the tropical regions of Asia, Africa and South America, Moringa leaves are eaten fresh by the local people. The leaves, fruits, flowers and immature pods of this tree are edible and they form a part of traditional diets in many countries of the tropics and sub-tropics (Siddhuraju et al., 2003). Apart from being
used for nutritional benefits, M. oleifera has a great potential as a medicinal plant (Ferreira et al., 2008). The flowers, leaves and roots are used for the treatment of ascites, rheumatism and venomous bites and as cardiac and circulatory stimulants in folk remedies (Anwar et al.,
2007). As a traditional food plant in Africa, M. oleifera vegetable has potential to improve nutrition, boost food security, foster rural development, and support sustainable land care. In
some parts of the world such as Senegal and Haiti, health workers have been treating malnutrition in small children, pregnant and nursing women with Moringa leaf powder (Price, 1985). An 8-g serving of dried leaf powder supplies a substantial portion of the daily
25
2.1.2 Moringa oleifera Nutrition
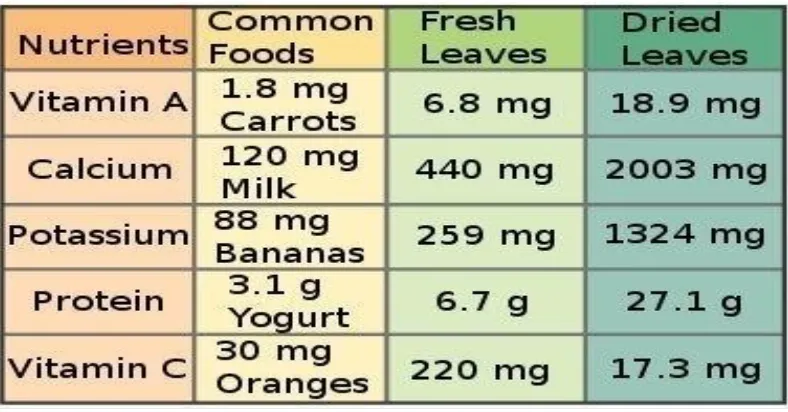
M. Oleifera has been reported in both scientific and popular literature as having numerous nutritional qualities. The leaves of M. oleifera are a good source of protein, vitamin A, B and C and minerals such as calcium and iron (Dahot, 1988).According to Trees for Life Organization, ―ounce for ounce, Moringa leaves contain more vitamin A than carrots, more calcium than in milk; more iron than spinach, more potassium than bananas, more vitamin C than oranges,‖ and the protein quality of Moringa leaves rivals that of milk and eggs.
Table 2.1: Nutrient comparison of M. oleifera leaves with other foods, per 100g.
Moringa oleifera: Natural Nutrition for the Tropics by Lowell Fuglie.
26
A research study on nutritional and functional properties of M. oleifera leaves by Yang et al., (2006), found that fresh mature leaves and fresh young shoots had 454±63mg and
82±31mg of calcium per 100g of sample respectively. In their previous study on in-vitro iron bioavailability, (Yung et al., 2002) found that boiling the fresh leaves and dried powder of M. oleifera enhanced the in-vitro iron bioavailability by 3.5 and 3 times respectively. The review of literature has shown evidence that there is high calcium content in M. oleifera plant materials; however there are no data on the bioavailability of calcium from the plant
materials. Many plants contain components such as dietary fiber and organic acids that limit calcium solubility and accessibility to digestive and absorptive processes. This research was
therefore designed to investigate the calcium bioavailability in M. oleifera plant leaves by measuring bioaccessibility using an in vitro simulated digestive system.
2.2Materials and Methods
Study Design.
The study on calcium bioaccessibility in M. oleifera plant materials was divided into four concepts as shown below.
1) Collection and preparation of samples.
2) Measurement of total calcium
3) Evaluation of calcium in-vitro digestibility
27
True bioavailability cannot be determined from this in vitro system because it does not distinguish between forms of calcium that can be absorbed by regulated active transport
processes and passive absorption, nor between retention and rapid renal excretion.
2.3.1 Sample collection and preparation
2.3.1.1 Sample collection
Green and mature Moringa leaf samples were collected from several trees (about 3 trees in each area) in low lying hot areas of Malawi where it grows naturally and the conditions are favorable for its growth. In these areas, average temperatures are 30 degrees Celsius. The temperature can reach up to 40 degrees Celsius in the dry season. The sample collection
areas, Lilongwe and Karonga, are along the lake shore of Lake Malawi and Shire River. These areas are generally hot and flat with sandy loam soils.
Some Moringa oleifera samples were bought in USA from an Internet distributor (MoringaSource.com). These commercial product samples were originally brought from India and sold in the United States. These powdered Moringa oleifara leaf samples were packed in aluminum foiled bags.
2.3.1.2 Sample preparation
Leaf samples from Malawi were air dried, pounded in a mortar into powder, packed in plastic bags and transferred to the Nutrition Technical Services Laboratory at North Carolina State University in USA for analysis. Commercial samples from India were also air dried, pounded
28
2.3.2 Evaluation of Total Calcium
Total calcium from the samples was determined by an atomic absorption spectrophotometer
(AAS). Powdered dry leaf samples were subjected to dry-ashing before the determination of calcium. A 0.1-g sample of each material was weighed and ashed at 525°C for 8hours. The ash was dissolved with 0.1% HCl and 0.5% lanthanum oxide (La2O3) followed by AAS
analysis to determine calcium content.
2.3.4 Evaluation of Calcium Digestibility
In order to determine calcium digestibility, in-vitro digestion was used. The Moringa oleifera
leaf powder was subjected to a simulated gastric phase followed by intestinal phase of
digestion. Pepsin enzyme from porcine gastric mucosa (Pcode 1000848645 Sigma-Aldrich, St. Louis, MO, USA) and hydrochloric acid was used in the gastric phase digestion. This was followed by pancreatic enzymes (pancreatin from porcine pancreas, P1750, Sigma-Aldrich)
and porcine bile extract (B8631, Sigma Aldrich) solution in the intestinal phase digestion. This method followed simulated digestion conditions.Figure1 below shows a flow diagram
29
30
1) Gastric digestion
Dissolve 0.2 g pepsin into 5 ml 0.1 N HCl
Measure the sample needed for test (0.1g).
Add 0.25 ml of the pepsin solution to the sample;
Adjust pH to 2.0 with HCl;
Incubate in a shaking water bath at 37 °C for 120 strokes per minute for 2 hours;
Place on ice for 10 minutes;
Raise pH to 7 by adding 1 M NaHCO3
2) Intestinal digestion
Dissolve 0.05 g pancreatin and 0.3 g bile extract in 25 mL 0.1 M NaHCO3
Add 1.25 mL of the pancreatin, bile extract, and lipase solution to each sample;
31
Place on ice for 10 minutes;
Adjust pH to 7.2 by addition of 0.5 M NaOH;
Bring to a common volume for all samples;
Filter the solutions under normal condition and analyze the filtrate of each sample by atomic absorption for calcium digested.
2.3.5 Gastric Digestion
Samples (0.1 g) each were measured and added to a 0.25 mL of pepsin solution in the digestion tubes. The pH of the samples was then adjusted to 2 by the addition of 6 N HCl.
The samples were then incubated in a shaking water bath at 37 °C for 2 hours in order to simulate the digestion process in the stomach. The samples were then placed on an ice bath
for 10 minutes in order to stop the pepsin digestion and then its pH was raised to 7 by adding NaHCO3 to prepare it for intestinal digestion.
2.3.6 Intestinal Digestion
32
Thereafter, samples were incubated in a shaking water bath at 37 °C for 2 hours and then placed on an ice bath for 10 minutes to stop the intestinal digestion. The pH of the samples
was adjusted to 7.2 by the addition of 0.5 M NaOH. Samples were then brought to a common volume by addition of distilled de-ionized water, filtered under normal conditions and the
filtrate of each sample was analyzed for digested calcium by an atomic absorption spectrometer.
2.3.7 Evaluation of Calcium Bioaccessibility
The bioaccessibility of calcium (defined as the low-molecular weigh soluble fraction in gastrointestinal fluids) in the samples was determined by simulated in-vitro absorption of calcium by using dialysis tubes. This involved the passive trans-membrane diffusion of calcium ions from one medium to another. A 10-mL portion of each sample (previously
digested) was loaded to the inside of dialysis tubing by pipettes. The outside compartment of the dialysis tubing of each sample was loaded with 25 mL solution of 0.9% NaCl with albumin. The samples were then dialyzed at room temperature for 24 hours. The volumes of
the solution outside and inside the dialysis tubing were measured and emptied in separate test tubes for calcium analysis. Calcium was analyzed by atomic absorption and the calcium that
33
Load 10 mL(previously digested material) sample to the inside of the dialysis tubing carefully by using a pipette;
Slowly withdraw the pipette as dispensing;
Fill the outside of the Floatalyzer™ G2 apparatus (Spectrum Laboratories, Inc., Rancho Dominquez, CA) with 25 mL solution of 0.9% NaCl with 0.1% bovine serum albumin;
Screw the cap back in place to create a closed seal;
Dialyze at room temperature for 24 hours;
Measure the volumes inside and outside of the dialysis tubing after dialysis;
Transfer contents inside and outside of the dialysis tubing into separate test tubes for calcium analysis;
Run atomic absorption analysis for calcium in the solutions
Figure 2. A diagram for an in-vitro calcium bioaccessibility.
2.3.8 Calculation of calcium bioaccessibility
34
2.3.9 Data Analysis
SAS software (Cary, NC) was used to statistically analyze the data. This software was used
to see the relationship between the Moringa oleifera samples from Malawi and the other from India. It was also used to see the mean differences between Moringa oleifera, sweet potato leaves, and spinach in terms of calcium content, digestibility and bioaccessibility. Tukey’s Studentized Range (TSR) test was used to determine whether or not significant
differences existed in the mean values of the sample calcium content, digestibility and bioaccessbility at P ≤ 0.05.
2.4 Results
The results were categorized into three groups; percentage calcium content, percentage digested calcium and percentage dialyzed calcium.
2.4.1 Calcium content
Calcium content of Moringa oleifera samples and the control samples, spinach and sweet potato leaves are provided in Table 2.2
Calcium from the samples was expressed as percentage of the dry matter. The results of
35
However, among the three Moringa oleifera samples, there was a significant difference in the percentage calcium content (P< 0.05) using Tukey’s Studentized Range Test at α=0.05.
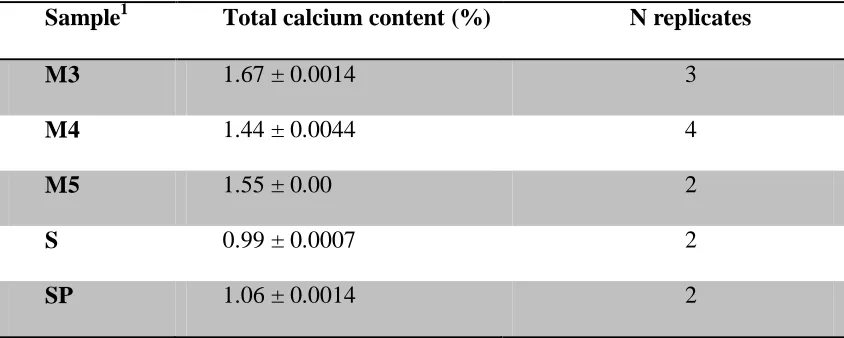
The mean percentage calcium was 1.67 ± 0.0014, 1.44 ± 0.0014 and 1.55 ± 0.00 for Moringa oleifera samples from India (M3), from Karonga, Malawi (M4) and another sample from Lilongwe, Malawi (M5) respectively. The mean percentage calcium in spinach and sweet potato leaves were 0.99 ± 0.0007, and 1.06 ± 0.0014 respectively.
Table 2.2: Total calcium content from Moringa oleifera, spinach and sweet potato leaves (mean ± standard deviation of 2-4 replicates per sample).
Sample1 Total calcium content (%) N replicates
M3 1.67 ± 0.0014 3
M4 1.44 ± 0.0044 4
M5 1.55 ± 0.00 2
S 0.99 ± 0.0007 2
SP 1.06 ± 0.0014 2
1
36
2.4.2 Calcium Digestibility
The digested calcium from Moringa oleifera samples and the control samples, spinach and sweet potato leaves are provided in Table 2.3.
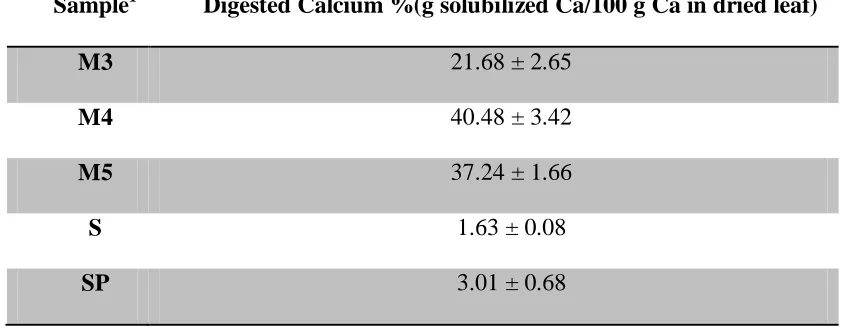
Digestibility of calcium from the samples was expressed as percentage of the calcium in dry matter that was solubilized by the digestion procedure. The digestibility results were found
from the three Moringa oleifera samples and the control samples; spinach and sweet potato leaves. The entire digestion procedure was replicated three times, using triplicate samples in
each replicate. The results indicated that Moringa oleifera samples had higher digested calcium than spinach and sweet potato leaves. Using Tukey’s Studentized Range Test at
α=0.05, there was no significant difference in total digested calcium between the two samples
from Malawi, M4 and M5. However, there was a significant difference in percentage digested calcium between Moringa oleifera samples from India and Malawi (P < 0.05). The mean percentage digested calcium was 21.68 ± 2.65, 40.48 ± 3.42 and 37.24 ± 1.66% for
37
Table 2.3: Calcium digestibility from Moringa oleifera, spinach and sweet potato leaves.
(Mean ± SD; N = 3 replicate experiments on triplicate samples.)
Sample1 Digested Calcium %(g solubilized Ca/100 g Ca in dried leaf)
M3 21.68 ± 2.65
M4 40.48 ± 3.42
M5 37.24 ± 1.66
S 1.63 ± 0.08
SP 3.01 ± 0.68
1
Samples: M3= Moringa sample from India, M4= Moringa sample from Karonga, Malawi, M5= Moringa sample from Lilongwe, Malawi, S= spinach, SP= sweet potato leaves.
2.2.3 Bioaccessibility of Calcium
The bioaccessibility of calcium from Moringa oleifera samples and the control samples, spinach and sweet potato leaves are provided in Table 2.4
Bioaccessability of calcium from the samples was expressed as percentage of the dry matter. Bioaccessible calcium was equivalent to dialyzable calcium. The bioaccessibility results
38
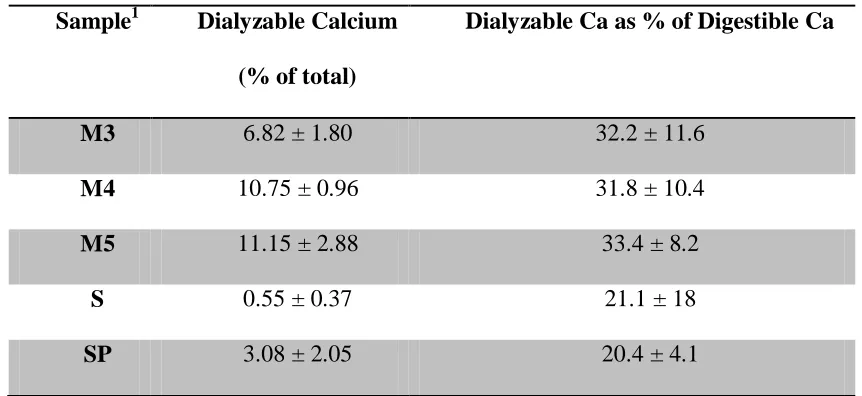
Using Tukey’s Studentized Range Test at α=0.05, there was no significant difference in dialyzable calcium between Moringa oleifera samples from Malawi, and Moringa oleifera
sample from India.
Also, there was no significant difference in percentage dialyzable calcium between Moringa oleifera samples from India and Malawi (P < 0.05). The mean percentage dialyzable calcium was 6.82±1.80, 10.75±0.96 and 11.15 ±2.88 for Moringa oleifera samples from India (M3), from Malawi (M4) and the second sample from Malawi (M5) respectively. The mean percentage dialyzable calcium in spinach and sweet potato leaves were 0.55±0.37, and 3.08±2.05 respectively.
Table 2.4 also shows the percentage of the digestible calcium that was dialyzable. Several samples were deleted from this calculation because the calcium concentration in the dialysate was too low for accurate measurement. Despite the substantial variation in the data, the table
shows that about one third of the digestible calcium was dialyzable in the Moringa samples, which was about 50% greater than the dialyzability of the digestible calcium in spinach or
39
Table 2.4: Calcium bioaccessibility from Moringa oleifera, spinach and sweet potato
leaves
Sample1 Dialyzable Calcium
(% of total)
Dialyzable Ca as % of Digestible Ca
M3 6.82 ± 1.80 32.2 ± 11.6
M4 10.75 ± 0.96 31.8 ± 10.4
M5 11.15 ± 2.88 33.4 ± 8.2
S 0.55 ± 0.37 21.1 ± 18
SP 3.08 ± 2.05 20.4 ± 4.1
1
Samples: M3= Moringa sample from India, M4= first Moringa sample from Karonga, Malawi, M5= second Moringa sample from Lilongwe, Malawi, S= spinach, SP= sweet
potato leaves.
2.5 Discussion
The in-vitro methods for assessing the bioaccessibility of essential minerals are widely used because they are simple, fast, and inexpensive. These methods have been used in different
40
In their study, fresh vegetables were prepared by blanching in boiling deionized water for three minutes followed by homogenization in a food processor whereas seed and pod
samples were cooked and homogenized in an electric blender and all the samples were stored in polyethylene bottles at -20oC before analysis.
In our study however, Moringa oleifera leaf samples were air dried, pounded into powder and stored in polyethylene bags before being subjected to chemical analysis. The present
study assessed calcium content, digestibility and bioaccessibility in Moringa oleifera leaf powder from Malawi and India; spinach and sweet potato leaf powder were used as controls. Bioaccessibility of calcium was determined from dialyzed or absorbed calcium using dialysis
tubing. As observed from the results, there was a statistically significant difference in percentage calcium content from the Moringa oleifera samples from India and the two samples from Malawi. This may be due to differences in the growing conditions because some soils have higher amounts of calcium. The digested calcium in the two Moringa oleifera samples from Malawi was statistically similar and different from Moringa oleifera
sample from India. This may be due to similar growing conditions for the samples from Malawi and different growing conditions with samples from India, or due to genetic drift in
41
However, dialyzed calcium from all the Moringa oleifera samples was significantly higher than the control samples of spinach and sweet potato leaves. A study by Kamchan et al.,
(2004) that used in-vitro methods to study calcium dialyzability from different vegetables found percentage dialyzable calcium in kale, celery and Chinese cabbage to be 38.9 ± 2.1,
36.2 ± 4.1 and 32.2 ± 4.6 respectively. This may be due to different chemical and biological composition of these plants that inhibit absorption of calcium such as phytate, oxalate, and dietary fiber.
Ezeike et al., (2011) were able to extract 0.28 mg of oxalate per gram of dry matter from
Moringa oleifera, and cited data to calculate that spinach contains 100 mg oxalate per gram of dry matter. Oxalic acid in fresh sweet potato leaves was 3 to 5 mg per gram fresh weight, or about 16 to 27 mg per gram of dry matter (Almazan, 1995). The results from the present
study are different from those found by Kamchan probably due to the use of different species of plants and different sample preparatory methods. In an in-vitro iron bioavailability study, Yung et al., (2002), found that boiling the fresh leaves and dried powder of Moringa oleifera
enhanced the in-vitro iron bioavailability by 3.5 and 3 times respectively. A similar preparatory method would enhance the calcium bioaccessibility in our study.
42
The present study has found the percentage calcium content in powdered Moringa oleifera
leaves to be 1.67 ± 0.0014, 1.44 ± 0.0014 and 1.55 ± 0.00 for samples from India (M3), from
Karonga, Malawi (M4) and from Lilongwe, Malawi (M5) respectively. If we translate these results per 100-g edible sample, it yields 1.67 g (1670 mg), 1.44 g (1440 mg) and 1.55 g
(1550 mg) for M3, M4 and M5 respectively, averaging 1553 mg/100 g. These results are not very different from that of Price (1985) for the leaf powder which was 2003 mg per 100-g sample. The current calcium RDA for pregnant and lactating women are 1300 mg/day and
1000 mg/day for women aged 14-18 years and 19-50 years respectively (IOM, 2011).
A dietary intake study undertaken in Malawi, Africa, showed that calcium intakes from
women was lower than the recommended intakes with average intakes of 620 mg/day and 622 mg/day for non-lactating women and lactating women respectively.
Another nutrient intake study conducted in South Africa in three ethnic groups (black,
white and mixed ancestry subjects) found that mean dietary calcium was higher in white subjects than in black and mixed ancestry subjects; however, calcium intake was low in all
the groups with about half of the DRI of 1000 mg/day (Charlton et al., 2005). If the dietary intake of Moringa oleifera is increased, calcium intake could also be tremendously increased, especially in the developing countries like Malawi where these trees grow with little care.
43
According to our study, only 64 g of dried leaf powder would supply the 1000 mg/day RDA. From this intake, 330 mg of calcium are estimated to be digestible, and 96 mg of calcium are
estimated to be bioaccessible, or available for absorption, based on the average of the
Moringa oleifera plant samples tested in our study.
2.6 Conclusion
The percentage dialyzed calcium is higher in Moringa oleifera leaves than other vegetable sources such as spinach and sweet potato leaves. Percentage dialyzed calcium of Moringa oleifera grown in Malawi is slightly higher than that grown in India. Because there is evidence from related research that percentage calcium dialyzability differs in different foods, especially vegetable foods due to presence of different inhibitory components, I
44
2.7 References
Almazan AM (1995) Antinutritional factors in sweet potato greens. J Food Comp Anal 8: 363-368.
Dahot MU, and Memon AR (1985). Nutritive significance of oil extracted from Moringa oleifera seeds. J Pharm University Karachi 3(2):75-80. NUT
Ezeike CO, Aguzue OC,Thomas SA (2011) Effect of brewing time and temperature on the
release of manganese and oxalate from Lipton tea and Azadirachta indica(Neem),
Phyllanthus amarus and Moringa oleiferablended leaves. J Appl Sci Envir Manag 15:175-177.
Ferreira PMP, Farias DF, Oliveira JTA, Carvalho AFU (2008) Moringa oleifera: bioactive compounds and nutritional potential. Revista de Nutricao Campinas 21: 431-437.
Fuglie JL (2005). The Miracle Tree: a local solution to malnutrition? Church World Services in Senegal.
Kamchan A, Puwastien P, Sirichakwal PP and Kongkachuichai R, (2004)In vitro calcium bioavailability of vegetables legumes and seeds. J Food Comp Anal17:311-320.
Muluvi GM, Sprent JI, Soranzo N, Provan J, Odee D, Folkard G, Mcnicol JW, Powell W (1999) Amplified fragment length polymorphism (AFLP) analysis of genetic variation in
45
Oduro I, Ellis WO, and Owusu D (2008) Nutritional potential of two leafy vegetables:
Moringa oleifera and Ipomea batatas leaves. Sci Res and Ess 3(2): 57-60.http://www.academicjournals.org/SRE
Price ML, (1985). The Moringa Tree. ECHO Technical Note. Educational Concerns for
Hunger Organization, N. Ft. Meyers, FL. http://echonet.org/repositories - 110:d:The Moringa
Tree cited 12/06.2011
Siddhuraju P, Becker K (2003) Antioxidant properties of various solvent extracts of total phenolic constituents from three different agroclimatic origins of drumstick tree (Moringa oleifera Lam.) leaves. J Agric Food Chem 51:2144-2155. NUT
Trees for Life (2005)
Moringa Book.http://www.treesforlife.org/project/moringa/book/default.asp. Nut Gen
Yang RY, Tsou SCS, and Lee TC(2002)Effect of cooking on in vitro iron bioavailability of
various vegetables.p130-142. In TC Lee and CT Ho (eds.), Bioactive compounds in foods: effect of processing and storage. American Chemical Society, Washington, D.C.
Yang RY, Chang LC, Hsu JC ( 2006) Nutritional and Functional Properties of Moringa
46
47
Appendix 1-SAS output data for percentage Calcium content in M3, M4 and M5
The SAS System
The ANOVA Procedure
Class Level Information
Class Levels Values
GROUP 3 1 2 3
Number of Observations Read 6
Number of Observations Used 6
The SAS System
The ANOVA Procedure
Dependent Variable: M345 M345
Source DF
Sum of Squares
Mean
Square F Value Pr > F
Model 2 0.053829 0.026915 20186 <.0001
Error 3 0.000004 1.33E-06
Corrected Total 5 0.053833
R-Square Coeff Var Root MSE M345 Mean
0.999926 0.074289 0.001155 1.554333
Source DF Anova SS
Mean
Square F Value Pr > F
48 The SAS System
The ANOVA Procedure
Tukey's Studentized Range (HSD) Test for M345
Note: This test controls the Type I experimentwise error rate, but it generally has a higher Type II error
rate than REGWQ
Alpha 0.05
Error Degrees of Freedom 3
Error Mean Square 1.33E-06
Critical Value of Studentized Range 5.90959 Minimum Significant Difference 0.0048
Means with the same letter are not significantly different.
Tukey Grouping Mean N GROUP
A 1.671 2 1
B 1.553 2 3
C 1.439 2 2
49 The SAS System
The ANOVA Procedure
Scheffe's Test for M345
Note: This test controls the type 1 experimentwise error rate
Alpha 0.05
Error Degrees of Freedom 3
Error Mean Square 1.33E-06
Critical Value of F 9.55209
Minimum Significant Difference 0.005
Means with the same letter are not significantly different.
Scheffe Grouping Mean N GROUP
A 1.671 2 1
B 1.553 2 3
C 1.439 2 2
Note: A=M3, B=M4, C=M5
50
Appendix 2: SAS output data for % Digested Calcium in M3, M4, M5.
The SAS System
The ANOVA Procedure
Class Level Information
Class Levels Values
Sample 3 M3 M4 M5
Number of Observations Read 9
Number of Observations Used 9
The SAS System
The ANOVA Procedure
Dependent Variable: M345 M345
Source DF
Sum of
Squares Mean Square
F
Value Pr > F
Model 2 606.150749 303.0753745 42.37
0.000 3
Error 6 42.9212402 7.15354
Corrected Total 8 649.0719892
R-Square CoeffVar Root MSE M345 Mean
0.933873 8.073 2.67461 33.13209
Source DF Anova SS Mean Square
F
Value Pr > F
Sample 2 606.150749 303.0753745 42.37
51 The SAS System
The ANOVA Procedure
Tukey's Studentized Range (HSD) Test for M345
Note: This test controls the Type I experimentwise error
rate, but it generally has a higher Type II error rate than REGWQ
Alpha 0.05
Error Degrees of Freedom 6
Error Mean Square 7.15354
Critical Value of Studentized Range 4.33902
Minimum Significant Difference 6.7003
Means with the same letter are not significantly different.
Tukey Grouping Mean N sample
A 40.481 3 M4
A 37.237 3 M5
52 The SAS System
The ANOVA Procedure
Scheffe's Test for M345
Note: This test controls the Type I experimentwise error rate.
Alpha 0.05
Error Degrees of Freedom 6
Error Mean Square 7.15354
Critical Value of F 5.14325
Minimum Significant Difference 7.004
Means with the same letter are not significantly different.
Scheffe Grouping Mean N sample
A 40.481 3 M4
A 37.237 3 M5
53 The SAS System
The ANOVA Procedure
Class Level Information
Class Levels Values
Sample 3 M3 M4 M5
Number of Observations Read 9
Number of Observations Used 9
The SAS System
The ANOVA Procedure
Dependent Variable: M345 M345
Source DF
Sum of
Squares Mean Square
F
Value Pr > F
Model 2 34.0936764 17.0468382 4.26
0.070 6
Error 6 24.01240923 4.0020682
Corrected Total 8 58.10608563
R-Square CoeffVar Root MSE M345 Mean
0.586749 20.92 2.000517 9.564889
Source DF Anova SS Mean Square
F
Value Pr > F
Sample 2 34.0936764 17.0468382 4.26
54 The SAS System
The ANOVA Procedure
Tukey's Studentized Range (HSD) Test for M345
Note: This test controls the Type I experimentwise error rate, but it generally has a higher Type II error rate than REGWQ
Alpha 0.05
Error Degrees of Freedom 6
Error Mean Square 4.002
Critical Value of Studentized Range 4.339
Minimum Significant Difference 5.012
Means with the same letter are not significantly different.
Tukey Grouping Mean N sample
A 11.15 3 M5
A 10.72 3 M4
55 The SAS System
The ANOVA Procedure
Scheffe's Test for M345
Note: This test controls the Type I experimentwise error rate.
Alpha 0.05
Error Degrees of Freedom 6
Error Mean Square 4.002
Critical Value of F 5.143
Minimum Significant Difference 5.239
Means with the same letter are not significantly different.
Scheffe Grouping Mean N sample
A 11.15 3 M5
A 10.72 3 M4
56
Appendix 4- Raw Data for percentage Calcium content, %digested Calcium and %dialyzed Calcium
Samples
Initial inside
(ml) Initial outside (ml) Initial Ca Initial Ca(mg)
Final
Outside Final
A.A (ppm)
Ca A.A
(ppm) Volume(ml)
S 1-1 10 25 0.6 0.0067 0.1 35
S 1-2 10 25 0.5 0.0056 0.1 35
S.P 2-1 10 25 1.6 0.0178 0.1 35
S.P 2-2 10 25 1.3 0.0144 0.1 35
M 3-1 10 25 3.6 0.04 0.2 35
M 3-2 10 25 3.9 0.0428 0.2 35
M 4-1 10 25 11.1 0.1233 0.4 35
M 4-2 10 25 5.8 0.0639 0.3 35
M 5-1 10 25 4.9 0.0544 0.4 35
M 5-2 10 25 5.3 0.0583 0.4 35
57 Final Dialyzed
Ca (mg)
Ca Dialyzed
(%) Ca Digested(%) Ca Dialyzed of Dry matter(%)
Average dialyzed(%)
0.0039 58.33 1.6852 0.9830
0.9830
0.0039 70.00 1.4043 0.9830
0.0039 21.88 4.1850 0.9155
0.9155
0.0039 26.92 3.4003 0.9155
0.0078 19.44 23.9091 4.6490
4.6490
0.0078 18.18 25.5695 4.6490
0.0156 12.61 85.7673 10.8175
9.4653
0.0117 18.26 44.4290 8.1131
0.0156 28.57 35.6079 10.1737
10.1737
58 Samples Initial inside (ml)
Initial outside (ml)
Initial Ca A.A
(ppm) Initial Ca(mg) Final Inside Final
Ca A.A (ppm)
Volume(ml)
S 1-1 10 25 0.6 0.0067 0.8 4.9
S 1-2 10 25 0.5 0.0056 0.8 5.3
S.P 2-1 10 25 1.6 0.0178 3.1 4.1
S.P 2-2 10 25 1.3 0.0144 2.5 4.5
M 3-1 10 25 3.6 0.04 6.2 4
M 3-2 10 25 3.9 0.0428 6.5 4.3
M 4-1 10 25 11.1 0.1233 20.9 3.5
M 4-2 10 25 5.8 0.0639 11.1 4
M 5-1 10 25 4.9 0.0544 8.2 4
M 5-2 10 25 5.3 0.0583 8.1 4.5