Spectrum Sensing for Tactical Cognitive
Radio
Sachin T. C. M1, Subha P. Eswaran 2, Shrividya G.3
M.Tech Student, Dept. of Electronics and Communication, NMAM Institute of Technology, Nitte, Karkala, Karnataka,
India1
Senior Research Staff Member, CRL- Bharat Electronics Limited, Bangalore, India 2
Associate Professor, Dept. of Electronics and Communication, NMAM Institute of Technology, Nitte, Karkala,
Karnataka, India3
ABSTRACT:The rapid growth in the users of modern wireless data communications demands the additional bandwidth. To overcome this constraint of additional bandwidth, utilization of underutilized spectrum of the licensed spectrum is very much important. The traditional tactical radios are configured to operate with in a pre-defined portion of Radio Frequency spectrum. This approach limits the radio’s ability to take the advantages of unused spectrum resources and to avoid unintentional jamming by friendly forces or intentional jamming by adversaries and it also faces the fear of hacking. Thus it is necessary to build the tactical radio that can dynamically sense, classify and coordinate access to the spectrum for more improved performance and robust operations. Cognitive Radio(CR) system breaks the traditional rules of strictly regulated wireless communication and spectrum allocation with the main goal to improve the overall spectrum utilization and efficiency. Spectrum sensing has gained attention with CR and opportunistic spectrum access concepts. Hence customized spectrum sensing approaches are required to meet cognitive tactical communication. Such technique called Energy detector will be analyzed for the tactical radios will be presented in this project work.
KEYWORDS: Cognitive Radio, Tactical communication.
I. INTRODUCTION
Cognitive Radio (CR) is widely considered as a promising technology for providing the mechanisms to solve the spectrum resource challenge on the modern battlefield, caused by the current inflexible spectrum allocation policy [1]. Tactical Radio networks are largely affected by interference as they operate in a dynamically changing environment, where radio parameters and network configuration are not same all time. CRs, which have environment sensing and transmission adaptation capabilities, can address the dynamic nature of the network, thereby increases performance of a modern tactical communication system [5]. CR communications platforms may be ideal candidates for future tactical networks. CR changes its transmitter parameters as changes in SDR according to the spectrum availability.The main challenge associated with the tactical communication will be unknown radio environment which dynamically changes every time. The traditional white space sensing methods which relay on known waveform patterns will not be applicable for tactical communication
II. OBJECTIVE OF THE PROJECT
Implementationof Energy Detection spectrum sensing technique for Tactical Cognitive Radio.
III. CHALLENGES AND ISSUES IN TACTICAL COGNITIVE RADIO
i. Channel Uncertainty
Cognitive Radios have to be more sensitive to avoid the wrong interpretation of secondary user as primary user at the interference range of the secondary users; tactical cognitive radios can differentiate primary user affected by fading and shadowing.
Figure 1: Sensing time and user throughput[2]
Under the severe fading it is very difficult to the single cognitive radio that relay on the local sensing to achieve increased sensitivity this can be solved by cooperative sensing.
ii. Noise Uncertainty
Minimum SNR value defines the sensitivity factorat which the primary signal can be accurately detected by the cognitive radio and is given by [2]
= ( + ) (1)
is transmitted power, N is is the noise power, D is the range of interference of the secondary system, R is maximum distance of primary transmitter and it receiver.
To calculate the detection sensitivity, noise power has to know. The receiver should estimate the noise power but it is very difficult in practice. Because of this reason Tactical Cognitive Radio(TCR) does not fulfil the sensitivity requirement. Sensitivity requirement can be fulfilled by considering the worst case noise.
iii. Aggregate Interference Uncertainty
The widespread deployment of secondary systems increases the number of TCR networks that try to operate on the same licensed band. Due the unknown number of secondary users and their locations spectrum sensing is affected. Hence the detector should be more sensitive, such that, it should be able to detect the primary systems even in the strong interference from the secondary systems.
iv. Spectrum Sensing
This gives the idea about whether the primary signal is present or not in the spectrum which we are observing. By this the best available channel in nearby environment is obtained. This is the main goal and the challenge of the tactical cognitive radio.
IV. CLASSIFICATION OF SPECTRUM SENSING TECHNIQUES
Figure 4.2: Classification of spectrum sensing methods[5]
In this paper Energy Detection(ED) is considered and analysed.
V. ENERGY DETECTION
Energy detection is simple and easy to implement technique. This technique does not need the prior knowledge of the primary user. This technique performs well with dispersive channels and it takes very less time to give results. The received is filtered with noise filter. The filtered signal is sent through analog to digital converter. The output is squared to find the energy of the received signal. The output of the squaring block is averaged using integrator. The output is compared with the threshold to decide whether the signal is present or not.
Figure 2.1: Block Diagram of a Simple Energy Detector [2]
Energy detection compares the energy of the received signal in a certain frequency band to a threshold value(γ) which
is defined according to the SNR, to derive the two binary hypothesis; whether the signal present or not.
VI. IMPLEMENTATION
The implementation of Energy Detector(ED) requires the Power Spectral Density (PSD), Probability of Detection ( ), Probability of False alarm ( ). In this simulation, the performance of the ED has taken at different SNRs by declaring
of the channel.
Steps in the implementation are as follows
Step 1: Declare the sampling frequency, length of the sequence, time.
Step 2: Declare the Probability of False alarm( ), set of SNRs at which performance of the ED is to be find. Performance is measured with respect to Probability of Detection( ).
Step 3: Consider the random number generator to consider the noise factor.
Step 4: Convert the SNR dB values to linear values and multiply the result with the cosine signal which is now considered as the Primary user signal for the experimental purpose.
Step 6: Find the energy and average energy of the signal. Step 7: Find the threshold using the inverse Q function. Step 8: Compare the threshold and average energy. Step 9: plot the Probability of Detection versus SNR dB.
VII. RESULTS
1. Energy detection without modulation
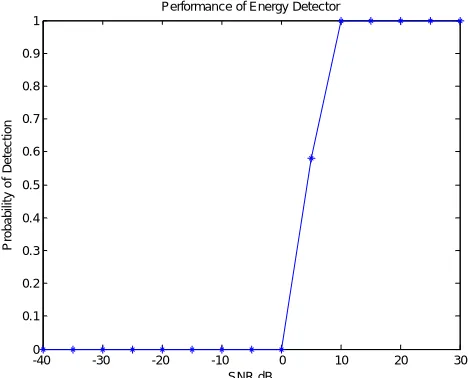
1) Under the presence of primary user
Figure 3: When primary user is present
Figure 3 shows that, when primary user is present the ED is performing well even at the lower SNR values and it is showing 100 percent detection from -10 dB. From this simulation we can understand that ED is the good performer at lower SNR values and the computation of this is also easy.
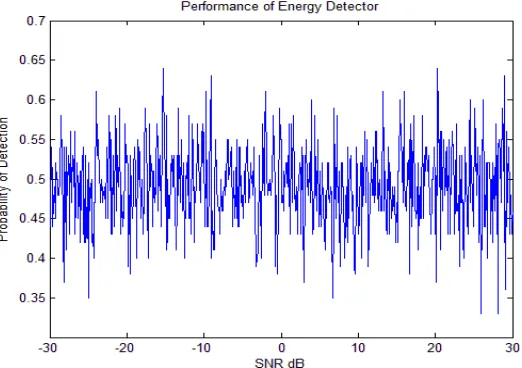
2) Under the absence of primary user
Figure 4 shows that ED is still shows detection even the primary user is not present. This can be known by observing the peak at different SNR values. Even though the primary user is absent the ED is showing 60 percent detection from this it becomes difficult to distinguish whether the primary user is present or not. Hence ED is not good performer when there is no primary user.
2. Energy detection with BPSK modulation
1) Periodogram of the BPSK signal with Energy detector at 30dB SNR
Figure 5:Periodogram of the BPSK signal at 30 dB
In figure 5 the periodogram of the BPSK signal showing peak exactly at the 1.8 kHz and it has the power between 30-40 dB. This means the primary military user is present at 1.8 kHz. This is signal is being used for the energy detection.
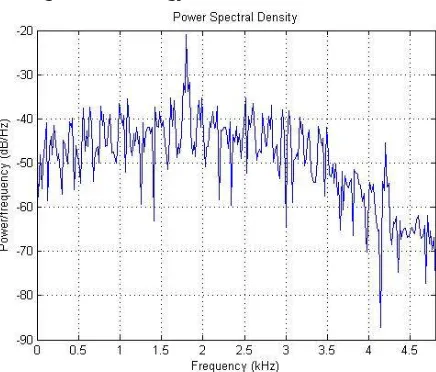
2) Periodogram of the BPSK signal with Energy detector at -30dB SNR
In figure 6 shows theperiodogram of the BPSK signal showing peak exactly at the 1.8 kHz and it has the power between -30 to -20 dB. This means the primary military user is present at 1.8 kHz. This is signal is being used for the energy detection.
Figure 7: Probability of Detection Vs Signal to noise Ratio (ED)
3) Energy detection with BPSK modulation
Figure 7 shows Probability of Detection versus Signal to noise Ratio when Primary User is present. The random bits are BPSK modulated and then sent through Additive White Gaussian Noise (AWGN) channel. The output from the AWGN channel is sensed using ED method. ED method is performing even well in the lower SNR region.
VIII. CONCLUSION
Energy Detector(ED) is easy to implement, performs well in higher SNR values. ED is not good performer at lower SNR values and when primary user is absent. To overcome this drawback of ED the matched filter detection and cyclostationary feature detection can be used. Energy detection method can be still improved.
REFERENCES
[1] Helen Tang, Susan Watson, “Cognitive radio networks for tactical wireless communications", DRDC – Ottawa Research Centre, 2014.
[2] MansiSubhedar, GajananBirajdar, “SPECTRUM SENSING TECHNIQUESIN COGNITIVE RADIO
NETWORKS:ASURVEY",International Journal ofNext-Generation Networks (IJNGN), Vol.3, No.2, pp. 37-51, 2011.
[3] Anita Garhwal, ParthaPratim Bhattacharya, “A Survey on Spectrum SensingTechniques in Cognitive Radio” International Journal of
Computer Science &Communication Networks, Vol 1(2), pp. 196-206, 2011.
[4] ZhaiXuping, Pan Jianguo, “Energy-detection based spectrum sensing for cognitiveradio," inWireless, Mobile and Sensor Networks, IET
Conference, pp. 944-947, 2007.
[5] Mahmood A. Abdulsattar, Zahir A. Hussein, “ENERGY DETECTION TECHNIQUEFOR SPECTRUM SENSING IN COGNITIVE RADIO:
A SURVEY", InternationalJournal of Computer Networks & Communications (IJCNC), Vol.4, No.5, pp. 223-242, 2012.
-40 -30 -20 -10 0 10 20 30
0 0.1 0.2 0.3 0.4 0.5 0.6 0.7 0.8 0.9 1
Performance of Energy Detector
![Figure 1: Sensing time and user throughput[2] Under the severe fading it is very difficult to the single cognitive radio that relay on the local sensing to](https://thumb-us.123doks.com/thumbv2/123dok_us/1518542.1186071/2.595.126.496.263.423/figure-sensing-throughput-severe-fading-difficult-cognitive-sensing.webp)
![Figure 4.2: Classification of spectrum sensing methods[5]](https://thumb-us.123doks.com/thumbv2/123dok_us/1518542.1186071/3.595.84.503.524.565/figure-classification-spectrum-sensing-methods.webp)