ABSTRACT
PRADHAN, ANU RAJ. Infrastructure Management Information System Framework for Disasters. (Under the direction of Dr. Debra F. Laefer)
INFRASTRUCTURE MANAGEMENT INFORMATION SYSTEM
FRAMEWORK FOR DISASTERS
BY
ANU RAJ PRADHAN
A THESIS SUBMITTED TO THE GRADUATE FACULTY OF NORTH CAROLINA STATE UNIVERSITY
IN PARTIAL FULFILLMENT OF THE REQUIREMENTS FOR THE DEGREE OF
MASTER OF SCIENCE
DEPARTMENT OF CIVIL, CONSTRUCTION, AND ENVIRONMENTAL ENGINEERING
RALEIGH JULY 2003
APPROVED BY:
DEDICATION
BIOGRAPHY
Anu R. Pradhan was born in Kathmandu, Nepal. He came to North Carolina State University to pursue
his M.S. in Civil Engineering in 2001. His interests are in geographical information systems and
ACKNOWLEDGMENTS
I would like to thank Dr. Debra F. Laefer, chair of my advisory committee, for her wonderful support,
guidance, and patience throughout the course of this work. I am also grateful to Dr. William Rasdorf,
co-chair of my advisory committee, for his help. Lastly, I would like to thank Dr. Yu-Fai Leung,
TABLE OF CONTENTS
LIST OF TABLES... vii
LIST OF FIGURES ...viii
1. INTRODUCTION ... 1
2. LITERATURE REVIEW ... 4
2.1 Existing Systems... 5
2.2 Ideal System Requirements... 8
3. ENTERPRISE GIS ARCHITECTURE... 10
3.1 Backend Database System (Data Tier) ... 11
3.1.1 Importance of Standard Data Format and Retrieval Mechanism... 12
3.1.2 Importance of Integrated Repository System ... 13
3.1.3 Challenges of Integrated Repository System... 14
3.2 Middleware System (Business Logic Tier)... 15
3.3 Parallel and Distributed Computing... 17
3.3.1 Parallel Algorithms Implementation... 19
3.4 Customized Client Applications ... 20
4. NC STATE DISASTER MANAGEMENT SYSTEM... 22
4.1 Database Server (Data Tier)... 22
4.2 Application Server (Business-logic Tier) ... 24
4.3 NCSU Customized Client Application ... 25
4.3.1 Features of NCSU Client Application ... 26
4.4 Parallel Computing ... 33
5. FUTURE RESEARCH RECOMMENDATIONS ... 36
5.1 Service-oriented Inter-agency Participation Framework ... 36
5.2 Accommodation of GPS Handheld Devices in Enterprise System ... 39
5.2.1 Web Service Framework... 39
5.2.2 Platform Independent Code ... 40
5.3 Disaster specific analysis capabilities... 40
6. CONCLUSION... 41
7. REFERENCES ... 42
8. APPENDICES ... 45
8.1 DESIGN OF DATA MODEL ... 45
8.1.1 Requirements Analysis ... 45
8.1.1.1 Representation of Requirements Analysis ... 46
8.1.2.2 Representation of ER Model... 50
8.1.3 ER – to – Relational Mapping ... 53
8.1.3.1 Regular entity types ... 54
8.1.3.2 Weak entity types... 54
8.1.3.3 1:1 Relationships... 55
1:N Relationships... 55
8.1.3.4 Multi-valued attribute ... 55
8.2 SQL CODE ... 58
8.2.1 SQL Code for creating tables... 58
LIST OF TABLES
LIST OF FIGURES
Figure 1 Disaster Community Need ... 5
Figure 2 Disaster Preparedness Phases ... 6
Figure 3 Types of Generic System Architecture... 10
Figure 4 NCSU 3-Tiered System Architecture Design... 11
Figure 5 Middleware (adapted from Bernstein 1996)... 15
Figure 6 UML Conceptual Schema for IMIS Database... 24
Figure 7 Customized GIS Application... 26
Figure 8 Popup Menu for Adding/Updating/Deleting Building Information... 27
Figure 9 GUI Frame to Enter Building Information... 28
Figure 10 Error-Checking Mechanism ... 29
Figure 11 Query Interface... 30
Figure 12 Façade Query GUI... 31
Figure 13 Query Results ... 32
Figure 14 Displayed Query Results ... 33
Figure 15 Speedup Graph for Parallel Dijkstra & Parallel Floyd-Warshall Algorithms ... 35
Figure 16 Interagency Participation Network... 37
Figure 17 SOA Components... 37
Figure 18 Data Modeling Process... 45
Figure 19 Use Case Modeling for Data Entry/Update/Delete ... 47
Figure 20 Use Case Modeling for Querying Database ... 48
Figure 21 Notations for ER diagrams (adapted from Elmasri and Navathe 2000)... 52
Figure 22 ER Diagram for the NCSU IMIS Project ... 53
CHAPTER 1
INTRODUCTION
The September 11, 2001 attacks on the World Trade Center (WTC) clearly demonstrated the need for a
sophisticated information management system to predict and respond to natural and manmade disasters.
To date, few cities and municipalities have begun to effectively address these needs. Even within
communities that have attempted to meet these challenges, present systems exhibit limited functionality
and are thoroughly inadequate to handle major disasters, thereby highlighting the need for a new disaster
management system. This paper assesses general limitations of current systems, defines the essential
features of an appropriate system, and introduces a state-of-the-art disaster management system recently
developed at North Carolina State University (NCSU).
Increasingly Geographic Information System (GIS) based systems are being used to combat natural and
manmade disasters. The applications of GIS range from identifying evacuation routes during flooding
to determining hazard zones during forest fires. GIS is being increasingly favored, because of its
capacity to associate existing databases with geographic features, to query existing databases based on
the geographic features, and to render multi-dimensional visualization of spatially queried data. These
capabilities are especially useful in relation to disaster events, because of the dual spatial and temporal
nature of these incidents. For instance, GIS can help both identify the likely path of a flood based on
topographic features and determine the level of flood at a particular time. Similarly, for forest fires, GIS
can help both identify areas of highly flammable vegetation near populated areas and calculate the
evacuation time based on the rate of fire expansion.
roads and utilities to conduct risk assessments, while emergency personnel require much of the same
basic information for search and rescue operations during and after a disaster. Digital maps and spatial
analysis of this kind can be produced by GIS-based system, where a common template is created on
which varied data can be quickly placed, measured, and analyzed – resulting in more well-informed
decisions (Greene 2002). Because of the multi-disciplinary nature of disaster, the success of any disaster
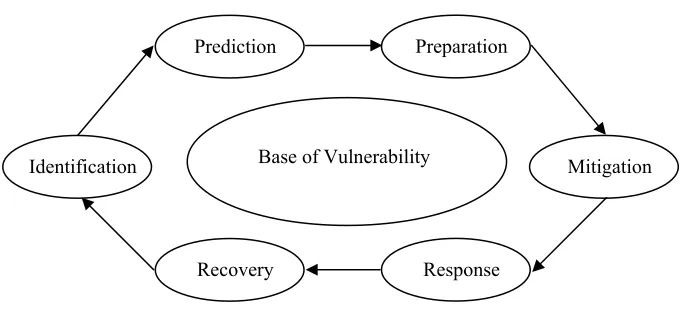
management system is dependent upon capabilities in six disaster related phases: (a) Identification, (b)
Prediction, (c) Mitigation, (d) Preparation, (e) Response, and (f) Recovery (FIG. 2.2).
x Identification is an inventorying of a community’s assets focusing mainly on the physical
infrastructure (e.g. roads, buildings, bridges), although human-oriented capacities such as fire
stations and hospital beds may also be included.
x Prediction is the conceiving of a danger and assessing its potential impact on the community,
which may include property damage, service interruption, and loss of life. Prediction also
estimates losses for a particular disaster of a certain magnitude for a specific community.
x Mitigation is a lessening of the negative impacts of the event and may range from altering
parking and traffic patterns around high-risk buildings to changing the building code.
x Preparation includes those activities needed to prepare for emergencies that cannot be fully
mitigated against either because of cost or the nature of the disaster. Preparation may include
expanding emergency services, identifying emergency housing areas, or posting of evacuation
routes.
x Response occurs during and immediately following a disaster and is typically focused on rescue
activities, fire fighting, and looting prevention.
x Recovery is the rebuilding of the community.
x Identification designates at risk communities and other key infrastructure elements vulnerable
based on past hurricanes and anticipated weather trends.
x Prediction establishes the level of vulnerability of a particular town or region to a hurricane of a
specific magnitude; for a hurricane this would include damage caused by both high winds and
flooding, and their impacts on transportation, housing, and commerce.
x Mitigation includes changing the zoning laws thereby decreasing the number of at risk facilities,
altering the features of the coast by dredging, beach restoration or installation of wave breakers.
x Preparation determines safe routes for hurricane evacuation and makes such information
available. Changing conditions must be reflected and communicated without any delay (e.g.
due to alteration of the hurricane’s path).
x Response encompasses the immediate rescuing of individuals and arranging of their subsequent
housing and feeding, as well as road closing.
x Recovery includes debris removal, building inspection, and bridge reconstruction. Prioritization
schemes need to be developed based on real-time information.
Thus, these six areas reflect the importance of above various phases before, during, and after a disaster.
Current systems fail to address all of these temporal periods collectively. Yet each is essential, as the
information pertinent to one phase becomes vital other phases. For instance, the analysis done during
the preparation phase informs the disaster response phase. Similarly, post-damage data collected during
the recovery phase aids in the identification, prediction, and preparation of future disasters. As these six
phases are closely related, an ideally designed disaster management system should be able to address
CHAPTER 2
LITERATURE REVIEW
The required system must accommodate several levels of data entry and access for each disaster related
phase. At this most fundamental level, there must be a map depicting streets, utilities, buildings, and
other major components of infrastructure in an electronic format. The next level of functionality is
integration of associated attribute data with these key features of the infrastructure. A variety of feature
attributes must be assigned to each component of the infrastructure (e.g. for a utility, its size, shape, age,
and depth of embedment). These key features of the infrastructure should be linked to their visual
representations in an identifiable manner (e.g. gas lines distinguishable from water lines, locatable
emergency services). Recording of data must be mutable (as external factors change) and capable of
integration with other mutable data. Thus, in its most elementary form the conditions, collectively
known as a baseline system of a community, must be represented. Apart from the establishment of
baseline system, the disaster management system should support complex spatial analysis and querying
(e.g. finding the shortest path for the safe evacuation during a hurricane). GIS-based systems help to
consolidate the establishment of such baseline system and provides powerful spatial analysis capabilities
thus making them indispensable for disaster management systems. Finally, the system must be
configured to meet real-time data collection and dissemination needs of disparate agencies that occur
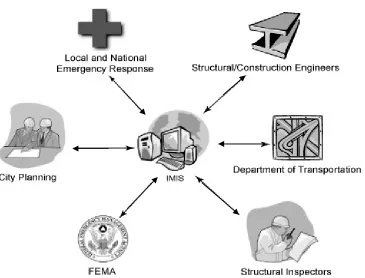
Figure 1 Disaster Community Need
2.1 Existing Systems
Unfortunately, despite multi-billion dollar investments in disaster preparedness and simulated training
exercises (GAO 2003), the majority of cities and municipalities remain inadequately prepared. Existing
systems are typified by discrete, non-networked arrangements that are largely ineffectual in disaster
prediction, and completely incapable of assisting in various phases of disaster preparedness as depicted
in FIG. 2. Thus, a system founded on robust enterprise-level architecture capable of supporting multiple
users concurrently and processing complex analysis in real time is required, while providing adequate
Some cities such as New York have established baseline systems with digital maps of public utilities,
road networks, and building footprints. Unfortunately these systems are typically standalone and of
circumscribed functionality, because they lack the capability to exploit the data for analysis. The
establishment of a baseline system represents a necessary but insufficient condition for a viable system.
Of those cities with baseline systems, only a small percentage have also implemented a system with
disaster preparation capabilities, and of those, no city has yet designed and implemented a system
capable of supporting the requisite rescue and recovery critical during a major natural or manmade
disaster.
Figure 2 Disaster Preparedness Phases
To help communities prepare for possible disasters, the Federal Emergency Management Agency
(FEMA) has sponsored the development of a hazard prediction software package, HAZUS-MH
(HAZUS 2003). HAZUS-MH uses GIS software to map and display damage data and the results of
damage and economic loss estimates for buildings and infrastructure, which allows users to estimate the
impacts of hurricanes, floods, and earthquakes to populations and property. Although HAZU-MH is
equipped to model the probability and level of pre-incident risk for a variety of disaster events, a major Identification
Prediction Preparation
Recovery Response
limitation of the system is its incapability to support real-time response and recovery activities following
a disaster. Thus the software addresses only identification, prediction, and preparation phases of FIG. 2.
Similarly, Marine Corps Systems Command and FEMA have initiated another multi-million dollar
project named Disaster Management Interoperability Services (DMI-Services) to provide a shared
“information backbone” regarding emergency information management among emergency responders,
government offices, and authorized non-government organizations during a crisis (DMI-Services 2003).
The intent of this service is to leverage existing databases and applications to provide an interoperable
suite of tools that organizations can use to obtain needed capability, information, and seamless
connectivity to other stakeholders in the incident response community. Though this system provides a
strong information background, it lacks the tools needed to do proper damage assessment before, during,
and following a disaster. Therefore, this system provides the basic “information backbone”
infrastructure to address response and recovery phases of FIG. 2, but does not provide the adequate tools
to do proper analytical assessment of any of those phases.
There are also some commercially available programs for post-disaster data consideration that integrate
use of a global positioning system (GPS), GIS software, digital photography, and handheld computing
technology to facilitate qualitative and quantitative data collection in the field (Deaton and Frost 2001).
The Deaton and Frost system focuses on collection of damage data and thus, is best suited to the
recovery and identification phases of FIG. 2.
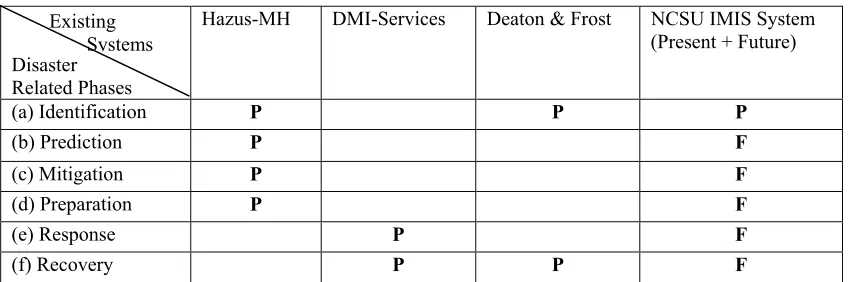
Unfortunately, currently available systems only meet few disaster related phases. Thus, they are still
severely limited by an inability to process disaster related information as an integrated system
Table 1 Existing System's Capabilities
Disaster Related Phases
Hazus-MH DMI-Services Deaton & Frost NCSU IMIS System (Present + Future)
(a) Identification P P P
(b) Prediction P F
(c) Mitigation P F
(d) Preparation P F
(e) Response P F
(f) Recovery P P F
(Note: P stands for present features of the system, while F stands for future additions to the system)
2.2 Ideal System Requirements
An ideal disaster management system should be able to assist during the six critical disaster related
phases as a one integrated system (Table 1). The efficacy and establishment of such a system would
help to minimize the loss of life and property, as well as provide economic recovery. The following is
an outline of the design and implementation of the key components to such a system as exemplified by
the NCSU Integrated Management Information System (IMIS): a new architecture, multi-client user
scenarios, data integration, and extreme data processing environments (all of which are vital for the
success of disaster management). Any IMIS system is accessed by hundreds of users depending on
their intended use. Ordinary civilians access the IMIS for information related to safe routes, available
disaster-relief facilities, while emergency managers use the same system for proper and timely
reallocation of the resources such as food, drinking water, medicine, etc. Similarly, the baseline system
requires a various data (map of roads, pipelines, rivers) from multiple sources, these data need to be
integrated as a single integrated repository system. As the data is analyzed by many users for different
purposes simultaneously, the system should have the capability to address reliable and efficient data
processing and analysis capabilities. Thus, in order these issues, the system architecture for a future
disaster management system needs to rely on an enterprise-level GIS framework. The concept of Existing
enterprise GIS is to maximize the utilization of GIS capabilities by channeling timely spatial and
CHAPTER 3
ENTERPRISE GIS ARCHITECTURE
Current disaster management systems are standalone and, thus, do not harness the power of an enterprise
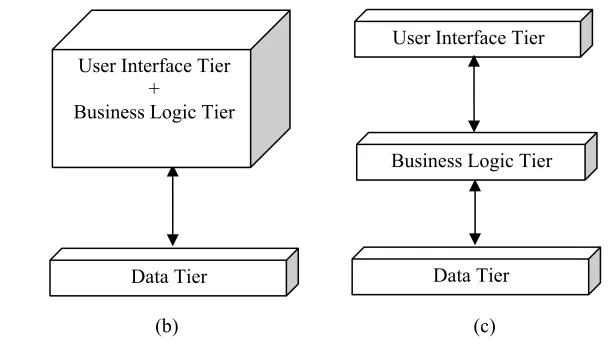
GIS framework. These systems are designed either as stovepipe or client-server architecture. In
stove-piped applications, the three logical components of GIS: (data, business logic, and user interface1) are
tightly coupled and distributed as a single entity [FIG. 3(a)]. The data component contains the
organization’s data, while the business logic implements the functionality or business rules of an
application. The user interface component interacts with the business logic component to access the
data component. In contrast, in client-server architecture, the data management and the user interface
responsibilities are distinct, with no defined place for operations and business logic [FIG. 3(b)]. A
profound departure from these arrangements is a three-tiered with the capability of being an N-tiered
design [FIG. 3(c)], where there is a loose coupling and separation of at least three logical components,
which is typical of an enterprise framework.
(a) (b) (c)
Stove-piped Architecture Client-Server Architecture Three-Tiered Architecture
Figure 3 Types of Generic System Architecture
1
User interface is also known as client.
Business Logic Tier
Data Tier User Interface Tier
Data Tier User Interface Tier
+
Business Logic Tier User Interface Tier
+ Business Logic
The three-tiered approach, commonly referred to as N-tiered architecture, is an allusion to the unlimited
number, N, of intermediary layers between the client and server, which reduces redundancies in both
data entry and processing. In N-tiered architecture, the operations and analysis components are
explicitly restricted from being coupled to the user interface and data components (Morais 2000). The
introduction of the business logic tier enhances performance, flexibility, and maintainability by
centralizing process logic. With other architectural designs, a change to a function (service) would need
to be written into every application (Eckerson 1995). N-tiered architecture circumvents this
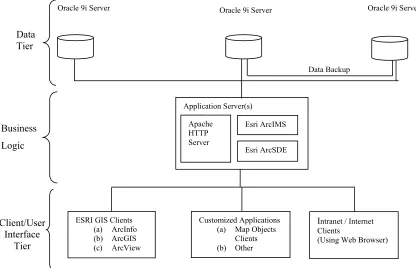
requirement, thereby promoting a substantially more efficient and flexible system. The NCSU IMIS
system architecture has Oracle 9i database servers as a data tier, application servers (Apache HTTP
server, Esri ArcSDETM, Esri ArcIMSTM) as a business logic tier, and client applications (customized
client application, Esri GIS applications, and Intranet/Internet clients) as a user interface tier (FIG. 4).
Figure 4 NCSU 3-Tiered System Architecture Design
3.1 Backend Database System (Data Tier)
Oracle 9i ServerApplication Server(s) Apache HTTP Server Esri ArcIMS Esri ArcSDE
ESRI GIS Clients (a) ArcInfo (b) ArcGIS (c) ArcView
Intranet / Internet Clients
(Using Web Browser) Customized Applications
(a) Map Objects Clients (b) Other
Oracle 9i Server Oracle 9i Server
A data tier in a three-tiered architecture is represented by a backend database system (FIG. 4). The
primary function of a backend database system is to store data. Depending upon the number of users
who access the data and the complexity of the data, different database systems are used. Small and
simple data, commonly used by a small number of people, can be stored in standard data files, while
large, complex data with many users require special database management system (DBMS) to ensure its
integrity and longevity (Longley et al. 2001). As IMIS data is accessed by hundreds of users spanning
across different organizations and geographic locations, and the data is complex in nature, the IMIS data
tier needs to implement a special database management system. The subsequent sections address
various issues such as data format, data retrieval mechanisms, data integrity that are the essential
features of the special database management system for the success of IMIS system.
3.1.1 Importance of Standard Data Format and Retrieval Mechanism
For a disaster response and planning system, a contemporary desktop GIS system is inadequate, because
spatial data and its attribute information are stored in a proprietary file format. The proprietary file
format hinders integration within an enterprise framework as it is not based on open standards, such as
those recently developed by both governmental and non-governmental organizations. As examples of
standardization, industry consortiums such as Open GIS Consortium (OGC) have formulated the
“simple features specification” (OGC 2003), while the United States Geological Survey (USGS) has
established the “Spatial Data Transfer Standard” specification for standardized data exchange (SDTS
1997). These common standards help to fulfill a key aspect of an enterprise GIS system that of
non-proprietary data storage formatting. This, however, only aids the process of storing data. To make the
data available to user or client applications, data access mechanisms must also be standardized.
Structured Query Language (SQL), established by American National Standards Institute (ANSI), is a
comprehensive database language that provides statements for data definition, querying, and updating
(Elmasri and Navathe 2000). Most relational database management system (RDBMS) supports SQL as
for SQL” advances the state of the art by defining a standard SQL schema to handle spatial attributes,
which does not exist in the present version of ANSI SQL. Use of both standards for data formatting and
manipulation are vital to the success of an enterprise GIS system to ensure maximum data exchange
with ease.
3.1.2 Importance of Integrated Repository System
One of the major problems faced during the New York City (NYC) rescue operations after September
11 was the lack of availability of data sets in an integrated repository system. Data sets from different
organizations first had to be collected, prior to any computerized-based search and rescue operations.
The enormity of the situation highlighted the acute and immediate need for accurate and compatible
spatial information. During a disaster, decision makers, incident commanders, emergency responders,
and city mangers need spatial information instantaneously. Since timing is critical during search and
rescue operations, all potentially required data sets must be pre-stored in a centralized repository system.
This ensures that mission-critical data can be retrieved and redistributed to different agencies or
personnel for analysis in a timely manner.
The NYC problem was exacerbated by the fact that although there had been a significant investment in
the establishment of an Emergency Mapping and Data Center (EMDC), the center was located at WTC
and was entirely destroyed during the attack. The EMDC had to be completely reestablished off-site to
aid the search and rescue operations. What should be understood from this example is that an integrated
repository system must not be not confused with a repository system having a single point of failure.
The system’s actual implementation should comprise multiple repository hardware systems that are
physically distributed across many locales. From the user’s perspective, however, all the required data
sets are visible, as if it was a single physical repository, and any updates made on one data set are
3.1.3 Challenges of Integrated Repository System
Creating a integrated repository system demands (a) multi-version concurrency control, (b) recovery
capabilities, (c) system security, and (d) support of multi-format data. Concurrency control is the
activity of synchronizing operations issued by concurrently executing programs on a shared database.
The goal is to produce an execution that has the same effect as a serial one. In a multi-version database
system, each write on a data item produces a new copy (or version) of that data item (Bernstein and
Goodman 1983). Since multiple users access and update the same data simultaneously, this concurrency
control property is extremely important to ensure data integrity. If user A and user B are accessing and
modifying the same data simultaneously, the concurrency control mechanism must ensure that each user
receives the most recent copy of data and that the updates made by each user are properly stored in a
sequential manner.
A recovery mechanism is also crucial to ensure the atomicity property of a transaction, since failure can
occur whenever a network connection to the database severs or during the editing or updating of data. If
a transaction fails before completing its execution, the recovery mechanism must ensure that the
transaction has no lasting negative effects on the database (Elmasri and Navathe 2000); the system must
be capable of restoring the last whole data entry.
The third important component of a integrated repository is security, which is crucial since multiple
users will be accessing the same repository system. The system must protect the database against
persons who are not authorized for partial or total access. These properties are not inherently supported
by the file-based GIS data sets typically comprised of only a set of simple files in which the stored
information is often separated by a delimiter and cannot, therefore, support mechanisms for
Another major challenge of a integrated repository system is the hosting of multimedia data formats:
images, video clips, and drawings collected both before and after a disaster incident. All of the
information needs to be integrated and stored for analysis. The repository system must act, thus, as a
robust multimedia database management system.
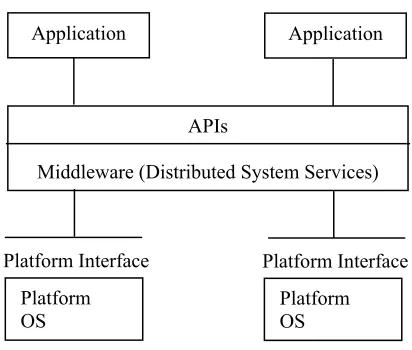
3.2 Middleware System (Business Logic Tier)
The next essential portion of a disaster based IMIS is the middleware, also known as business logic tier.
Middleware is defined as a set of common services that enable applications and end users to exchange
information across networks (Umar 1997). These services reside in the middle portion of the
architecture, above the operating system (OS) and networking software and below the distributed
applications (FIG. 5) [Bernstein 1996].
Figure 5 Middleware (adapted from Bernstein 1996)
Bernstein (1996) identifies how middleware services are distinctive from and more advantageous than
applications or low-level services in the following aspects:
Application Application
APIs
Middleware (Distributed System Services)
Platform OS
Platform Interface
Platform OS
x Operates on different OS and network services and, thus are not tied to a specific platform such
as computing hardware, communication networks, operating systems, or other software
components
x Serves multiple purposes at a time, since they are available to multiple applications and users,
while not being embedded in a single application for a specific industry
x Are distributed, which permits remote accessibility of them or their applications
x Supports standard interfaces and protocols and thus, are specified by well-defined “Application
Programming Interfaces” (APIs) and communication protocols. Such interfaces facilitate
porting applications to different platforms, and standard communication protocols allow
applications on systems with different machine architectures and operating systems to exchange
data
Middleware technologies are generally categorized as either general or service-specific. A general
middleware technology provides a common framework that helps build a middleware component,
irrespective of its intended usage, while service specific middleware technology can be customized to
facilitate a particular task. For instance, current middleware technologies such as Java 2 Enterprise
Edition (J2EE) and Microsoft .NET have provided common frameworks to develop business logic while
circumventing the need to know about the technical details about the underlying hardware, operating
systems, and communication protocols. These frameworks are not tied to any service specific
technology and are as such known as general middleware technologies. A service specific middleware
technology is designed to serve a specific domain. For example, contemporary RDBMS cannot handle
the spatial data in an efficient and intelligent manner due to issues of topology and geometry, whereas a
spatial-database-specific middleware system may be designed explicitly for that purpose. Many
commercial spatial-database-specific middleware products are available, but the following criteria must
x Provide the required infrastructure to manage multiple users
x Provide business logic software to support advanced GIS data types (e.g. images, networks,
features with integrated topology and shared geometry) and associate these various data types
with rules, behaviors, and other object properties
x Allow GIS data to be directly maintained in the format of "spatial types" supported by the
Database Management Systems (DBMS) vendors
x Integrate spatial (geometric) search capabilities provided by the DBMS vendors within the GIS
client software applications
In general, disaster management systems require a number of middleware systems that are both general
and service specific. The efficiency of the entire system is highly dependent on the efficacy and proper
use of the middleware system. Such middleware-intensive arrangements foster the development of client
applications with minimal functionalities. To perform such spatial queries, which make use of huge
network data sets, can be resource-intensive tasks for the middleware system, as well. This arrangement
mandates that the disaster management system exploit the power of processing advancements such as
parallel or distributed computing.
3.3 Parallel and Distributed Computing
Beyond the architecture, the manner in which data is processed impacts the feasibility of a disaster
response system. Modern computer simulations of complex natural phenomena, such as forest fire
growth or wave propagation due to blast explosions, require extensive computer capabilities for both
processing and storage. Limitations of a single processor can be severely felt while doing such
simulations. Both physical and practical reasons pose significant constraints to the obvious solution of
serial computer directly controls how fast data can move through the hardware,2 (b) limits to
miniaturization – although ever improving, processor technology currently allows only a finite number
of transistors to be placed on a chip, and (c) economic limitations - it is increasingly expensive to make
a single processor faster. A solution is the simultaneous use of multiple computing resources, also
known as parallel computing. There are two primary motivations for using parallel computing: to save
time and to solve larger problems. The use of parallel computing mandates significant improvements be
made in both the hardware and software aspects of the computing. The parallel architecture should be
comprised of multiple numbers of interconnected processors to solve a common problem. The software
should employ parallel algorithms that explicitly take advantage of a parallel architecture. 3
In disaster management system, a wave propagation model linked to a GIS-based system could be
extremely valuable for pre-disaster planning, crisis management, and post-disaster recovery, but the
success of such an effort would be highly reliant on access to parallel processing capabilities (both
hardware and software aspects) to achieve adequate processing capacity, within a reasonable time frame.
During a crisis, a system that employs parallel computing would allow real-time communication
between engineers, civil protection agencies, and emergency services, thereby rapidly informing them of
changing hazard conditions. So far, only limited research has been conducted to exploit the power of
parallel computing to solve this complex class of problems. The field of parallel processing is still
considered novel and lacking uniform support in academic and commercial circles (Mineter et. al 2000).
Commercially available GIS software does not presently utilize multi-processors for analysis, thus
2
Absolute limits are the speed of light (30 cm/nanosecond) and the transmission limit of copper wire (9 cm/nanosecond). Increasing speeds necessitate increasing proximity of processing elements.
3
relying on continuing advancements of the single processor computer to meet evolving needs. The major
hindrances towards using parallel computing include the following:
x Complex Parallel algorithms implementation
x Hardware costs
3.3.1 Parallel Algorithms Implementation
Parallel database management and computational geometry make GIS operations in a parallel
environment an advanced topic, one beyond pedestrian GIS usage. Mineter and Dowers (1999)
conclude, “although parallel computing can be considered to be maturing technology, its exploitation in
geoprocessing is still its infancy”. The complexities of implementing a parallel algorithm and the lack of
parallel libraries specific to this field have limited progress. Mineter and Dowers (1999) propose
creation of a parallel software framework, one that encapsulates the complexity of the implementation of
parallel algorithms and enables the reuse of existing parallel libraries in different applications. Such a
framework will foster the use of parallel algorithms to solve problems that require heavy computation,
without users having to achieve a mastery of complexities associated with the design and
implementation of such algorithms.
3.3.2 Hardware Costs
Although parallel computing harbingers a powerful and optimistic future for disaster management
systems, the cost of the hardware platforms required for parallel computing remains a major obstacle.
Platforms, such as SGI/Cray Origin and IBM SP demand a heavy investment in capital and
maintenance. Since a reliable and robust disaster management system should be affordable to every
community, irrespective of size, such computing requirements must be met in a cost efficient manner.
With recent developments in distributed computing on clusters of workstations, such as Beowulf
running a free-software operating system (e.g. Linux or FreeBSD), and interconnected by a private
high-speed network. The use of clusters to prototype, debug, and run parallel applications is becoming an
increasingly popular alternative to using specialized, high-investment, parallel computing platforms
(Buyya 1999). With such an approach, the system cost can be dramatically reduced with little
performance degradation. Cost is, thus, a motivating force for cluster computing.
3.4 Customized Client Applications
Apart from the numerous benefits of middleware system (e.g. support for multi-user access and standard
protocols) , the middleware fosters customized client applications in the system which is vital to the
success for a disaster management system. Current GIS client applications used in disaster management
systems are designed for the concept of client/server architecture and, hence, can be termed as “fat
clients”. In a client/server environment, a client that conducts most or all of the processing leaves little,
if any, to be done by the server. Relying on a client to process the data, which is highly resource
intensive in terms of cost and computing power, is generally an uneconomical solution when there is a
need to service hundreds of clients, as would be the case for a disaster management response system.
Thus, the concept of a customized client in which different client applications are designed and
implemented as per the required functionalities is preferable to “fat clients”.
One of the greatest strengths of the N-tier architecture is its support for customized client applications.
Since the business logic to manipulate the data is provided by the middleware system, customized client
applications can simply access any preexisting business logic that is needed. This characteristic helps to
develop client applications with minimal business logic (that is not already provided by middleware
system), thus reducing development time and cost. For instance, the middleware system may provide a
service (business rule/logic for disaster management system) to find the shortest route to the nearest
hospital from a given point of geographical location. To accomplish this example, the system must
routing options. A GPS supported, handheld device with limited computing power carried by
ambulance personnel or a powerful personal computer carried by other rescue personnel can use the
same service irrespective of its computing power, because the logic to process the complex spatial query
resides in the middleware system and not in the handheld device or personal computer. Such
middleware-intensive arrangements foster the development of client applications with minimal
CHAPTER 4
NC STATE DISASTER MANAGEMENT SYSTEM
Design and implementation of an Enterprise-level disaster management system requires extensive
planning, which includes five key components: (a) people (management, staffing, and training), (b)
hardware, (c) software, (d) data format, data quantities, and database design, and (e) application
demands in the form of data access and customized routines. To achieve this, platform and network
requirements, hardware policies and standards, system administration experience, operational
constraints and priorities, and financial issues must be established.
NCSU’s IMIS employs a three-tiered architecture: (a) a backend database server, (b) an application
server, and (c) a customized client application, which was designed to support analysis of blast damage
assessment of the buildings surrounding the WTC (FIG. 4).
4.1 Database Server (Data Tier)
Oracle 9i Enterprise Server is the backend database server (FIG 4). Such a spatially enabled RDBMS,
as a central repository for spatial data, allows ease of integration of spatial data with other core
organizational data. The server also supports a large number of users, exploits enhanced DBMS features
(e.g. administration and maintenance utilities, replication, and faster backup and recovery), and employs
use of Java and SQL, as open application programming interfaces (APIs).
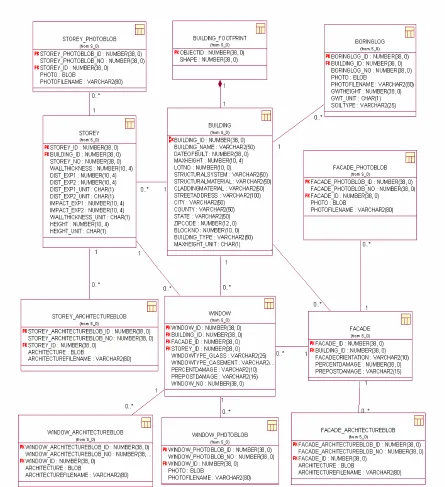
This central repository system stores the vector data types of New York Citys’ building footprints, street
centerline, etc in ESRI geodatabase format. The development of the geodatabase enabled spatial data to
be stored in standard relational databases (Macdonald 2001). The geodatabase is implemented on
schema for Oracle database server, which is fully compliant with the OGC Simple Features
Specification for SQL’s binary geometry (ESRI 2003). A relational data model is designed and
implemented to order to store the attribute information of the buildings.4 A data model is defined as a
conceptual representation of the data structures that are required by a database. The attribute
Figure 6 UML Conceptual Schema for IMIS Database
4.2 Application Server (Business-logic Tier)
The application server is the intermediate layer of software of the NCSU system architecture, also
known as middleware. This intermediate layer is comprised of an ArcSDE server from Environmental
Apache Software Foundation (FIG 4). These servers can be installed either separately on individual
workstations or combined on a single workstation, depending upon the volume of users and the
workstation’s hardware configuration.
The ESRI ArcSDE server acts as a spatial database-specific middleware and is completely integrated
with and supports all significant functions and capabilities of a major spatial database system, including
geometric data management, which is required for complex topological analysis. The middleware helps
to achieve increased flexibility and enhanced performance by (1) distributing the GIS application
between the client layer, the application server, and the database server; (2) improving data integrity;
and (3) reducing database and application development costs.
Also, ESRI ArcIMS provides the foundation for distributing high-end GIS and mapping services via the
Internet (ARCIMIS 2003). ArcIMS, all along with Apache HTTP server enable users to integrate local
data sources with Internet data sources for display, query, and analysis in an easy-to-use Web browser.
Thus, they provide adequate infrastructure to make NCSU system a web-enabled system.
4.3 NCSU Customized Client Application
A customized GIS client application was developed to create a specialized solution to
enter/update/delete information and to perform complex spatial queries (FIG 7). For NCSU’s IMIS
system, the application is focused on baseline pre-blast age-related damage and post-blast building
damage data. The application provides an easy to use graphical user interface (GUI), with a powerful
desktop mapping feature for the end users to insert/update/delete various types of complex data such as
photographs and CAD files. The GUI also allows formulation of complex spatial and attribute-based
queries. The query results are displayed both in graphical and tabular forms. The application is built
high performance applications on multiple platforms in heterogeneous, distributed networks (Gosling
and McGilton, 1996).
The GUI was developed using Java Foundation Classes’ (JFC) library, as it provides an extensive set of
technologies that enable developers to create an interactive format for client applications that can run on
multiple platforms (JFC 2003). Also, ESRI Java MapObjects 1.0 library was employed to perform a
wide variety of geographic-based display, query, and data retrieval activities (MAPOBJECTS 2003).
Figure 7 Customized GIS Application
4.3.1 Features of NCSU Client Application
The NCSU customized client application was designed to achieve the following objectives:
x Robust error checking to avoid improper data entry
x Support for sophisticated spatial and attribute based queries
4.3.1.1 Ease of Use
As various users ranging from data entry personnel to sophisticated programmers may need this NCSU
client application, interaction with the software must be user friendly. Apart from the standard GUI
components such as menus, toolbars, textboxes and window interfaces, the client GUI also provides a
visual map displaying building footprints, road network, utilities, and other key infrastructure
components. While entering and updating data, the data entry personnel can use the visual map to
associate the data with a particular building. For instance, data entry personnel can select a particular
building from the map and then right-click the mouse button to display a list of options available. The
list includes entering, updating, and deleting building information (FIG. 8). Upon selection a particular
option, a window frame opens up to add/update/delete the building information. FIG. 9 shows a GUI
frame to enter building information. This provides an intuitive and easy way to use the software.
Figure 9 GUI Frame to Enter Building Information
4.3.1.2 Robust Error Checking Mechanism
Apart from ease of use, error-checking mechanisms preclude the insertion of incorrect information in
database. The error-checking mechanisms employed by the client GUI include combo boxes, radio
buttons, and data type validation of text fields. The use of combo boxes is recommended for enumerated
types [FIG. 10 (a)]. A data type validation of text field ensures compliance with a particular standard.
For instance, if a user enters a string data type into a field that accepts only integers, the incorrect data is
(a) Combo Box (b) Text Field Validation
Figure 10 Error-Checking Mechanism
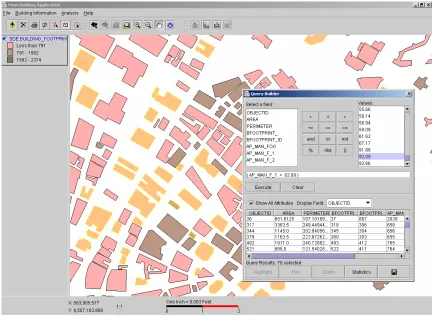
4.3.1.3 Support for Sophisticated Spatial and Attribute-based Queries
The client application is also designed to help users perform complex spatial and attribute based queries.
Current commercial GIS softwares, such as ESRI ArcMap have provided an intuitive GUI to formulate
queries based on single attribute table. If the data is distributed among a multiple set of tables, the
software mandates that the user have a technical knowledge in order to formulate the query. For
instance, in ESRI ArcMap, the user would need to know the concepts of Join and Relates. ArcMap
provides two methods to associate data stored in tables with geographic features: Joins and Relates.
When the user joins two tables, the attributes from one table is appended onto the other based on a field
common to both tables. Relating tables defines a relationship between two tables—also based on a
common field—but does not append the attributes of one to the other.
If the attribute data is stored in multiple tables, query formulation becomes an arduous task using Join
and Relates. The NCSU client application precludes the need to know SQL to achieve complex spatial
and attribute queries (FIG. 11). The user can simply checkbox the proper fields and then specify the
conditions related to that field. Only the selection criteria need to be known. The following are the steps
(a) Selecting appropriate fields to display
A user can select the appropriate fields required for the query analysis by selecting the checkboxes (FIG.
11). FIG. 11 shows that the Building Name, Structural System, Structural Material, Façade Architectural
CAD and Storey Height fields are selected.
Figure 11 Query Interface
The lower section of the GUI contains a set of buttons that are used to formulate the customized query.
The user can check the boxes adjacent to Building Query, Façade Query, Storey Query and Window
Query label, in order to enable these adjacent buttons. For instance, by selecting the checkbox adjacent
to Façade Query label, the user can enable the Façade Query Form button. The Façade Query Form
button is used to display the GUI, where the user can customize the query related to façade attributes
(FIG. 12). FIG. 12 allows formulating a query to find the buildings that has any façade with post-blast
damage percentage between 30 and 90. After making the proper selection, the user needs to click the
Accept button. Similarly, other forms such as Building Query Form, Window Query Form and Storey
(c) Viewing results
The database is queried by pressing the Query Button. A popup GUI with the selected attributes is
displayed (FIG. 13). In this example, the query returns two results. As shown in the FIG. 13, the user
can download the architectural drawing by clicking the button under the architectural drawing column.
The selected buildings are graphically displayed after clicking the Done button. The selected buildings
graphically appear as selected by being displayed colored yellow (FIG. 14).
Figure 14 Displayed Query Results
4.4 Parallel Computing
One of the primary objectives of the NCSU research is to design and evaluate the parallel software
framework for prominent graph algorithms that are potentially useful for disaster management.5 These
tasks can be (a) finding the shortest paths between two points in a road network, (b) predicting
dispersion of hazardous material, and (c) estimating volumes of debris removal based on LIDAR data
sets. These algorithms can be implemented either in serial or in parallel modes, but in serial
implementation, only one processor is used to process the computation at a time, while in parallel
implementation multiple processors are used simultaneously to perform the same computation. The use
of multiple processors helps to solve complex problems in a real time, which is difficult to achieve with
The NCSU research is mainly concerned with the design and implementation of parallel algorithm
framework. As mentioned above, such a framework helps the programmers who are not the experts on
parallel algorithms to use the software with great ease. NCSU’s current framework supports different
types of ‘All-Pairs’ Shortest Paths algorithms (Cormen et. al 1990) namely Dijkstra (Dijkstra 1959) and
Floyd-Warshall (Cormen et. al 1990) algorithms. These algorithms are implemented using both Message
Passing Interface (MPI) and OpenMP specifications, which are widely used in the parallel computing
domain. The MPI model posits a set of processes or tasks that have only local memory but are still able
to communicate with other processes by sending and receiving messages (Gropp et. al 1994), while
OpenMP supports multi-platform shared-memory parallel programming model so that the running
processes can access the common shared memory (OPENMP 2003).
The use of parallel computing can substantially reduce processing time, especially when a significant
number of processors are available. For example, a typical 4500-nodes transportation road network (2
nodes required for each road segment) took 2231.4 seconds to find ‘All-Pairs’ shortest paths (using
Parallel Floyd-Warshall) with one processor, while the same network required only 24 seconds with 144
processors (FIG. 15). A speedup of approximately 91.5 times is achieved. A similar level of speedup
(92.3 times) was achieved when finding the ‘All-Pairs’ shortest path using Parallel Dijkstra algorithm,
when the number of processors is increased from 1 to 128 (FIG. 15); these algorithms were run on an
IBM RS/6000 SP Supercomputer. A substantial amount of time savings occurs when multiple number of
processors are used for data analysis.6 Thus, parallel computing should be the preferred configuration
for disaster management system, in order to achieve results of complex analysis in real-time.
2231.4
654.36 1563.1
505
24.38 16.07
0 500 1000 1500 2000 2500
0 20 40 60 80 100 120 140 160
No of Processors
Time in Seconds
Parallel Floyd-Warshall using MPI Parallel Dijstra using MPI
CHAPTER 5
FUTURE RESEARCH RECOMMENDATIONS
NCSU disaster management research will continue to evolve to incorporate the following capabilities:
x Development of a prototype of Service-oriented Inter-agency Participation Framework using
Web Services.
x Accommodation of GPS handheld devices to collect field data and direct synchronization to the
enterprise database system.
x Disaster specific analysis capabilities
5.1 Service-oriented Inter-agency Participation Framework
The data maintenance and processing required for disaster response cannot be realistically managed by
one organization. Theoretically, the design of a disaster management system could make use of services
(both data maintenance and processing) of multiple organizations, instead of incurring the difficulty and
expense of attempting to replicate services already available at other agencies. Any analysis or data
maintenance task can be outsourced to another organization, if that organization has the proper
infrastructure to support such processing. Thus, a network of co-operating agencies could be established
to augment existing capabilities to be employed when needed. For instance, a resource intensive,
complex analysis job, such as finding the shortest route to reach injured victims, in the aftermath the
large magnitude earthquake amidst a dense, complex road network, can be outsourced to a
supercomputing center for analysis. Likewise, the National Institute of Building Sciences can offer
pre-disaster related services such as loss estimation of buildings caused by an earthquake, prior to a hazard
event. An interagency participation network could be created similar to a set of distributed computing
Figure 16 Interagency Participation Network
Building an enterprise scale disaster management system is a complex undertaking and may be
considered as a collection of interacting services (Brown et. al 2002), where each service provides
access to a well-defined collection of functionalities. In case of a disaster management system, typical
services might be (1) finding shortest routes, (2) loss estimation, (3) quantifying debris removal, or (4)
estimating temporary housing requirements. These services could be seamlessly integrated to form a
service-oriented architecture (SOA). The SOA defines the services that comprise the system, describes
the interactions that occur among the services to obtain certain behavior, and maps the services into one
or more implementations in specific technologies (Brown et. al. 2002). There are three main components
to a SOA: (1) Service Requestor, (2) Service Registry, and (3) Service Provider (FIG. 17).
Figure 17 SOA Components
In an SOA, the Service Provider (the owner of the service) publishes its service description to a service Disaster Management System Federal Emergency Management Agency National Institute of Building Science Service Registry Service Requestor Publish Service Description
Bind to the Service Find a Service
description contains abstract definitions to invoke operations and exchange messages, and the bindings
to a concrete network protocol. The service requestor finds an appropriate service from the service
registry and selects the appropriate service(s) from the list of available services. Then it invokes the
service directly at runtime using the binding information provided in the service description. An
example can be a disaster management system (Service Requestor) invoking a shortest path service
provided by a supercomputing center (Service Provider) with the help of a FEMA lookup database
(Service Registry) that stores the information about the services made available by the list of
supercomputing centers across the nation. Such a robust, reliable, and economical disaster management
system can be developed through the integration of different participating agencies with the help of a
new Web Service framework, where the participating disaster management agencies can interact and
effectively access each other’s resources.
Recent developments in XML (Extensible Markup Language) based Web Service architecture provide
fertile ground for such a service-based architecture. Web services technology is derived from existing,
distributed component technologies such as CORBA and DCOM technology (Caudwell et al. 2001) and
offers a new framework for computing technology and standards, as well as the means to connect a
network of distributed computing nodes (e.g. servers, workstations, desktop clients, and lightweight
handheld clients) in a loosely coupled fashion. The loosely coupled architecture supports otherwise
incompatible system technologies and creates composite services on demand. The loose coupling is also
important for the implementation of complex collaborative applications needed during interagency
participation. This framework is an integration of several key protocols and standards: XML, WSDL
(Web Services Definition Language), SOAP (Simple Object Access Protocol), and UDDI (Universal
Description, Discovery, and Integration). XML messages compliant with the SOAP specifications are
exchanged between the requester and provider (SOAP 2000). The provider publishes a WSDL file that
contains a description of the message and endpoint information to allow the requester to generate the
Description, Discovery, and Integration protocol to enable service requestors to find and use Web
services (UDDI 2002). The integration of web services (specific services offered by different agencies)
into an Enterprise GIS framework (such as a disaster management system) offers tremendous new
opportunities and capabilities for emergency management and hazard mitigation (Tsou and Buttenfield
2002).
5.2 Accommodation of GPS Handheld Devices in Enterprise System
The integrated use of a global positioning system (GPS), a geographic information system (GIS), digital
photography, and handheld computing technology is gaining popularity to facilitate qualitative and
quantitative data collection in post-disaster analysis system (Deaton and Frost 2001). NCSU system has
the capability to incorporate such wireless hand-held devices. One of the main objectives of NCSU
enterprise framework is the seamless integration of multiple types of hardware devices to access the
central repository system. The following guidelines are recommended to incorporate GPS based wireless
devices into the NCSU system:
x Web Service framework
x Platform independent code
5.2.1 Web Service Framework
The enterprise system can offer services that are related to information retrieval, update, and querying to
wireless handheld devices. Prior to the availability of a Web Service Framework, existing enterprise
services lacked a standard, nonproprietary method for communicating with the backend repository
system. As a result, developers faced the prospect of having to write, maintain, and debug unique code
for every conceivable type of handheld devices (J2ME 2003). With the help of a Web Service
Framework, such handheld clients can exchange critical information with the central repository system
5.2.2 Platform Independent Code
A Web Service framework guarantees only the adoption of standard protocols regarding the invocation
of services and the exchanges of messages. Different programming languages such as Java, C, C++ can
be used to invoke services hosted by a Web Service Framework. In fact, this ability to accommodate
services written in different languages is an advantage of this framework. The NCSU research
recommends that platform independent language be used. Java language has currently been used as a
language to achieve platform independence. The use of such language ensures that the code written for
one brand of mobile device can be easily ported to another device brand. The interoperability helps to
lower the cost of developing, maintaining, and debugging programs for diverse mobile devices (J2ME
2003). The NCSU research recommends the use of Java language primarily customized for small
handheld devices, also known as Java 2 Platform, Micro Edition (J2ME). 7
5.3 Disaster specific analysis capabilities
Then integrated nature of the constructed architecture and its interoperability allows it to be an ideal
platform to host the development of many important future advances that are highly discipline specific
and, thus, outside the scope of this current research.
7
CONCLUSION
An integrated disaster management system based on an enterprise system that combines GIS, DB, and
CAD, offers substantial advantages over existing standalone systems in terms of data collection,
administration, and retrieval. For communities to fully exploit their resources, and minimize duplication
of efforts on an administrative level, an IMIS is needed. Such a system provides an opportunity for
profound advancement in areas of disaster management. The key to these activities is the integrated
system, which incorporates and links critical regional, local, and building-specific information using
CAD, GIS, and databases to maximize the utility of the information and leverage its use during six
disaster related phases namely (a) identification, (b) prediction, (c) mitigation, (d) preparation, (e)
response, and (f) recovery. The output of such systems can provide guidance for several critical areas.
The full advantage of an integrated, spatially adaptable approach is hard to fully comprehend in its
potential to revolutionize how disasters are considered. With a proper selection of input data and timely
and rigorous updating of the system, large amounts of additional analysis for direct intervention and
planning could be incorporated with respect to utility protection and redundancy, assessment of critical
infrastructure, structural evaluation and intervention.
The deployed NCSU IMIS demonstrates the constructability of such a system through the employment
of a data repository system, middleware system, and customized client applications to provide a system
that is a robust, reliable, and efficient before, during, and after a natural or man-made disaster. The
IMIS architecture exploits recent advancements in both hardware and software. Preliminary tabular and
visual queries for data analysis have proven possible. When coupled with a fully defined baseline
system combined with powerful spatial querying, such a state-of-the-art disaster management system
REFERENCES
1. ARCIMS (2003). “ArcIMS – GIS for the Internet,”
http://www.esri.com/software/arcims/index.html, accessed May 15, 2003
2. Beowulf (2003). “Beowulf at NASA/GSFC,” http://beowulf.gsfc.nasa.gov/, accessed May 12, 2003
3. Bernstein, P. A., and Goodman, N. (1983). Multiversion Concurrency Control - Theory and Algorithms. ACM Transactions on Database Systems (TODS), v.8 n.4, p.465-483
4. Bernstein, P. (1996). Middleware: A Model for Distributed Systems Services, Communications of ACM, Vol. 39, No. 2, pp. 86 - 98
5. Brown, A., Johnston, S., and Kelly, K. (2003). Using Service-Oriented Architecture and Component-Based Development to Build Web Service Applications, A Rational software white paper from IBM
6. Brule, M.R. (2002). Deciphering .NET for GIS. Geospatial Solutions 12(6):32-7
7. Buyya, R. (1999). High Performance Cluster Computing: Architectures and Systems, ISBN 0-13-013784-7, Prentice Hall PTR, NJ, USA, 1999
8. Cauldwell P, Chawla R, Chopra V, Damschen G, Dix C, Hong T, Norton F, Ogbuji U, Olander G, Rehman M A, Saunders K, and Zaev Z (2001). Professional XML Web Services, Birmingham, Wrox Press
9. Cormen, T. H., Leiserson C. E., and Rivest, R. L. (1990). Introduction to Algorithms, MIT Press
10. Deaton, S.L. and Frost J.D. (2001). " Integrated Digital Earthquake Reconnaissance," Seventh National Conference Earthquake Engineering (In press)
11. Dijkstra, E. W. (1959). A note on two problems in connexion with graphs, Numerische Matematik 1 (1959) 269-271
12. DMI-Services (2003). “DMI-Services at a glance”, http://www.cmi-services.org/whyCMIS.asp, last accessed July 11, 2003
13. ESRI (200). “Standards and Interoperability - Newsletter”,
http://www.esri.com/library/newsletters/standards-interoperability/sinews-summer03.pdf, last
accessed July 18, 2003
14. GAO (2003). “Major Management Challenges and Program Risks- Federal Emergency Management Agency,” Performance and Accountability Series, United States General Accounting Office, page 6, January 2003
15. Greene, R. W. (2002). “Confronting Catastrophe: A GIS Handbook”, ESRI Press
17. Eckerson, Wayne W (1995). "Three Tier Client/Server Architecture: Achieving Scalability, Performance, and Efficiency in Client Server Applications." Open Information Systems 10, 1 (January 1995): 3(20)
18. Elmasri and Navathe, S.B. (2000). Fundamentals of Database Systems, 3rd ed., Addison Wesley, Chapter 8, Pages 243-244 & Chapter 19, Pages 329-657
19. Fowler, M. and Scott, K. (1999). “UML Distilled: A Brief Guide to the Standard Object Modeling Language”, 2nd ed., Addison Wesley, Chapter 3.
20. Gosling J and McGilton H (1996). “The Java Language Environment,”
http://java.sun.com/docs/white/langenv, accessed May 5, 2003
21. HAZUS (2003). “HAZUS- Multi Disasters, a loss estimation software,” http://www.fema.gov/hazus/hz_index.shtm, accessed May 10, 2003
22. JFC (2003). ” Java Foundation Classes (JFC) – Cross Platform GUIs & Graphics,”
http://java.sun.com/products/jfc/, accessed May 14, 2003
23. J2ME (2003). “Java™ 2 Platform, Micro Edition (J2ME™) Web Services Specification, ”
http://java.sun.com/j2me/docs/j2me_jsr172.pdf, accessed July 10, 2003
24. Longley, P. A., Goodchild, M. F., Maguire, D. J., and Rhind, D. W. (2001). “Geographic Information Systems and Science”, 1st ed., John Wiley & Sons, Ltd, Chapter11, Page226
25. MAPOBJECTS (2003). “MapObjects – Java Edition”, http://www.esri.com/software/mojava/, accessed May 14, 2003
26. Macdonald, A (2001). “Building a Geodatabase”, ESRI, Incorporated, Chapter 1, 2001
27. Morais, M., 2000: Realizing the Benefits of an N-Tiered Enterprise GIS : 2000 ESRI User Conference taking place in San Diego, California from June 26 through June 30
28. Mineter, M. J., Dowers, S., and Gittings, B. M. (2000). “Towards a HPC Framework for Integrated Processing of Geographical Data: Encapsulating the complexity of Parallel Algorithms”, Transactions in GIS Volume 4 Issue 3, Pages 245-262
29. Mineter, M. J., and Dowers, S. (1999). “Parallel processing for geographical applications: A layered approach”, Journal of Geographical Systems 1:61-74
30. LLNL, (2003). “Introduction to Parallel Computing,”
http://www.llnl.gov/computing/tutorials/parallel_comp, accessed July 10, 2003
31. SDTS, (1997). “American National Standard for Information Systems – Spatial Data Transfer Standard (SDTS) – Part 1. Logical Specifications,” Draft for review, Published by American National Standard Institute, New York, page 5
32. OGC, (2003). “OpenGIS® Implementation Specifications,”