| INVESTIGATION
Measuring Genetic Differentiation from Pool-seq Data
Valentin Hivert,*,†Raphaël Leblois,*,†Eric J. Petit,‡Mathieu Gautier,*,†,1and Renaud Vitalis*,†,1,2
*CBGP, INRA, CIRAD, IRD, Montpellier SupAgro, Univ Montpellier, 34988 Montferrier-sur-Lez Cedex, France,†Institut de Biologie Computationnelle, Univ Montpellier, 34095 Montpellier Cedex, France, and‡ESE, Ecology and Ecosystem Health, INRA, Agrocampus Ouest, 35042 Rennes, Cedex, France ORCID IDs: 0000-0002-5144-6956 (V.H.); 0000-0002-3051-4497 (R.L.); 0000-0001-5058-5826 (E.J.P.); 0000-0001-7257-5880 (M.G.); 0000-0001-7096-3089 (R.V.)
ABSTRACT The advent of high throughput sequencing and genotyping technologies enables the comparison of patterns of poly-morphisms at a very large number of markers. While the characterization of genetic structure from individual sequencing data remains expensive for many nonmodel species, it has been shown that sequencing pools of individual DNAs (Pool-seq) represents an attractive and cost-effective alternative. However, analyzing sequence read counts from a DNA pool instead of individual genotypes raises statistical challenges in deriving correct estimates of genetic differentiation. In this article, we provide a method-of-moments estimator ofFST for Pool-seq data, based on an analysis-of-variance framework. We show, by means of simulations, that this new estimator is unbiased and outperforms previously proposed estimators. We evaluate the robustness of our estimator to model misspecification, such as sequencing errors and uneven contributions of individual DNAs to the pools. Finally, by reanalyzing published Pool-seq data of different ecotypes of the prickly sculpin Cottus asper, we show how the use of an unbiased FST estimator may question the in-terpretation of population structure inferred from previous analyses.
KEYWORDSFST; genetic differentiation; pool sequencing; population genomics
I
T has long been recognized that the subdivision of species into subpopulations, social groups, and families fosters ge-netic differentiation (Wahlund 1928; Wright 1931). Charac-terizing genetic differentiation as a means to infer unknown population structure is therefore fundamental to population genetics andfinds applications in multiple domains, includ-ing conservation biology, invasion biology, association map-ping, and forensics, among many others. In the late 1940s and early 1950s, Malécot (1948) and Wright (1951) intro-duced F-statistics to partition genetic variation within and between groups of individuals (Holsinger and Weir 2009; Bhatiaet al.2013). Since then, the estimation ofF-statistics has become standard practice (see, e.g., Weir 1996, 2012; Weir and Hill 2002) and the most commonly used estimatorsofFSThave been developed in an analysis-of-variance frame-work (Cockerham 1969, 1973; Weir and Cockerham 1984), which can be recast in terms of probabilities of identity of pairs of homologous genes (Cockerham and Weir 1987; Rousset 2007; Weir and Goudet 2017).
Assuming that molecular markers are neutral, estimates of
FSTare typically used to quantify genetic structure in natural populations, which is then interpreted as the result of demo-graphic history (Holsinger and Weir 2009): largeFSTvalues are expected for small populations among which dispersal is limited (Wright 1951), or between populations that have long diverged in isolation from each other (Reynoldset al.
1983). When dispersal is spatially restricted, a positive re-lationship betweenFSTand the geographical distance for pairs of populations generally holds (Slatkin 1993; Rousset 1997). It has also been proposed to characterize the heterogeneity of
FST estimates across markers for identifying loci that are tar-geted by selection (Cavalli-Sforza 1966; Lewontin and Krakauer 1973; Beaumont and Nichols 1996; Vitaliset al.2001; Akey
et al.2002; Beaumont 2005; Weiret al.2005; Lotterhos and Whitlock 2014, 2015; Whitlock and Lotterhos 2015).
Next-generation sequencing (NGS) technologies provide unprecedented amounts of polymorphism data in both model Copyright © 2018 by the Genetics Society of America
doi:https://doi.org/10.1534/genetics.118.300900
Manuscript received March 9, 2018; accepted for publication July 21, 2018; published Early Online July 25, 2018.
Supplemental material available at Figshare: https://doi.org/10.25386/genetics. 6856781.
1These authors are joint senior authors on this work.
2Corresponding author: Centre de Biologie pour la Gestion des Populations, Campus
and nonmodel species (Ellegren 2014). Although the se-quencing strategy initially involved individually tagged sam-ples in humans (The International HapMap Consortium 2005), whole-genome sequencing of pools of individuals (Pool-seq) is being increasingly used for population genomic studies (Schlötterer et al. 2014). Because it consists of se-quencing libraries of pooled DNA samples and does not re-quire individual tagging of sequences, Pool-seq provides genome-wide polymorphism data at considerably lower cost than sequencing of individuals (Schlötterer et al. 2014). However, non-equimolar amounts of DNA from all individu-als in a pool and stochastic variation in the amplification efficiency of individual DNAs have raised concerns with re-spect to the accuracy of the so-obtained allele frequency es-timates, particularly at low sequencing depth and with small pool sizes (Cutler and Jensen 2010; Anderson et al.2014; Ellegren 2014). Nonetheless, it has been shown that, at equal sequencing efforts, Pool-seq provides similar, if not more accurate, allele frequency estimates than individual-based analyses (Futschik and Schlötterer 2010; Gautier et al.
2013). The problem is different for diversity and differenti-ation parameters, which depend on second moments of al-lele frequencies or, equivalently, on pairwise measures of genetic identity: with Pool-seq data, it is indeed impossi-ble to distinguish pairs of reads that are identical because they were sequenced from a single gene from pairs of reads that are identical because they were sequenced from two distinct genes that are identical in state (IIS) (Ferrettiet al.
2013).
Appropriate estimators of diversity and differentiation parameters must therefore be sought to account for both the sampling of individual genes from the pool and the sampling of reads from these genes. There has been several attempts to define estimators for the parameterFSTfor Pool-seq data (Kofleret al.2011; Ferrettiet al.2013), from ratios of heterozygosities (or from probabilities of genetic identity between pairs of reads) within and between pools. In the following, we will argue that these estimators are biased (i.e., they do not converge toward the expected value of the parameter) and that some of them have undesired statistical properties (i.e., the bias depends on sample size and cover-age). Here, following Cockerham (1969, 1973), Weir and Cockerham (1984), Weir (1996), Weir and Hill (2002), and Rousset (2007), we define a method-of-moments esti-mator of the parameter FST using an analysis-of-variance framework. We then evaluate the accuracy and precision of this estimator, based on the analysis of simulated data sets, and compare it to estimates defined in the software package PoPoolation2 (Kofleret al.2011) and in Ferrettiet al.(2013). Furthermore, we test the robustness of our estimators to model misspecifications (including unequal contributions of individuals in pools and sequencing errors). Finally, we rean-alyze the prickly sculpin (Cottus asper) Pool-seq data (pub-lished by Dennenmoseret al.2017), and show how the use of biasedFSTestimators in previous analyses may challenge the interpretation of population structure.
Note that throughout this article, we use the term“gene”to designate a segregating genetic unit (in the sense of the “Mendelian gene”from Orgogozo et al.2016). We further use the term“read”in a narrow sense, as a sequenced copy of a gene. For the sake of simplicity, we will use the term “Ind-seq”to refer to analyses based on individual data, for which we further assume that individual genotypes are called with-out error.
Model
F-statistics may be described as intraclass correlations for the IIS probability of pairs of genes (Cockerham and Weir 1987; Rousset 1996, 2007).FST is best defined as:
FST[
Q12Q2 12Q2;
(1)
where Q1 is the IIS probability for genes sampled within subpopulations, andQ2is the IIS probability for genes sam-pled between subpopulations. In the following, we develop an estimator of FST for Pool-seq data by decomposing the total variance of read frequencies in an analysis-of-variance framework. A complete derivation of the model is provided in the Supplemental Material, File S1.
For the sake of clarity, the notation used throughout this article is given in Table 1. We first derive our model for a single locus and eventually provide a multilocus estimator of
FST. Consider a sample ofndsubpopulations, each of which is made ofnigenesði¼1;. . .;ndÞsequenced in pools (henceni is the haploid sample size of theith pool). We definecijas the number of reads sequenced from genejðj¼1;. . .;niÞin sub-populationiat the locus considered. Note thatcijis a latent variable that cannot be directly observed from the data. Let
Xijr:k be an indicator variable for readrðr¼1;. . .;cijÞfrom gene j in subpopulation i, such that Xijr:k¼1 if the rth read from the jth gene in the ith deme is of type k, and
Xijr:k¼0 otherwise. In the following, we use standard dot notation for sample averages, i.e.: Xij:k[
P
rXijr:k=cij;
Xi:k[ P
j P
rXijr:k= P
jcij; and X:k[ P
i P
j P
rXijr:k= P
i P
jcij: The analysis-of-variance is based on the computation of sums of squares, as follows:
Xnd
i
Xni
j
Xcij
r
Xijr:k2X:k
2
¼Xnd
i
Xni
j
Xcij
r
Xijr:k2Xij:k
2
þX
nd
i
Xni
j
Xcij
r
Xij:k2Xi:k
2
þX
nd
i
Xni
j
Xcij
r
Xi:k2X:k
2
As is shown in File S1, the expected sums of squares depend on the expectation of the allele frequencypkover all replicate populations sharing the same evolutionary history, as well as on the IIS probabilityQ1:kthat two genes in the same pool are both of typek, and the IIS probabilityQ2:k that two genes from different pools are both of typek. Taking expectations (see the detailed computations in File S1), one has:
ESSR:k
¼0 (3)
for reads within individual genes, since we assume that there is no sequencing error,i.e., all the reads sequenced from a single gene are identical andXijr:k¼Xij:kfor allr. For reads between genes within pools, we get:
ESSI:k
¼C12D2
pk2Q1:k
; (4)
whereC1[ P
i P
jcij¼ P
iC1iis the total number of reads in the full sample (total coverage),C1iis the coverage of theith pool, and D2[
P i
C1iþni21
=ni: D2 arises from the as-sumption that the distribution of the read countscijis multi-nomial (i.e., that all genes contribute equally to the pool of reads; see Equation A15 in File S1). For reads between genes from different pools, we have:
ESSP:k
¼
C12 C2 C1
Q1:k2Q2:k
þD22D⋆2
pk2Q1:k
;
(5)
where C2[ P
iC21i and D⋆2[
h
P
iC1iðC1iþni21Þ=ni i.
C1 (see Equation A16 in File S1). Rearranging Equation 4 and Equation 5 and summing over alleles, we get:
Q12Q2¼
C12D2
ESSP2D22D⋆2
ESSI
C12D2
C12C2=C1
(6)
and
12Q2¼
C12D2
ESSPþnc21
D22D⋆2
ESSI
C12D2
C12C2=C1
;
(7)
wherenc[
C12C2=C1
=D22D⋆2
:LetMSI[SSI=ðC12D2Þ andMSP[SSP=ðD22D⋆2Þ:Then, using the definition ofFST from Equation 1, we have:
FST[
Q12Q2 12Q2 ¼
EMSP2EMSI
EMSPþnc21
EMSI; (8)
which yields the method-of-moments estimator
^
FpoolST ¼ MSP2MSI MSPþnc21
MSI; (9)
where
MSI¼ 1
C12D2 X
k
Xnd
i C1ip^i:k
12p^i:k
(10)
and
MSP¼ 1
D22D⋆2 X
k
Xnd
i C1i
^
pi:k2p^k
2
(11)
(see Equations A25 and A26 in File S1). In Equation 10 and Equation 11, p^i:k[Xi:k is the average frequency of reads of type k within the ith pool, and p^k[X:k is the average frequency of reads of type k in the full sample. Note that from the definition ofX:k;p^k[
P i
P j
P rXijr:k= P
i P
jcij¼ P
iC1ip^i:k= P
iC1i is the weighted average of the sample frequencies with weights equal to the pool coverage. This is equivalent to the weighted analysis-of-variance in Cockerham (1973) (see also Weir and Cockerham 1984; Weir 1996; Weir and Hill 2002; Rousset 2007; Weir and
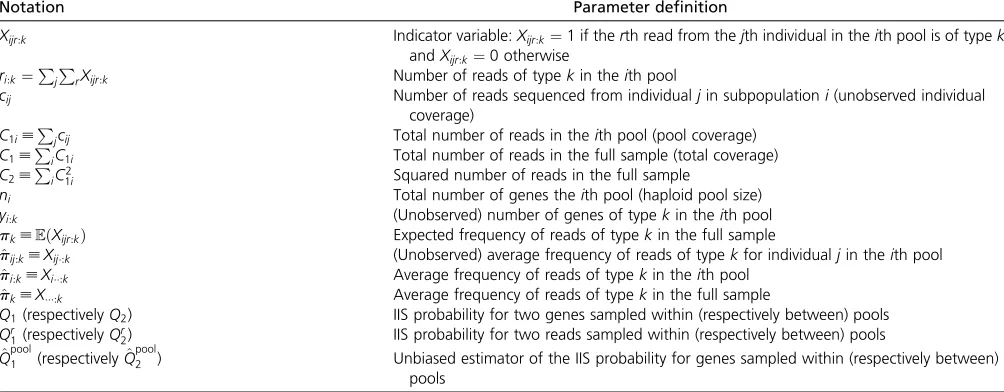
Table 1 Summary of main notations used
Notation Parameter definition
Xijr:k Indicator variable:Xijr:k¼1 if therth read from thejth individual in theith pool is of typek, andXijr:k¼0 otherwise
ri:k¼PjPrXijr:k Number of reads of typekin theith pool
cij Number of reads sequenced from individualjin subpopulationi(unobserved individual
coverage)
C1i[Pjcij Total number of reads in theith pool (pool coverage)
C1[PiC1i Total number of reads in the full sample (total coverage)
C2[PiC21i Squared number of reads in the full sample
ni Total number of genes theith pool (haploid pool size)
yi:k (Unobserved) number of genes of typekin theith pool
pk[EðXijr:kÞ Expected frequency of reads of typekin the full sample
^
pij:k[Xij:k (Unobserved) average frequency of reads of typekfor individualjin theith pool ^
pi:k[Xi:k Average frequency of reads of typekin theith pool
^
pk[X:k Average frequency of reads of typekin the full sample
Q1(respectivelyQ2) IIS probability for two genes sampled within (respectively between) pools
Qr
1(respectivelyQr2) IIS probability for two reads sampled within (respectively between) pools
^
Qpool1 (respectivelyQ^ pool
Goudet 2017). Finally, the full expression of^FpoolST in terms of sample frequencies develops as:
If we take the limit case where each gene is sequenced exactly once, we recover the Ind-seq model: assuming
cij¼1 for allði;jÞ;thenC1 ¼ Pnd
i ni;C2¼ Pnd
i n2i;D2¼nd; and D⋆2¼1: Therefore, nc¼ ðC12C2=C1Þ=ðnd21Þ; and Equation 9 reduces exactly to the estimator ofFSTfor hap-loids: see Weir (1996), p. 182, and Rousset (2007), p. 977. As in Reynoldset al.(1983), Weir and Cockerham (1984), Weir (1996), and Rousset (2007), a multilocus estimate is derived as the sum of locus-specific numerators over the sum of locus-specific denominators:
^
FST¼ P
lMSPl2MSIl
P
lMSPlþ ðnc21ÞMSIl;
(13)
whereMSIandMSPare subscripted withlto denote thelth locus. For Ind-seq data, Bhatiaet al.(2013) refer to this multi-locus estimate as a “ratio of averages”as opposed to an “average of ratios,”which would consist of averaging single-locusFSTover loci. This approach is justified in the appendix of Weir and Cockerham (1984) and in Bhatiaet al.(2013), who analyzed both estimates by means of coalescent simula-tions. Note that Equation 13 assumes that the pool size is equal across loci. Also note that the construction of the esti-mator in Equation 13 is different from Weir and Cockerham’s (1984). These authors defined their multilocus estimator as a ratio of sums of components of variance (a,b, andcin their notation) over loci, which give the same weight to all loci whatever the number of sampled genes at each locus. Equa-tion 13 follows GENEPOP’s raEqua-tionale (Rousset 2008) instead, which gives more weight to loci that are more intensively covered.
Materials and Methods
Simulation study
Generating individual genotypes: Wefirst generated indi-vidual genotypes using ms (Hudson 2002), assuming an island model of population structure (Wright 1931). For each simulated scenario, we considered eight demes, each made of N¼5000 haploid individuals. The migration rate (m) wasfixed to achieve the desired value of FST (0.05 or 0.2), using equation 6 in Rousset (1996) leading to,
e.g.,M[2Nm¼16:569 forFST¼0:05 and M¼3:489 for
FST¼0:20:The mutation rate was set atm¼1026; giving
u[2Nm¼0:01:We considered eitherfixed or variable sam-ple sizes across demes. In the latter case, the haploid samsam-ple
sizenwas drawn independently for each deme from a Gauss-ian distribution with mean 100 and SD 30; this number was rounded up to the nearest integer, with a minimum of 20 and maximum of 300 haploids per deme. We generated a very large number of sequences for each scenario and sampled independent single nucleotide polymorphisms (SNPs) from sequences with a single segregating site. Each scenario was replicated 50 times (500 times for Figure 3 and Figure S2).
Pool sequencing:For each ms simulated data set, we gener-ated Pool-seq data by drawing reads from a binomial distri-bution (Gautieret al.2013). More precisely, we assume that for each SNP, the numberri:kof reads of allelic typekin pooli follows:
ri:k Bin
yi:k ni;di
; (14)
whereyi:kis the number of genes of typekin theith pool,niis the total number of genes in pooli(haploid pool size), anddi is the simulated total coverage for pooli. In the following, we either consider afixed coverage, withdi¼Dfor all pools and loci, or a varying coverage across pools and loci, with
diPoisðDÞ:
Sequencing error:We simulated sequencing errors occurring at rate me¼0:001;which is typical of Illumina sequencers (Glenn 2011; Ross et al.2013). We assumed that each se-quencing error modifies the allelic type of a read to one of three other possible states with equal probability (there are therefore four allelic types in total, corresponding to four nucleotides). Note that only biallelic markers are retained in thefinal data sets. Also note that, since we initiated this procedure with polymorphic markers only, we neglect se-quencing errors that would create spurious SNPs from mono-morphic sites. However, such SNPs should be rare in real data sets, since markers with a low minimum read count (MRC) are generallyfiltered out.
Experimental error:Nonequimolar amounts of DNA from all individuals in a pool and stochastic variation in the amplifi-cation efficiency of individual DNAs are sources of experimen-tal errors in Pool-seq. To simulate experimenexperimen-tal errors, we used the model derived by Gautieret al.(2013). In this model, it is assumed that the contributionhij¼cij=C1iof each genej
^
FpoolST ¼
P
k
h
ðC12D2Þ
Pnd
i C1iðp^i:k2p^kÞ22
D22D⋆2
Pnd
i C1ip^i:kð12p^i:kÞ
i
P
k
h
ðC12D2Þ
Pnd
i C1iðp^i:k2p^kÞ2þ ðnc21Þ
D22D⋆2 Pnd
i C1ip^i:kð12p^i:kÞ
to the total coverage of theith poolðC1iÞfollows a Dirichlet distribution:
hij 1#j#ni Dir
r
ni
; (15)
where the parameter r controls the dispersion of gene contributions around the valuehij¼1=ni;which is expected if all genes contributed equally to the pool of reads. For convenience, we define the experimental error e as the coefficient of variation of hij; i.e., e[
ffiffiffiffiffiffiffiffiffiffiffiffiffi
VðhijÞ
q .
EðhijÞ ¼
ffiffiffiffiffiffiffiffiffiffiffiffiffiffiffiffiffiffiffiffiffiffiffiffiffiffiffiffiffiffiffiffiffi
ðni21Þ=ðrþ1Þ
p
(see Gautieret al.2013). When
etends toward 0 (or equivalently, whenrtends to infinity),
all individuals contribute equally to the pool and there is no experimental error. We tested the robustness of our estimates to values ofebetween 0.05 and 0.5. The casee¼0:5 could correspond, for example, to a situation where (forni¼10) five individuals contribute 2:83 more reads than the other five individuals.
Other estimators
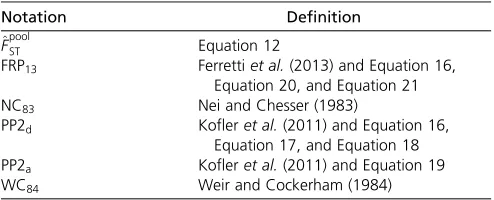
For the sake of clarity, a summary of the notation of the FST estimators used throughout this article is given in Table 2.
PP2d:This estimator ofFSTis implemented by default in the software package PoPoolation2 (Kofler et al. 2011). It is based on a definition of the parameterFST as the overall re-duction in average heterozygosity relative to the total com-bined population (see,e.g., Nei and Chesser 1983):
PP2d[
^
HT2H^S
^
HT
; (16)
where H^S is the average heterozygosity within subpopu-lations, and H^T is the average heterozygosity in the total population (obtained by pooling together all subpopu-lations to form a single virtual unit). In PoPoolation2,
^
HS is the unweighted average of within-subpopulation heterozygosities:
^
HS¼ 1 nd
Xnd
i
ni ni21
C1i C1i21
12X
kp^ 2 i:k
(17)
(using the notation from Table 1). Note that in PoPoolation2, PP2d is restricted to the case of two subpopulations only (nd¼2). The two ratios in the right-hand side of Equation 17 are presumably borrowed from Nei (1978) to provide an unbiased estimate, although we found no formal justification for the expression in Equation 17 for Pool-seq data. The total heterozygosity is computed as (using the notation from Table 1):
^
HT¼ miniðniÞ miniðniÞ21
!
miniðC1iÞ
miniðC1iÞ21
! 12X
k
^
p2k
:
(18)
PP2a:This is the alternative estimator ofFSTprovided in the software package PoPoolation2. It is based on an interpreta-tion by Kofleret al.(2011) of Karlssonet al.’s (2007)
estima-tor ofFST, as:
PP2a[
^
Qr12Q^ r 2
12Q^r2 ; (19)
where Q^r1 and Q^ r
2 are the frequencies of identical pairs of reads within and between pools, respectively, computed by simple counting of IIS pairs. These are estimates ofQr
1;the IIS probability for two reads in the same pool (whether they are sequenced from the same gene or not), andQr2;the IIS ability for two reads in different pools. Note that the IIS prob-abilityQr
1is different fromQ1in Equation 1, which, from our definition, represents the IIS probability between distinct genes in the same pool. This approach therefore confounds pairs of reads within pools that are identical because they were se-quenced from a single gene from pairs of reads that are iden-tical because they were sequenced from distinct, yet IIS genes.
FRP13:This estimator ofFSTwas developed by Ferrettiet al. (2013) (see their equations 3, 10, 11, 12, and 13). Ferretti
et al.(2013) use the same definition ofFSTas in Equation 16 above, although they estimate heterozygosities within and between pools as “average pairwise nucleotide diversities,” which, from their definitions, are formally equivalent to IIS probabilities. In particular, they estimate the average hetero-zygosity within pools as (using the notation from Table 1):
^
HS¼ 1 nd
Xnd
i
ni ni21
12Q^r1i (20)
and the total heterozygosity among thendpopulations as:
^
HT¼ 1
n2 d 2 4Xnd
i
ni ni21
12Q^r1i
þX
nd
i6¼i9
12Q^r2ii9
3 5: (21)
Analyses of Ind-seq data
For the comparison of Ind-seq and Pool-seq data sets, we computedFSTon subsamples of 5000 loci. These subsamples were defined so that only those loci that were polymorphic in all coverage conditions were retained, and the same loci were
Table 2 Definition of theFSTestimators used in the text
Notation Definition ^
FpoolST Equation 12
FRP13 Ferrettiet al.(2013) and Equation 16,
Equation 20, and Equation 21
NC83 Nei and Chesser (1983)
PP2d Kofleret al.(2011) and Equation 16, Equation 17, and Equation 18 PP2a Kofleret al.(2011) and Equation 19
used for the analysis of the corresponding Ind-seq data. For the latter, we used either the Nei and Chesser’s (1983) esti-mator based on a ratio of heterozygosity (see Equation 16 above), hereafter denoted by NC83;or the analysis-of-variance estimator developed by Weir and Cockerham (1984), here-after denoted by WC84:
All the estimators were computed using custom functions in the R software environment for statistical computing, version 3.3.1 (R Core Team 2017). All of these functions were carefully checked against available software packages to ensure that they provided strictly identical estimates.
Application example: C. asper
Dennenmoser et al. (2017) investigated the genomic basis of adaption to osmotic conditions in the prickly sculpin (C. asper), an abundant euryhalinefish in northwestern North America. To do so, they sequenced the whole genome of pools of individuals from two estuarine populations (Capi-lano River Estuary, CR; Fraser River Estuary, FE) and two freshwater populations (Pitt Lake, PI; Hatzic Lake, HZ) in southern British Columbia (Canada). We downloaded the four corresponding BAM files from the Dryad Digital Repository (http://dx.doi.org/10.5061/dryad.2qg01) and combined them into a single mpileup file using SAMtools version 0.1.19 (Li et al.2009) with default options, except the maximum depth per BAM that was set to 5000 reads. The resultingfile was further processed using a custom awk script to call SNPs and compute read counts, after discarding bases with a base alignment quality (BAQ) score,25. A position was then considered a SNP if: (1) only two different nucleo-tides with a read count.1 were observed (nucleotides with
#1 read being considered as a sequencing error); (2) the coverage was between 10 and 300 in each of the four align-mentfiles; (3) the minor allele frequency, as computed from read counts, was $0:01 in the four populations. Thefinal data set consisted of 608,879 SNPs.
Our aim here was to compare the population structure inferred from pairwise estimates of FST using the estimator
^
FpoolST (Equation 12) with that of PP2d. To determine which of the two estimators performs better, we then compared the
population structure inferred from F^poolST and PP2d to that inferred from the Bayesian hierarchical model implemented in the software package BayPass (Gautier 2015). BayPass allows the robust estimation of the scaled covariance matrix of allele frequencies across populations for Pool-seq data, which is known to be informative about population history (Pickrell and Pritchard 2012). The elements of the estimated matrix can be interpreted as pairwise and population-specific estimates of differentiation (Coopet al.2010) and therefore provide a comprehensive description of population structure that makes full use of the available data.
Data availability
An R package called poolfstat, which implements FST esti-mates for Pool-seq data, is available at the Comprehensive R Archive Network (CRAN):https://cran.r-project.org/web/
packages/poolfstat/index.html.
The authors state that all data necessary for confirming the conclusions presented in this article are fully represented within the article,figures, and tables. Supplemental material (including Figures S1–S4, Tables S1–S3, and a complete der-ivation of the model in File S1) available at Figshare:https://
doi.org/10.25386/genetics.6856781.
Results
Comparing Ind-seq and Pool-seq estimates of FST
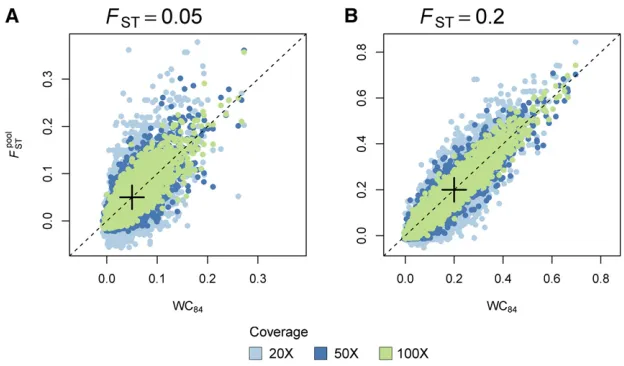
Single-locus estimates of^FpoolST are highly correlated with the classical estimates of WC84 (Weir and Cockerham 1984) computed on the individual data that were used to generate the pools in our simulations (see Figure 1). The variance of
^
FpoolST across independent replicates decreases as the coverage increases. The correlation between^FpoolST and WC84is stronger for multilocus estimates (see Figure S1A).
Comparing Pool-seq estimators of FST
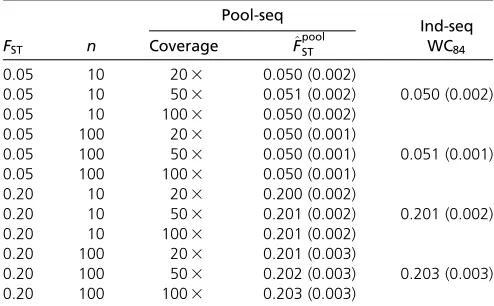
We found that our estimator F^poolST has extremely low bias (,0.5% over all scenarios tested: see Table 3 and Tables S1–S3). In other words, the average estimates across multiple
Figure 1 Single-locus estimates ofFST:We compared single-locus estimates ofFSTbased on allele count data inferred from individual genotypes (Ind-seq), using the WC84estimator, to^F
pool
loci and replicates closely equal the expected value of theFST parameter, as given by equation 6 in Rousset (1996), which is based on the computation of IIS probabilities in an island model of population structure. In all the situations examined, the bias does not depend on the sample size (i.e., the size of each pool) or on the coverage (see Figure 2). Only the variance of the estimator across independent replicates decreases as the sample size increases and/or as the coverage increases. At high coverage, the mean and root mean squared error (RMSE) of
^
FpoolST over independent replicates are virtually indistinguish-able from that of the WC84estimator (see Table S1).
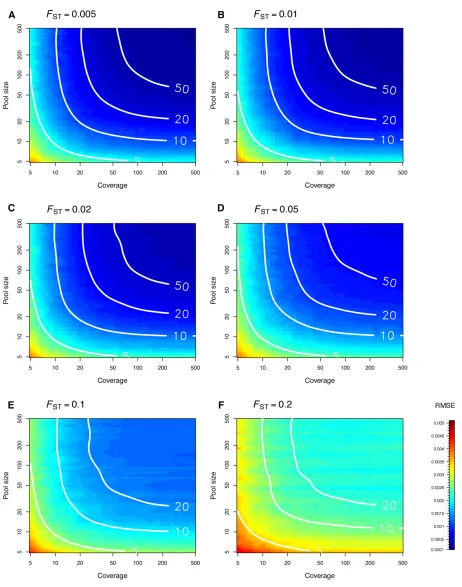
Figure 3 shows the RMSE ofFSTestimates for a wide range of pool sizes and coverages. The RMSE decreases as the pool size and/or the coverage increases. The FST estimates are more precise and accurate when differentiation is low. Figure 3 provides some clues to evaluate the pool size and the cov-erage that is necessary to achieve the same RMSE as for Ind-seq data. Consider, for example, the case of samples ofn¼20 haploids. For FST#0:05 (in the conditions of our simula-tions), the RMSE of FST estimates based on Pool-seq data tends to the RMSE of FST estimates based on Ind-seq data either by sequencing pools of200 haploids at 203, or by sequencing pools of 20 haploids at 2003. However, the same precision and accuracy are achieved by sequencing
50 haploids at503.
Conversely, we found that PP2d(the default estimator of
FST implemented in the software package PoPoolation2) is biased when compared to the expected value of the parame-ter. We observed that the bias depends on both the sample size and the coverage (see Figure 2). We note that, as the coverage and the sample size increase, PP2dconverges to the estimator NC83(Nei and Chesser 1983) computed from indi-vidual data (see Figure S1B). This argument was used by Kofleret al.(2011) to validate their approach, even though the estimates of PP2ddepart from the true value of the pa-rameter (Figure S1, B and C).
The second of the two estimators ofFST implemented in PoPoolation2, which we refer to as PP2a;is also biased (see Figure 2). We note that the bias decreases as the sample size increases. However, the bias does not depend on the cov-erage (only the variance over independent replicates de-pends on coverage). The estimator developed by Ferretti
et al. (2013), which we refer to as FRP13; is also biased (see Figure 2). However, the bias does not depend on the pool size or on the coverage (only the variance over indepen-dent replicates depends on coverage). FRP13converges to the estimator NC83;computed from individual data (see Figure 2). At high coverage, the mean and RMSE over independent replicates are virtually indistinguishable from that of the NC83estimator.
Lastly, we stress that our estimatorF^poolST provides estimates for multiple populations and is therefore not restricted to pairwise analyses, contrary to PoPoolation2’s estimators. We show that, even at low sample size and low coverage, Pool-seq estimates of differentiation are virtually indistin-guishable from classical estimates for Ind-seq data (see Table 3).
Robustness to unbalanced pool sizes and variable sequencing coverage
We evaluated the accuracy and the precision of the estimator
^
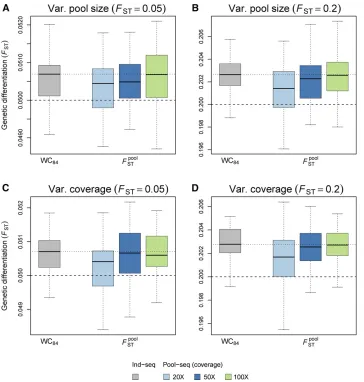
FpoolST when sample sizes differ across pools and when the coverage varies across pools and loci (see Figure 4). We found that, at low coverage, unequal sampling or variable coverage causes a negligible departure from the median of WC84estimates computed on individual data, which vanishes as the coverage increases. At 1003coverage, the distribution of ^FpoolST estimates is almost indistinguishable from that of WC84(see Figure 4 and Tables S2 and S3).
Robustness to sequencing and experimental errors
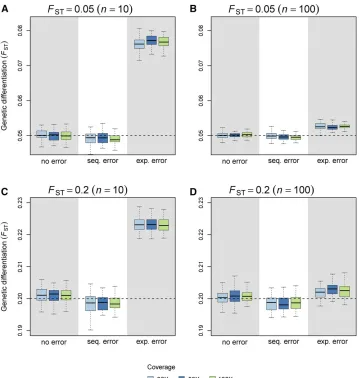
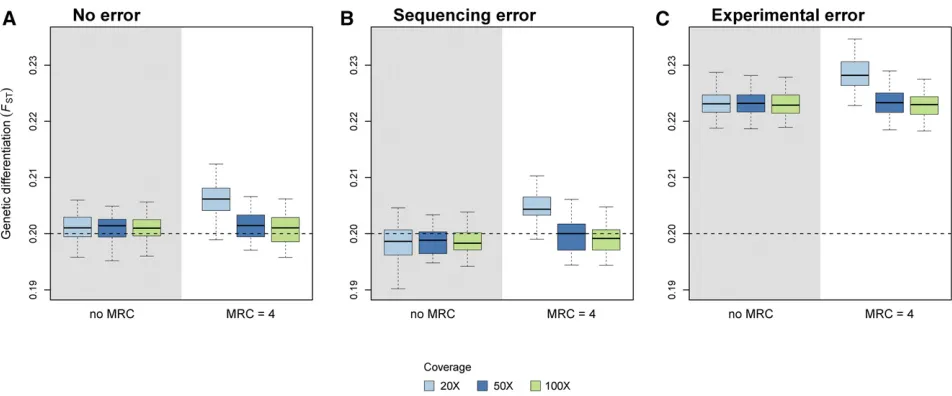
Figure 5 shows that sequencing errors cause a negligible neg-ative bias for ^FpoolST estimates. Filtering (using an MRC of 4) improves estimation slightly, but only at high coverage (Fig-ure 6B). It must be noted, however, thatfiltering increases the bias in the absence of sequencing error, especially at low coverage (Figure 6A). With experimental error, i.e., when individuals do not contribute evenly to thefinal set of reads, we observed a positive bias for^FpoolST estimates (Figure 5). We note that the bias decreases as the size of the pools increases. Figure S2 shows the RMSE ofFSTestimates for a wider range of pool sizes, coverage, and experimental error rate (e). For
e$0:25;increasing the coverage cannot improve the quality of the inference if the pool size is too small. When Pool-seq experiments are prone to large experimental error rates, in-creasing the size of pools is the only way to improve the estimation of FST:Filtering (using an MRC of 4) does not improve estimation (Figure 6C).
Application example
The reanalysis of the prickly sculpin data revealed larger pairwise estimates of multilocusFSTusing the PP2destimator,
Table 3 OverallFSTestimates from multiple pools
FST n
Pool-seq
Ind-seq Coverage ^FpoolST WC84
0.05 10 203 0.050 (0.002)
0.05 10 503 0.051 (0.002) 0.050 (0.002)
0.05 10 1003 0.050 (0.002)
0.05 100 203 0.050 (0.001)
0.05 100 503 0.050 (0.001) 0.051 (0.001)
0.05 100 1003 0.050 (0.001)
0.20 10 203 0.200 (0.002)
0.20 10 503 0.201 (0.002) 0.201 (0.002)
0.20 10 1003 0.201 (0.002)
0.20 100 203 0.201 (0.003)
0.20 100 503 0.202 (0.003) 0.203 (0.003)
0.20 100 1003 0.203 (0.003)
Multilocus^FpoolST estimates were computed for various conditions of expectedFST;
pool size (n), and coverage in an island model withnd¼8 subpopulations (pools).
The mean (RMSE) is over 50 independent simulated data sets, each made of 5000 loci. For comparison, we computed multilocus WC84estimates from individual
as compared to^FpoolST (see Figure 7A). Furthermore, we found that^FpoolST estimates are smaller for within-ecotype pairwise comparisons as compared to between-ecotype compari-sons. Therefore, the inferred relationships between samples based on pairwise ^FpoolST estimates show a clear-cut struc-ture, separating the two estuarine samples from the freshwater ones (see Figure 7C). We did not recover the same struc-ture using PP2destimates (see Figure 7B). Additionally, the scaled covariance matrix of allele frequencies across samples
is consistent with the structure inferred fromF^poolST estimates (see Figure 7D).
Discussion
Whole-genome sequencing of pools of individuals is increas-ingly popular for population genomic research on both model and nonmodel species (Schlötterer et al.2014). The development of dedicated software packages (reviewed in
Figure 2 Precision and accuracy of pairwise estimators ofFST:We considered two estimators based on allele count data inferred from individual genotypes (Ind-seq): WC84and NC83:For Pool-seq data, we computed the two estimators implemented in the software package PoPoolation2, which we refer to as PP2dand PP2a;as well as the FRP13estimator and our estimator^F
pool
Figure 3 (A–F) Precision and accuracy of our estimator^FpoolST as a function of pool size and coverage for simulatedFSTvalues ranging from 0.005 to 0.2. Each density plot, which represents the RMSE of the estimator^FpoolST , was obtained using simple linear interpolation from a set of 44344 pairs of pool size and coverage values. For each pool size and coverage, 500 replicates of 5000 markers were simulated from an island model withnd¼8 demes. White isolines represent the RMSE of the WC84estimator computed from Ind-seq data for various sample sizes (n= 5, 10, 20, and 50). Each isoline was
Schlötterer et al. 2014) undoubtedly has something to do with the breadth of research questions that have been tackled using Pool-seq. However, the analysis of population structure from Pool-seq data are complicated by the double sampling process of genes from the pool and sequence reads from those genes (Ferrettiet al.2013).
The naive approach that consists of computing FST from read counts as if they were allele counts (e.g., as in Chenet al.
2016) ignores the extra variance brought by the random sampling of reads from the gene pool during Pool-seq exper-iments. Furthermore, such computation fails to consider the actual number of lineages in the pool (haploid pool size). Altogether, these limits may result in severely biased esti-mates of differentiation when the pool size is low (see Figure S3). A possible alternative is to computeFSTfrom allele counts imputed from read counts using a maximum-likelihood approach conditional on the haploid size of the pools (e.g., as in Smadjaet al.2012; Lebloiset al.2018), or from allele frequencies estimated using a model-based method which accounts for the sampling effects and the sequenc-ing error probabilities inherent to pooled NGS experiments (see Farielloet al.2017). However, these latter approaches may only be accurate in situations where the coverage is
much larger than pool size, allowing for a reduction of the sampling variance of reads (see Figure S3). We therefore developed a new estimator of the parameterFSTfor Pool-seq data in an analysis-of-variance framework (Cockerham 1969, 1973). The accuracy of this estimator is barely dis-tinguishable from that of the Weir and Cockerham’s (1984) estimator for individual data. Furthermore, it does not depend on the pool size or on the coverage, and it is robust to unequal pool sizes and varying coverage across demes and loci.
In our analysis, the frequency of reads within pools is a weighted average of the sample frequencies, with weights equal to the pool coverage. Therefore, our approach follows Cockerham’s (1973) one, which he referred to as a weighted analysis-of-variance (see also Weir and Cockerham 1984; Weir 1996; Weir and Hill 2002; Weir and Goudet 2017). With unequal pool sizes, weighted and unweighted analyses differ. As discussed recently in Weir and Goudet (2017), the unweighted approach seems appropriate when the between component exceeds the within component,i.e., whenFST is large (Tukey 1957). It turns out that optimal weighting depends upon the parameter to be estimated (Cockerham 1973) and is only efficient at lower levels of differentia-tion (Robertson 1962). In a likelihood analysis of the island
Figure 4 Precision and accuracy of FST estimates with varying pool size or vary-ing coverage. Our estimator^FpoolST was cal-culated from Pool-seq data over all demes and loci and compared to the es-timator WC84; computed from Ind-seq data. Each boxplot represents the distri-bution of multilocusFST estimates across 50 independent replicates of the ms sim-ulations. We used two migration rates, corresponding to (A and C) FST¼0:05 and (B and D)FST¼0:20:(A and B) The pool size was variable across demes, with haploid sample size n drawn indepen-dently for each deme from a Gaussian distribution with mean 100 and SD 30;
model, Rousset (2007) derived asymptotically efficient weights that are proportional to n2
i for the sum of squares of differ-ent samples (see also Robertson 1962). To the best of our knowledge, such optimal weighting has never been consid-ered in the literature.
Analysis-of-variance and probabilities of identity
In the analysis-of-variance framework,FSTis defined in Equa-tion 1 as an intraclass correlaEqua-tion for the probability of IIS (Cockerham and Weir 1987; Rousset 1996). Extensive statis-tical literature is available on estimators of intraclass corre-lations. Beside analysis-of-variance estimators, introduced in population genetics by Cockerham (1969, 1973), estimators based on the computation of probabilities of identical re-sponse within and between groups have been proposed (see,e.g., Fleiss 1971; Fleiss and Cuzick 1979; Mak 1988; Ridoutet al.1999; Wuet al.2012), which were originally referred to as kappa-type statistics (Fleiss 1971; Landis and Koch 1977). These estimators have later been endorsed in population genetics, where the“probability of identical response” was then interpreted as the frequency with which the genes are alike (Cockerham 1973; Cockerham
and Weir 1987; Weir 1996; Rousset 2007; Weir and Goudet 2017).
This suggests that, with Pool-seq data, another strategy could consist of computingFSTfrom IIS probabilities between (unobserved) pairs of genes, which requires that unbiased estimates of such quantities are derived from read count data. We have done this in the second section of File S1 and we provide alternative estimators of FST for Pool-seq data (see Equations A44 and A48 in File S1). These estimators (denoted by ^FpoolST 2PID and ~F
pool2PID
ST ) have exactly the same form as the analysis-of-variance estimator if the pools all have the same size and if the number of reads per pool is constant (Equation A33 in File S1). This echoes the derivations by Rousset (2007) for Ind-seq data, who showed that the analysis-of-variance approach (Weir and Cockerham 1984) and the simple strategy of estimating IIS probabilities by counting identical pairs of genes provide identical estimates when sample sizes are equal (see Equation A28 in File S1 and also Cockerham and Weir 1987; Weir 1996; Karlssonet al.2007). With unbalanced samples, we found that analysis-of-variance estimates have better precision and accuracy than IIS-based estimates, particularly for low levels of differentiation (see
Figure 5 Precision and accuracy of FST estimates with sequencing and experi-mental errors. Our estimator ^FpoolST was computed from Pool-seq data over all demes and loci without error, with sequencing error (occurring at rate me¼0:001), and with experimental error (e¼0:5). Each boxplot represents the distribution of multilocus FST estimates across 50 independent replicates of the ms simulations. We used two migra-tion rates, corresponding to (A and B)
Figure S4). Interestingly, we found that IIS-based estimates of FST for Pool-seq data have generally lower bias and vari-ance if the overall estimates of IIS probabilities within and between pools are computed as unweighted averages of population-specific or pairwise estimates (see Equations A39 and A43 in File S1), as compared to weighted averages (Equa-tions A46 and A47 in File S1). Equation A28 in File S1 further shows that our estimator may be rewritten as a function close toðQ^12Q^2Þ=ð12Q^2Þ;except that it also depends on the sum P
iðQ^1i2Q^1Þin both the numerator and the denominator. This suggests that if theQ1i’s differ among subpopulations, then our
estimator provides an estimate of an average of population-specificFST(Weir and Hill 2002; Weir and Goudet 2017).
It follows from the derivations in File S1 that the estimator PP2a(Equation 19) is biased because the IIS probability be-tween pairs of reads within a poolðQ^r1Þis a biased estimator of the IIS probability between pairs of distinct genes in that pool (see Equations A34–A36 in File S1). This is the case because the former confounds pairs of reads that are identical because they were sequenced from a single gene from pairs of reads that are identical because they were sequenced from distinct, yet IIS genes.
A more justified estimator of FST has been proposed by Ferretti et al. (2013), based on previous developments by Futschik and Schlötterer (2010). Note that, although they definedFST as a ratio of functions of heterozygosities, they actually worked with IIS probabilities (see Equation 20 and Equation 21). However, although Equation 20 is strictly iden-tical to Equation A39 in File S1, we note that they computed the total heterozygosity by integrating over pairs of genes sampled both within and between subpopulations (compare Equation 21 with Equation A43 in File S1), which may ex-plain the observed bias (see Figure 2).
Comparison with alternative estimators
An alternative framework to Weir and Cockerham’s (1984) analysis-of-variance has been developed by Masatoshi Nei and coworkers to estimate FST from gene diversities (Nei 1973, 1977, 1986; Nei and Chesser 1983). The estimator PP2d(see Equation 16, Equation 17, and Equation 18) imple-mented in the software package PoPoolation2 (Kofleret al.
2011) follows this logic. However, it has long been recog-nized that both frameworks are fundamentally different in that the analysis-of-variance approach considers both statis-tical and genetic (or evolutionary) sampling, whereas Nei and coworkers’ approach do not (Weir and Cockerham 1984; Excoffier 2007; Holsinger and Weir 2009). Further-more, the expectation of Nei and coworkers’estimators de-pend on the number of sampled populations, with a larger bias for lower numbers of sampled populations (Goudet 1993; Excoffier 2007; Weir and Goudet 2017). This is the case because the computation of the total diversity in Equa-tion 18 and EquaEqua-tion 21 includes the comparison of pairs of genes from the same subpopulation, whereas the computa-tion of IIS probabilities between subpopulacomputa-tions do not (see,
e.g., Excoffier 2007). Therefore, we do not recommend using
the estimator PP2d implemented in the software package PoPoolation2 (Kofleret al.2011).
Applications in evolutionary ecology studies
Pool-seq is being increasingly used in many application do-mains (Schlöttereret al.2014), such as conservation genetics (see,e.g., Fuentes-Pardo and Ruzzente 2017), invasion biol-ogy (see,e.g., Dexteret al.2018), and evolutionary biology in a broader sense (see,e.g., Colletet al.2016). These stud-ies use a large range of methods, which aim at characteriz-ing fine-scaled population structure (see,e.g., Fischer et al. Figure 6 Precision and accuracy ofFSTestimates with and withoutfiltering. Our estimator^F
pool
2017), reconstructing past demography (see,e.g., Chenet al.
2016; Lebloiset al.2018), or identifying footprints of natural or artificial selection (see,e.g., Chenet al.2016; Farielloet al.
2017; Lebloiset al.2018).
Here, we reanalyzed the Pool-seq data produced by Dennenmoser et al. (2017), who investigated the adaptive genomic divergence between freshwater and brackish-water ecotypes of the prickly sculpinC. asper, an abundant euryha-linefish in northwestern North America. Measuring pairwise genetic differentiation between samples using^FpoolST , we found a clear-cut structure separating the freshwater from the brackish-water ecotypes. Such genetic structure supports the hypothesis that populations are locally adapted to osmotic conditions in these two contrasted habitats, as discussed in Dennenmoseret al.(2017). This structure, which is at odds
with that inferred from PP2destimates, is not only supported by the scaled covariance matrix of allele frequencies, but also by previous microsatellite-based studies, which showed that populations were genetically more differentiated between eco-types than within ecoeco-types (Dennenmoseret al.2014, 2015).
Limits of the model and perspectives
We have shown that the stronger source of bias for the^FpoolST estimate is unequal contributions of individuals in pools. This is because we assume in our model that the read counts are multinomially distributed, which supposes that all genes con-tribute equally to the pool of reads (Gautieret al.2013),i.e., that there is no variation in DNA yield across individuals and that all genes have equal sequencing coverage (Rodeet al.
2018). Because the effect of unequal contribution is expected
Figure 7 Reanalysis of the prickly sculpin (C. asper) Pool-seq data. (A) We compare the pairwiseFSTestimates PP2dand^F pool
ST for all pairs of populations from the estuarine (CR and FE) and freshwater samples (PI and HZ). Within-ecotype comparisons are depicted as
•
and between-ecotype comparisons as:. (B and C) We show hierarchical cluster analyses based on (B) PP2dand (C)^Fpool
to be stronger with small pool sizes, it has been recom-mended to use Pool-seq with at least 50 diploid individuals per pool (Lynchet al.2014; Schlöttereret al.2014). However, this limit may be overly conservative for allele frequency estimates (Rode et al.2018) and we have shown here that we can achieve very good precision and accuracy ofFST esti-mates with smaller pool sizes. Furthermore, because geno-typic information is lost during Pool-seq experiments, we assume in our derivations that pools are haploid (and there-fore thatFISis nil). Analyzing nonrandom mating populations (e.g., in selfing species) is therefore problematic.
Finally, our model, as in Weir and Cockerham (1984), formally assumes that all populations provide independent replicates of some evolutionary process (Excoffier 2007; Holsinger and Weir 2009). This may be unrealistic in many natural populations, which motivated Weir and Hill (2002) to derive a population-specific estimator of FST for Ind-seq data (see also Vitalis et al. 2001). Even though the use of Weir and Hill’s (2002) estimator is still scarce in the literature (but see Weir et al. 2005; Vitalis 2012), Weir and Goudet (2017) recently proposed a reinterpretation of population-specific estimates ofFST in terms of allelic matching pro-portions, which are strictly equivalent to IIS probabilities between pairs of genes. It is therefore straightforward to extend Weir and Goudet’s (2017) estimator of population-specificFSTfor the analysis of Pool-seq data, using the un-biased estimates of IIS probabilities provided in File S1.
Acknowledgments
We thank Alexandre Dehne-Garcia for his assistance in using computer farms. We thank two anonymous reviewers for their positive comments and suggestions. Analyses were performed on the GenoToul bioinformatics platform Tou-louse Midi-Pyrénées (http://bioinfo.genotoul.fr) and the High Performance Computational platform of the Centre de Biologie pour la Gestion des Populations. This work is part of V.H.’s Ph.D.; V.H. was supported by a grant from the Institut National de la Recherche Agronomique’s Plant Health and Environment (SPE) Division and by the Biodi-vERsA project EXOTIC (ANR-13-EBID-0001). Part of this work was supported by the project SWING (ANR-16-CE02-0015) of the French National Research Agency, and by the CORBAM project of the French region Hauts-de-France.
Literature Cited
Akey, J. M., G. Zhang, L. Jin, and M. D. Shriver, 2002 Interrogating a high-density SNP map for signatures of natural selection. Ge-nome Res. 12: 1805–1814.https://doi.org/10.1101/gr.631202 Anderson, E. C., H. J. Skaug, and D. J. Barshis, 2014
Next-generation sequencing for molecular ecology: a caveat regard-ing pooled samples. Mol. Ecol. 23: 502–512. https://doi.org/ 10.1111/mec.12609
Beaumont, M. A., 2005 Adaptation and speciation: what canFST
tell us? Trends Ecol. Evol. 20: 435–440.https://doi.org/10.1016/ j.tree.2005.05.017
Beaumont, M. A., and R. A. Nichols, 1996 Evaluating loci for use in the genetic analysis of population structure. Proc. Biol. Sci. 263: 1619–1626.https://doi.org/10.1098/rspb.1996.0237 Bhatia, G., N. Patterson, S. Sankararaman, and A. L. Price,
2013 Estimating and interpretingFST: the impact of rare
var-iants. Genome Res. 23: 1514–1521. https://doi.org/10.1101/ gr.154831.113
Cavalli-Sforza, L., 1966 Population structure and human evolu-tion. Proc. R. Soc. Lond. B Biol. Sci. 164: 362–379.https://doi. org/10.1098/rspb.1966.0038
Chen, J., T. Källman, X.-F. Ma, G. Zaina, M. Morgante et al., 2016 Identifying genetic signatures of natural selection using pooled populations sequencing inPicea abies. G3 (Bethesda) 6: 1979–1989.https://doi.org/10.1534/g3.116.028753
Cockerham, C. C., 1969 Variance of gene frequencies. Evolution 23: 72–84.https://doi.org/10.1111/j.1558-5646.1969.tb03496.x Cockerham, C. C., 1973 Analyses of gene frequencies. Genetics
74: 679–700.
Cockerham, C. C., and B. S. Weir, 1987 Correlations, descent measures: drift with migration and mutation. Proc. Natl. Acad. Sci. USA 84: 8512–8514.https://doi.org/10.1073/pnas. 84.23.8512
Collet, J. M., S. Fuentes, J. Hesketh, M. S. Hill, P. Innocentiet al., 2016 Rapid evolution of the intersexual genetic correlation for
fitness inDrosophila melanogaster. Evolution 70: 781–795.https:// doi.org/10.1111/evo.12892
Coop, G., D. Witonsky, A. Di Rienzo, and J. K. Pritchard, 2010 Using environmental correlations to identify loci under-lying local adaptation. Genetics 185: 1411–1423. https://doi. org/10.1534/genetics.110.114819
Cutler, D. J., and J. D. Jensen, 2010 To pool, or not to pool? Ge-netics 186: 41–43.https://doi.org/10.1534/genetics.110.121012 Dennenmoser, S., S. M. Rogers, and S. M. Vamosi, 2014 Genetic population structure in prickly sculpin (Cottus asper) reflects isolation-by-environment between two life-history ecotypes. Biol. J. Linn. Soc. Lond. 113: 943–957.https://doi.org/10.1111/ bij.12384
Dennenmoser, S., A. W. Nolte, S. M. Vamosi, and S. M. Rogers, 2015 Phylogeography of the prickly sculpin (Cottus asper) in north-western North America reveals parallel phenotypic evolu-tion across multiple coastal-inland colonizaevolu-tions. J. Biogeogr. 42: 1626–1638.https://doi.org/10.1111/jbi.12527
Dennenmoser, S., S. M. Vamosi, S. W. Nolte, and S. M. Rogers, 2017 Adaptive genomic divergence under high geneflow be-tween freshwater and brackish-water ecotypes of prickly sculpin (Cottus asper) revealed by Pool-Seq. Mol. Ecol. 26: 25–42. https://doi.org/10.1111/mec.13805
Dexter, E., S. M. Bollens, J. Cordell, H. Y. Soh, G. Rollwagen-Bollens et al., 2018 A genetic reconstruction of the invasion of the calanoid copepod Pseudodiaptomus inopinus across the North American Pacific Coast. Biol. Invasions 20: 1577–1595.https:// doi.org/10.1007/s10530-017-1649-0
Ellegren, H., 2014 Genome sequencing and population genomics in non-model organisms. Trends Ecol. Evol. 29: 51–63.https:// doi.org/10.1016/j.tree.2013.09.008
Excoffier, L., 2007 Analysis of population subdivision, pp. 980– 1020 inHandbook of Statistical Genetics, edited by D. J. Balding, M. Bishop, and C. Cannings. John Wiley & Sons, Chichester, United Kingdom.
Fariello, M. I., S. Boitard, S. Mercier, D. Robelin, T. Farautet al., 2017 Accounting for linkage disequilibrium in genome scans for selection without individual genotypes: the local score ap-proach. Mol. Ecol. 26: 3700–3714. https://doi.org/10.1111/ mec.14141
Fischer, M. C., C. Rellstab, M. Leuzinger, M. Roumet, F. Gugerli et al., 2017 Estimating genomic diversity and population dif-ferentiation–an empirical comparison of microsatellite and SNP variation inArabidopsis halleri. BMC Genomics 18: 69.https:// doi.org/10.1186/s12864-016-3459-7
Fleiss, J. L., 1971 Measuring nominal scale agreement among many raters. Psychol. Bull. 76: 378–382. https://doi.org/ 10.1037/h0031619
Fleiss, J. L., and J. Cuzick, 1979 The reliability of dichotomous judge-ments: unequal numbers of judges per subject. Appl. Psychol. Meas. 3: 537–542.https://doi.org/10.1177/014662167900300410 Fuentes-Pardo, A. P., and D. E. Ruzzente, 2017 Whole-genome
sequencing approaches for conservation biology: advantages, limitations and practical recommendations. Mol. Ecol. 26: 5369– 5406.https://doi.org/10.1111/mec.14264
Futschik, A., and C. Schlötterer, 2010 The next generation of mo-lecular markers from massively parallel sequencing of pooled DNA samples. Genetics 186: 207–218.https://doi.org/10.1534/ genetics.110.114397
Gautier, M., 2015 Genome-wide scan for adaptive divergence and association with population-specific covariates. Genetics 201: 1555–1579.https://doi.org/10.1534/genetics.115.181453 Gautier, M., K. Gharbi, T. Cezaerd, M. Galan, A. Loiseau et al.,
2013 Estimation of population allele frequencies from next-generation sequencing data: pool-versus individual-based genotyp-ing. Mol. Ecol. 22: 3766–3779.https://doi.org/10.1111/mec.12360 Glenn, T. C., 2011 Field guide to next-generation DNA se-quencers. Mol. Ecol. Resour. 11: 759–769. https://doi.org/10. 1111/j.1755-0998.2011.03024.x
Goudet, J., 1993 The genetics of geographically structured pop-ulations. Ph.D. Thesis, University of Wales, Bangor, Wales. Holsinger, K. S., and B. S. Weir, 2009 Genetics in geographically
structured populations: defining, estimating and interpreting FST. Nat. Rev. Genet. 10: 639–650. https://doi.org/10.1038/
nrg2611
Hudson, R. R., 2002 Generating samples under a Wright-Fisher neutral model of genetic variation. Bioinformatics 18: 337–338. https://doi.org/10.1093/bioinformatics/18.2.337
Karlsson, E. K., I. Baranowska, C. M. Wade, N. H. C. Salmon Hillbertz, M. C. Zodyet al., 2007 Efficient mapping of Men-delian traits in dogs through genome-wide association. Nat. Genet. 39: 1321–1328.https://doi.org/10.1038/ng.2007.10 Kofler, R., R. V. Pandey, and C. Schlötterer, 2011 PoPoolation2:
identifying differentiation between populations using sequenc-ing of pooled DNA samples (Pool-Seq). Bioinformatics 27: 3435–3436.https://doi.org/10.1093/bioinformatics/btr589 Landis, J. R., and G. G. Koch, 1977 A one-way components of
variance model for categorical data. Biometrics 33: 671–679. https://doi.org/10.2307/2529465
Leblois, R., M. Gautier, A. Rohfritsch, J. Foucaud, C. Burbanet al., 2018 Deciphering the demographic history of allochronic dif-ferentiation in the pine processionary mothThaumetopoea pity-ocampa. Mol. Ecol. 27: 264–278. https://doi.org/10.1111/ mec.14411
Lewontin, R. C., and J. Krakauer, 1973 Distribution of gene fre-quency as a test of the theory of the selective neutrality of poly-morphism. Genetics 74: 175–195.
Li, H., B. Handsaker, A. Wysoker, T. Fennell, J. Ruan et al., 2009 The sequence alignment/map format and SAMtools. Bioinformatics 25: 2078–2079. https://doi.org/10.1093/ bioinformatics/btp352
Lotterhos, K. E., and M. C. Whitlock, 2014 Evaluation of demo-graphic history and neutral parameterization on the perfor-mance ofFSToutlier tests. Mol. Ecol. 23: 2178–2192.https://
doi.org/10.1111/mec.12725
Lotterhos, K. E., and M. C. Whitlock, 2015 The relative power of genome scans to detect local adaptation depends on sampling
design and statistical method. Mol. Ecol. 24: 1031–1046.https:// doi.org/10.1111/mec.13100
Lynch, M., D. Bost, S. Wilson, T. Maruki, and S. Harrison, 2014 Population-genetic inference from pooled-sequencing data. Genome Biol. Evol. 6: 1210–1218.https://doi.org/10.1093/gbe/ evu085
Mak, T. K., 1988 Analysing intraclass correlation for dichotomous variables. J. R. Stat. Soc. Ser. C Appl. Stat. 37: 344–352. Malécot, G., 1948 Les Mathématiques de l’Hérédité. Masson, Paris. Nei, M., 1973 Analysis of gene diversity in subdivided popula-tions. Proc. Natl. Acad. Sci. USA 70: 3321–3323. https://doi. org/10.1073/pnas.70.12.3321
Nei, M., 1977 F-statistics and analysis of gene diversity in subdi-vided populations. Ann. Hum. Genet. 41: 225–233.https://doi. org/10.1111/j.1469-1809.1977.tb01918.x
Nei, M., 1978 Estimation of average heterozygosity and genetic distance from a small number of individuals. Genetics 89: 583– 590.
Nei, M., 1986 Definition and estimation offixation indices. Evo-lution 40: 643–645.https://doi.org/10.1111/j.1558-5646.1986. tb00516.x
Nei, M., and R. K. Chesser, 1983 Estimation offixation indices and gene diversities. Ann. Hum. Genet. 47: 253–259. https://doi. org/10.1111/j.1469-1809.1983.tb00993.x
Nychka, D., R. Furrer, J. Paige, and S. Sain, 2017 fields: tools for spatial data. R package version 9.6. University Corporation for Atmospheric Research, Boulder, CO. DOI: 10.5065/D6W957CT Orgogozo, V., A. E. Peluffo, and B. Morizot, 2016 The“mendelian gene”and the“molecular gene”: two relevant concepts of ge-netic units, pp. 1–26 in Genes and Evolution. Current Topics in Developmental Biology, Vol. 119, edited by V. Orgogozo. Aca-demic Press, New York.
Pickrell, J. K., and J. K. Pritchard, 2012 Inference of population splits and mixtures from genome-wide allele frequency data. PLoS Genet. 8: e1002967. https://doi.org/10.1371/journal. pgen.1002967
R Core Team, 2017 R: A Language and Environment for Statistical Computing. R Foundation for Statistical Computing, Vienna. Reynolds, J., B. S. Weir, and C. C. Cockerham, 1983 Estimation of
the coancestry coefficient: basis for a short-term genetic dis-tance. Genetics 105: 767–779.
Ridout, M. S., C. G. B. Demktrio, and D. Firth, 1999 Estimating intra-class correlation for binary data. Biometrics 55: 137–148. https://doi.org/10.1111/j.0006-341X.1999.00137.x
Robertson, A., 1962 Weighting in the estimation of variance com-ponents in the unbalanced single classification. Biometrics 18:
413–417.https://doi.org/10.2307/2527485
Rode, N. O., Y. Holtz, K. Loridon, S. Santoni, J. Ronfort et al., 2018 How to optimize the precision of allele and haplotype frequency estimates using pooled-sequencing data. Mol. Ecol. Re-sour. 18: 194–203.https://doi.org/10.1111/1755-0998.12723 Ross, M. G., C. Russ, M. Costello, A. Hollinger, N. J. Lennonet al.,
2013 Characterizing and measuring bias in sequence data. Ge-nome Biol. 14: R51.https://doi.org/10.1186/gb-2013-14-5-r51 Rousset, F., 1996 Equilibrium values of measures of population sub-division for stepwise mutation processes. Genetics 142: 1357–1362. Rousset, F., 1997 Genetic differentiation and estimation of gene
flow fromF-statistics under isolation by distance. Genetics 145: 1219–1228.
Rousset, F., 2007 Inferences from spatial population genetics, pp. 945–979 in Handbook of Statistical Genetics, edited by D. J. Balding, M. Bishop, and C. Cannings. John Wiley & Sons, Ltd., Chichester, England.
Schlötterer, C., R. Tobler, R. Kofler, and V. Nolte, 2014 Sequencing pools of individuals–mining genome-wide polymorphism data without big funding. Nat. Rev. Genet. 15: 749–763.https://doi. org/10.1038/nrg3803
Slatkin, M., 1993 Isolation by distance in equilibrium and non-equilibrium populations. Evolution 47: 264–279. https://doi. org/10.1111/j.1558-5646.1993.tb01215.x
Smadja, C. M., B. Canbäck, R. Vitalis, M. Gautier, J. Ferrariet al., 2012 Large-scale candidate gene scan reveals the role of che-moreceptor genes in host plant specialization and speciation in the pea aphid. Evolution 66: 2723–2738.https://doi.org/10.1111/ j.1558-5646.2012.01612.x
The International HapMap Consortium, 2005 A haplotype map of the human genome. Nature 437: 1299–1320.https://doi.org/ 10.1038/nature04226
Tukey, J. W., 1957 Variances of variance components: II. The un-balanced single classification. Ann. Math. Stat. 28: 43–56. https://doi.org/10.1214/aoms/1177707036
Vitalis, R., 2012 DetSel: an R-Package to detect marker loci re-sponding to selection, pp. 277–293 inData Production and Anal-ysis in Population Genomics: Methods and Protocols. Methods in Molecular Biology, Vol. 888, edited by F. Pompanon, and A. Bonin. Humana Press, New York.
Vitalis, R., P. Boursot, and K. Dawson, 2001 Interpretation of variation across marker loci as evidence of selection. Genetics 158: 1811–1823. Wahlund, S., 1928 Zusammens etzung von populationen und kor-relationserscheinungen vom standpunkt der vererbungslehre aus betrachtet. Hereditas 11: 65–106.https://doi.org/10.1111/ j.1601-5223.1928.tb02483.x
Weir, B. S., 1996 Genetic Data Analysis II. Sinauer Associates, Inc., Sunderland, MA.
Weir, B. S., 2012 EstimatingF-statistics: a historical view. Philos. Sci. 79: 637–643.https://doi.org/10.1086/667904
Weir, B. S., and C. C. Cockerham, 1984 EstimatingF-statistics for the analysis of population structure. Evolution 38: 1358–1370. https://doi.org/10.1111/j.1558-5646.1984.tb05657.x
Weir, B. S., and J. Goudet, 2017 A unified characterization of population structure and relatedness. Genetics 206: 2085– 2103.https://doi.org/10.1534/genetics.116.198424
Weir, B. S., and W. G. Hill, 2002 Estimating F-statistics. Annu. Rev. Genet. 36: 721–750. https://doi.org/10.1146/annurev. genet.36.050802.093940
Weir, B. S., L. R. Cardon, A. D. Anderson, D. M. Nielsen, and W. G. Hill, 2005 Measures of human population structure show het-erogeneity among genomic regions. Genome Res. 15: 1468– 1476.https://doi.org/10.1101/gr.4398405
Whitlock, M. C., and K. E. Lotterhos, 2015 Reliable detection of loci responsible for local adaptation: inference of a null model through trimming the distribution of FST. Am. Nat. 186: S24–
S36.https://doi.org/10.1086/682949
Wright, S., 1931 Evolution in Mendelian populations. Genetics 16: 97–159.
Wright, S., 1951 The genetical structure of populations. Ann. Eu-gen. 15: 323–354.https://doi.org/10.1111/j.1469-1809.1949. tb02451.x
Wu, S., C. M. Crespi, and W. K. Wong, 2012 Comparison of meth-ods for estimating the intraclass correlation coefficient for bi-nary responses in cancer prevention cluster randomized trials. Contemp. Clin. Trials 33: 869–880.https://doi.org/10.1016/j. cct.2012.05.004