Abstract
Ercan, Erkmen. Method for Measuring Static Potential on Moving Fabrics (under the direction of Dr. Perry L. Grady, Dr. Donald Shiffler and Dr. Behnam Pourdeyhimi)
There is no clear explanation for static potential generation. There are many factors that affect charge generation such as environment (temperature, humidity), structural (polymer type, structure of fabric) and working factors (fabric speed, tension, and contact area between fabric and machine parts, material type that is in contact with fabric). With a good knowledge of these parameters, generation of static charge can be minimized. During production, static potential on a moving web can cause web breakage, ignition of flammable atmosphere, or shock risk.
Among all parameters that cause static charge generation, tension is the most important one. A small amount of increase in tension can double the charge on belt. Separation is also a reason for charge generation and as roller-fabric friction increases –because of the increased contact area- more charge will be generated during separation. A new parameter, contact area, also needs to be considered.
Static charge generation may not be same at cross direction on a belt. As all areas are in the same situation (working and environment conditions) the only thing that was different was the tension. Because of the spunbond machine setup, tension –for this reason, static charge- was different in cross direction. The effect of this and other parameters can be seen more clearly when a non-conductive belt is used.
Method for Measuring Static
Potential on Moving Fabrics
by
Erkmen Ercan
A thesis submitted to the Graduate Faculty of
North Carolina State University
in partial fulfillment of the
requirements for the Degree of
Master of Science
Textile Technology and Management
Raleigh, North Carolina
2005
Approved By:
Dr. Behnam Pourdeyhimi
Chair of Advisory Committee
Biography
Acknowledgements
I would like to express my sincere gratitude to Dr. Perry Grady, Dr. Donald Shiffler and Dr. Behnam Pourdeyhimi for their support and guidance throughout this research. Appreciation is also extended to Dr. Sam Baker (Asten&Johnson Speciality Fabrics) and Mr. Michael Bodnar (Asten&Johnson Speciality Fabrics) for their thoughtfulness and encouragements during my research.
Financial support from Nonwovens Cooperative Research Center (NCRC) is greatly appreciated. Thanks to AATCC and TPACC (NCSU) for loaning the charge decay and surface resistivity test equipments. I would also like to thank the staff of NCRC laboratories and students at College of Textiles for their support and friendship.
TABLE OF CONTENTS
LIST OF TABLES ...vii
LIST OF FIGURES ...viii
1. INTRODUCTION...1
2. LITERATURE REVIEW ...3
2.1. Definition of Static Electricity ...3
2.2. Contact and Frictional Charging ...4
2.3. The Causes of Electrostatics ...5
2.3.1. Structure of Material ...5
2.3.2. Friction ...6
2.3.3. Separation ...6
2.3.4. Humidity and Moisture Content ...7
2.3.5. Temperature ...8
2.3.6. Repetition...9
2.4. Conductivity of Fibers ...9
2.5. Problems that Static Electricity Causes ...10
2.6. Measuring Electrostatics ...10
2.6.1. Electrostatic Fieldmeter ...11
2.6.1.1. Type of Fieldmeters ...12
2.6.2. Electrostatic Voltmeters...14
2.7. Charge Neutralization ...17
2.7.1. Types of Eliminators...17
2.7.1.2. Active Neutralizers ...18
2.7.1.3. Air Ionizers ...19
2.7.1.4. Radioactive Neutralizers ...20
2.8. Charge Decay...21
2.9. Surface Charge Density ...23
2.10. Charge on Both Sides...25
2.11. Effect of Nearby Objects ...28
2.12. Problems with the Measurements ...31
3. EXPERIMENTAL SETUP AND APPARATUS ...33
3.1. Materials ...33
3.1.1. Resistivity of Belts...34
3.1.2. Structural Variables ...34
3.2. Machine Used for Testing...35
3.3. Data Loggers ...36
3.4. Charge Decay Setup...37
3.5. Handheld Electrostatic Fieldmeter...40
3.5.1. Measurements with Handheld Fieldmeter ...41
3.6. One-probe Fieldmeter ...42
3.6.1. Measurements with One-probe Fieldmeter...44
3.7. Multi-Probe Fieldmeter...45
4. RESULTS AND DISCUSSION ...48
4.1. Charge Decay Tests ...48
4.2. Tests with Handheld Fieldmeter ...52
4.3. Tests with One-probe Fieldmeter...55
4.4. Tests with Multi-probe Fieldmeter ...61
4.5. Effect of Speed...61
4.6. Effect of Tension...65
4.7. Comparison of Belts ...68
4.8. Tension at Cross Direction...70
4.9. Effect of Relative Humidity...75
4.10. Effect of Friction Bar ...79
4.11. Effect of Spraying Water ...80
4.12. Surface Resistivity ...80
5. RECOMMENDED TEST PROCEDURE...82
CONCLUSIONS ...86
LIST OF TABLES
Page
Table 1: Triboelectric series...4
Table 2: Fieldmeter vs. Voltmeter ...15
Table 3: Belt properties ...38
Table 4: Decay times at (+) charge...48
Table 5: Decay times at negative charge...50
Table 6: Electrostatic field measurements with handheld instrument...53
Table 7: Charge generation on a conductive belt ...56
Table 8: Charge generation on a non-conductive belt ...56
Table 9: Charge generation on a spiral type of belt...57
Table 10: Point tension values at different tensions...70
Table 11: Effect of friction...80
Table 12: Effect of spraying water...80
LIST OF FIGURES
Page
Figure1: Simplified drawing of an atom...3
Figure 2: Charge separations during friction and contact ...4
Figure 3: The band structure of (a) a metal and (b) an insulator ...5
Figure 4: Asymmetric friction...6
Figure 5: Separation...6
Figure 6: Variation with moisture content of dielectric properties of various fibers ...7
Figure 7: Conductivity levels of some materials ...9
Figure 8: Target size...11
Figure 9: A rotating-vane fieldmeter...13
Figure 10: Error rate vs. probe-to-surface distance ...14
Figure 11: Simco handheld instrument...15
Figure 12: Probe of fieldmeter model SE0054 ...16
Figure 13: A multi-probe type fieldmeter ...16
Figure 14: Passive neutralizer...17
Figure 15: AC and DC type active neutralizer...18
Figure 16: Air Ionizer...20
Figure 17: Radioactive neutralizer...21
Figure 18: Decay of field from charge ...22
Figure 19: Charge Decay Instrument, ETS, Model 406D ...22
Figure 21: Comparison of static field distributions
A) –k=0 (steady position) B) Moving position...24
Figure 22: Surface potential distributions obtained under the same conditions. A) k=0 and B) k=0.75 ...25
Figure 23: Example of a machine design ...25
Figure 24: A design to measure charge on both sides of a web ...26
Figure 25: Distance (L) vs. charge on web ...28
Figure 26: Web surface potential between two rollers...30
Figure 27: Effect of near by object ...30
Figure 28: Uniform vs. non-uniform field ...31
Figure 29: Pictures of some fabrics that were tested; a) Webmaster G1340D, b) Webmaster F325 and c) SpiralTuf ...34
Figure 30: Detailed picture of SpiralTuf type fabric...35
Figure 31: The areas that electrostatic was measured...36
Figure 32: The charge decay test instrument –ETS Model 406D- ...38
Figure 33: Taurus and webmaster F325 types of fabrics...39
Figure 34: Handheld fieldmeter –Simco Model FMX-002- ...40
Figure 35: Spunbond machine...42
Figure 36: The areas that measured by using handheld fieldmeter ...42
Figure 37: The probe that was used, Monroe Electronics, model 1036F ...42
Figure 38: Measurements with one probe fieldmeter with (A) and without (B) conductive aluminum layer ...43
Figure 39: The areas that were tested with one-probe instrument on spunbond machine....44
Figure 42: Some pictures taken during a test...46
Figure 43: How does system work?...47
Figure 44: Belt decay times ...49
Figure 45: Charge decay times for negative charged belts...50
Figure 46 and 47: Charge decay times for SpiralTuf™ SW-70 type of fabric...51
Figure 48: The spunbond machine that was used for testing ...52
Figure 49: Charge on the front side ...54
Figure 50: Charge on the back side ...54
Figure 51: Measured areas on spunbond machine ...55
Figure 52, 53: Effect of speed...58
Figures 54, 55 and 56: Comparison between Guardian™ (woven 100% PET), SpiralTuf™ and a conductive belt ...60
Figure 57: Measurement of right, left and middle areas...61
Figure 58 and 59: Results of conductive belts...62
Figure 60 and 61: Results of conducive belt type WebMaster™F325, front and back side...63
Figure 62 and 63: Effect of belt structure ...64
Figure 64 and 65: Comparison of used and new belts ...66
Figures 66 and 67: Effect of contact area ...67
Figure 68 and 69: Effect of belt structure ...68
Figure 70 and 71: Comparison of Belts ...69
Figures 72 - 75: Tension values of belt at cross direction ...71-72 Figure 76: Comparison of Belts ...73
Figure 78 and 79: Charge generation for a conductive belt at low and high humidity ...75
Figure 80 and 81: Effect of humidity on a non-conductive belt (Guardian™) ...76
Figure 82 and 83: Effect of humidity on SpiralTuf™SW-70 type belt ...78
Figure 84: Comparison of belts –High and low humidity ...78
Figure 85: Surface resistivity instrument ...81
Figure 86: Grounding metal layers and mounting ...82
Figure 87: Connecting probes and data cables...83
Figure 88: Connecting cables to data logger ...84
Figure 89: Fieldmeter software ...84
Figure 90: Data logger software ...85
1. Introduction
During production, static electricity can cause overload of electrical equipment, explosion in an operating room and there is always shock risk. In textile industry, especially for nonwovens, it can increase the production time. Static electricity can cause the product stick to machine or other parts, and make it unable to move easily. This can cause break apart of textile products and this will be a reason of higher process time. Also, during production, static electricity on the material can cause breakage of fibers. This will decrease the fabric strength.
During the recent years, different types of belts are being produced for spunbond and meltblown processes. The goals of producing these belts are decreasing static charge generation during production and helping dissipation of charge. To reach these aims, many different belts with different structures are being produced. But, as researchers are dealing with dissipation of electrostatics, the main material that is being used in belt structure is carbon suffused polyamide (Nylon 6.6). The difference in belt structure, warp and web densities, the percentages and types of monofilaments that form belt determine the amount of charge generated. The behavior of belts can be affected by speed, tension, humidity and temperature.
The instruments that are used for measuring static potential and neutralizing were discussed and a new multi-probe fieldmeter was purchased. This type of fieldmeter is one of the sensitive one and 4 probes can be connected to it. This helps to see the effect of cylinder, separation, grounded metal layer that is in contact with cylinders and charge generation and dissipation during transportation. Tests were done by handheld, one and multi-probe types of fieldmeters.
2. Literature Review
2.1. Definition of Static Electricity
For many years it was known that if a piece of amber was rubbed it acquired the ability to attract small bits of straw, paper and such.
According to electron theory, materials are composed of three types of particles. These are the electrons which carry negative electrical charges, protons which carry a positive electrical charge and neutrons which do not carry electrical charge [1].
Figure1 Simplified drawing of an atom
All atoms are very similar in construction which means there is always a core and one or more electrons. Figure 1 a simplified drawing of an atom is shown.
When the atoms have a number of electrons, some are closer to the core than others. The core exerts a pulling force on the electron. As the distance between electron and core increases, this force decreases. This force is also called ‘force of attraction’. The attracting force which the nucleus sends out is said to be a positive (+) charge. The neutralizing force, which the electron supplies, is said to be a negative (-) charge. These terms are used to indicate the two types of charges [2].
core electron
orbit
core electron
Negative end Teflon PVC Polyethylene Polystyrene Polyester Dacron Acetate rayon Rubber Wood Steel Paper Cotton Silk Wool Nylon Human hair Rabbit fur Positive end Negative end Teflon PVC Polyethylene Polystyrene Polyester Dacron Acetate rayon Rubber Wood Negative end Teflon PVC Polyethylene Polystyrene Polyester Dacron Acetate rayon Rubber Wood Steel Paper Cotton Silk Wool Nylon Human hair Rabbit fur Positive end Steel Paper Cotton Silk Wool Nylon Human hair Rabbit fur Positive end
2.2. Contact and Frictional Charging
When two insulating materials are rubbed together, the surfaces will have a net electric charge. One will become negative and other positive. For some materials even touching has same effect [3].
In figure 2, two solid materials are shown. They are brought in contact and rubbed against each other and electrons move across the interface [4]. To determine the polarity of each material that is in contact, the triboelectric series is useful. According to the triboelectric series, every material charges positive against materials below it in the table when the two be rubbed. There are several lists of triboelectric series which are quite
different than each other [3].
Triboelectrification, frictional charging, is one of the oldest known forms of charging. In some cases it is not even clear how to explain the sign of a charge on a particular surface for a given pair of surfaces.
A
B
+
+
+
+
+
_
_
_
_
_
A
B
+
+
+
+
+
_
_
_
_
_
Figure 2 Charge separations during friction and contact
C
C
C
D
D
D
+ + + +
+
+
+ +
_ _ _ _
_ _ _ _
C
C
C
D
D
D
+ + + +
+
+
+ +
_ _ _ _
_ _ _ _
series to predict the sharing of polarity. But the magnitude of charges separated by
contact and friction can only be predicted with a high degree of uncertainty [4,5].
2.3. The Causes of Electrostatics
2.3.1 Structure of material: All atoms in materials have a certain number of electrons. They are placed in orbits around the atom and every orbit has a fixed number of electrons. As the distance between electron and core increases, the energy of an electron decreases. Electrons stay in orbits which are energy bands. The outer electrons of the atoms have a greater influence on each other than inner ones as they can move to other atoms orbits.
If the outer energy band is partially empty that means the material is a conductor. If the band is full, the material is insulator. There are two electrons for every possible energy band which can exist in the band. This is the number allowed by quantum mechanical rules. For this reason no electrons can increase an insulator’s energy. Figure 3 shows energy bands of a conductor and an insulator. The electrons that on the outer layer are called valance electrons and they create a band called valance band. A conduction band is formed by energy levels which correspond to excited states of the outer electrons [3].
Conduction band
valance band
Lower electron level
Conduction band
Forbidden energy band
Valance band
a
b
Conduction band
valance band
Lower electron level
Conduction band
Forbidden energy band
Valance band Conduction band
valance band
Lower electron level Conduction band
valance band
Lower electron level
Conduction band
Forbidden energy band
Valance band
2.3.2 Friction (Asymmetric and Symmetric)
The charge on a surface increases as the contact area between surfaces increase. The degree of friction between two materials influences the contact area, thus exchange of charge. Triboelectric series and material type affect charge exchange. What if there are identical materials in the system (like in most textile products)?
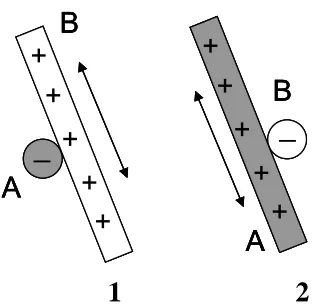
The fabrics that are tested are woven belts for spunbond and meltblown machines. Because of its structure, there are asymmetric frictions through the web between yarns. This is illustrated in figure 4.
Two pieces, A and B, are identical materials and rubbed against each other. In (1), A is stationary and in (2), B is stationary. It can be clearly seen that B is positive charged in (a), and negative charged in (b).
The degree of polarity (charge that is generated) is affected by speed and type of fabric. As speed increases there will be more charge. When material type changes the amount of friction may change, which has a direct effect on charge generation.
2.3.3. Separation:
The faster the separation of the materials, the higher the charge generated. Slow speed provides enough time
A
A
B
B
a
b
_
+
+
+
+
+
_
+
+
+
+
+
A
A
B
B
a
b
A
A
B
B
a
b
_
+
+
+
+
+
_
+
+
+
+
+
Figure 4: Asymmetric friction [4]
for electron transfer between materials. As shown in the figure, the charge on belt moves to the roller. If there is not enough time for charge movement after separation, charge on belt will tend to move to the roller. This will increase charge generation. It also depends on the charge content on the two materials. If the roller is grounded, generation of charge will be high with high speeds.
2.3.4. Humidity and moisture content: The dryer the environment, the higher the level of static charge generated. This is a general rule that is known in the textile industry. If relative humidity is high, a moisture film will be absorbed on the surface of solid materials. So, surface resistivity of materials decreases and charges can move. This effect occurs if relative humidity is higher than 30-35%, and it exceeds its maximum if the relative humidity is 65-70% [8].
Formation of the moisture film depends on whether the material in hydrophobic or hydrophilic. With hydrophilic surfaces there will be less static charge problems.
Effective relative electrical permittivity – permittivity is capacitance of a condenser with the material between parallel plates, relative permittivity is ‘permittivity/permittivity of a vacuum- of nylon, acetate and wool fibers are
1 2 3 4
0
4 8 12
Moisture content %
ε
mNylon
Acetate
Wool
1 2 3 4
0
4 8 12
Moisture content %
ε
mNylon
Acetate
Wool
shown is figure 6. As moisture content increases the permittivity increases. Non-absorbing fibers show no variation in dielectric constant [7].
As there are no free electrons in the fibers, a large thermal activation, kT, is required to promote electrons from the top of the valance band to the bottom of the conduction band. For metals and semiconductors kT at room temperature is sufficient to move the electrons from valance band to conduction band [10].
Electrical conductivity, σ, is:
σ=nϕµ
n = number of charge carriers per unit volume,
φ= charge per carrier, and µ = mobility of the carrier
Conductivity is the reciprocal of resistivity, ρ:
σ=1 /ρ
Resistivity is a geometry independent material property.
ρ= R A L( / ) A: Area L: Length [10]
2.3.5. Temperature: If material is cooler than the surrounding air, moisture will condense on it and its insulation resistance will deteriorate. If it is warmer, it will tend to dry out and its resistance will become high, even if the relative humidity of the surroundings is high.
2.3.6. Repetition: Repeated actions increase the static charge generation.
2.4. Conductivity of Fibers
Textile fibers are electrical insulators. As explained above, all electrons are bound to the nucleus core or shared in the covalent bonds. No electrons are free to move.
Electrical conductivity of materials is a property which spans a very wide range. It may occur through the movement of either electrons or ions.
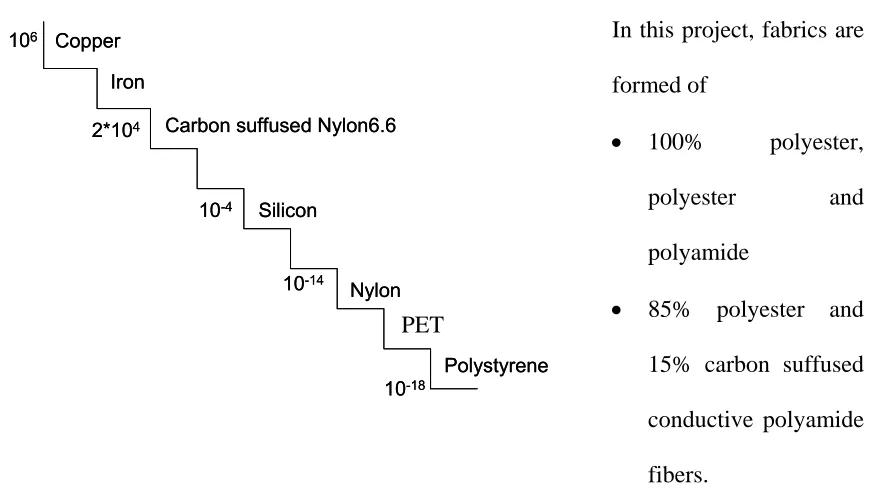
Conductivity values show how good can a material conducts charge. Figure below shows some textile materials’ conductivity values [9].
In this project, fabrics are formed of
• 100% polyester,
polyester and polyamide
• 85% polyester and
15% carbon suffused conductive polyamide fibers.
The conductivity values of these fibers are shown in table 3. Conductive polyamide is made of carbon suffused Nylon 6.6.
Figure 7 Conductivity levels of some materials (Ω-1cm-1)
106 Copper
2*104 Carbon suffused Nylon6.6
Iron
10-4 Silicon
10-14
Nylon
PES
Polystyrene 10-18
106 Copper
2*104 Carbon suffused Nylon6.6
Iron
10-4 Silicon
10-14
Nylon
PES
Polystyrene 10-18
To produce this fiber nylon fibers are sent to an acid bath and a single layer is removed from the surface. Then, carbon molecules are applied to the polyamide fiber by spraying or a bath. To avoid loosing carbon molecules during production because of friction, fibers are then covered with a very thin layer of silicon.
2.5. Problems That Static Electricity Causes
In the textile industry, static electricity may cause many problems if it is not under control. These problems may be:
• Electronic equipment can be overloaded and break down • Static discharge in an operating room may lead to an explosion • Risk of shock.
• Increased production time: In some areas very long textile materials are produced.
Because of the static charge on it, roll should be used for some time to allow static charge dissipation.
• Fiber breakage and decreased fabric strength: Spunbond machine during
production, before transferring the web to calender bonding, the fabric sticks to the belt. This may cause fabric breaks during production and higher process time.
2.6. Measuring Electrostatics
• Electrostatic Fieldmeter
o Pocket size electrostatic fieldmeter o Radioactive sensor type fieldmeter o A.C carrier type fieldmeter
Chopping electric field by rotor
Vibrating capacitor fieldmeter • Electrostatic Voltmeter
2.6.1. Electrostatic Fieldmeter
The ideal electrostatic fieldmeter should have following characteristics: - It would be very small
- It would determine the polarity as well as the magnitude of charge
- It would assume the potential in space of the point where field intensity measurements are desired [11]
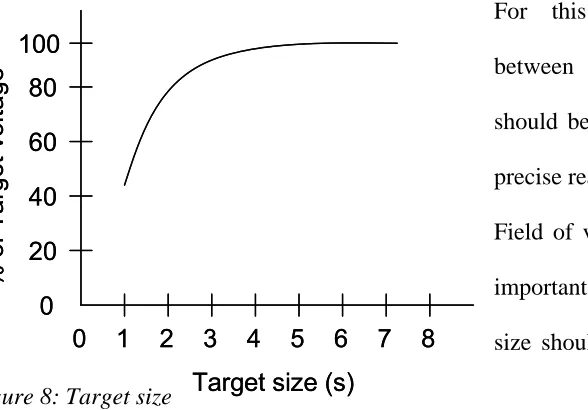
In general, a fieldmeter should measure the field without distorting that field in any way. Fieldmeters that are used today are ground referenced measuring devices. The readings are affected by the distance between sensing surface and the layer containing the charge.
For this reason, the distance between fieldmeter and layer should be known in order to have precise readings.
Field of view of the probe is also important. For accuracy, the target size should be three to four times
0 1 2 3 4 5 6 7 8
0 20 40 60 80 100
Target size (s)
% of T a rg et vo lta ge
0 1 2 3 4 5 6 7 8
0 20 40 60 80 100
Target size (s)
the distance from the probe to the surface under the test. Unless measuring large surfaces are being measured, the probe should be very close to the web. As spacing gets smaller, the variations in spacing become much more critical to the accuracy of readings.
2.6.1.1. Type of fieldmeters
1) Pocket size electrostatic fieldmeter has a capacitively coupled D.C amplifier. Advantages of this type of fieldmeter are:
● Low cost
● Very easy to use
● Simple
● Ability to make extremely high speed measurements [11]
Disadvantages are:
● Inability to monitor an area over an extended period of time
● Need to periodically zero the instrument
● Inability to use these in an ionized environment [11]
2) Radioactive sensor type fieldmeter is a simple D.C. coupled measuring unit. It ionizes air and when this is exposed to an electric field, a current will flow which is same amount as electric field. The current is then measured and gives data about the electric field. Results can be affected by dirt on the radioactive element. Also, radioactive elements have a limited half-life and need to be changed periodically.
3) The most widely used instrument for measuring electric fields is the rotating-vane field meter. This is an induction field meter with a grounded rotor placed in front of the sensing surface as shown in figure 9.
As the rotor turns, it chops the electric field and the sensing surface is alternately exposed to the field and shielded from it. The speed of response is limited by the copping speed of the rotor. The sensitivity of the instrument is changed by altering the value of the internal capacitance. By combining the data from sensitive detector and sensing surface, system gives the data about static potential under it [3].
A small electric motor is used to drive the vanes. Because of the grounding brushes, the instrument is noisy. Also, it limits the speed of the rotor. Because of the friction, these brushes must be changed after some time.
4) Vibrating capacitor fieldmeter, like a rotating-vane fieldmeter, is also provides an oscillatory signal. In this instrument, the aperture is placed in from of the sensing surface. The sensing surface is vibrated perpendicularly to the electric field. The signal detected at the plate is then proportional to the displacement between the sensor surface and the aperture, and to the electric field.
Vibrating fieldmeters are more compact than rotating vane instruments [11].
Figure 9: A rotating-vane fieldmeter [13]
Grounded chopper
2.6.2. Electrostatic Voltmeter
There are two types of electrostatic voltmeters available today. These are vibrating capacitor type and tuning fork chopper type voltmeters. In the second system, there are two sets of vanes, one set is fixed, and other one is mounted on a spring and attached to a pointer. When the voltage is applied, one vane is repelled from the stationary one by a force which is proportional to the square of the potential. The pointer moves across the
dial and stops when the electrostatic force equals the restoring torque of the spring [3]. The advantage of an electrostatic voltmeter compared to fieldmeter is high resolution providing accurate reading within short periods. It gives excellent results
with small probe-to-surface distance. Figure 10 shows that voltmeters can indeed be used over a wide range of spacing with good results [11].
0,1 mm 1,0 mm 10,0 mm
0,001 mm 0,002 mm 0,005 mm 0,01 mm 0,02 mm 0,05 mm 0,010 mm % E rr o r Probe-to-surface spacing
0,1 mm 1,0 mm 10,0 mm
0,001 mm 0,002 mm 0,005 mm 0,01 mm 0,02 mm 0,05 mm 0,010 mm % E rr o r Probe-to-surface spacing
0,1 mm 1,0 mm 10,0 mm
0,001 mm 0,002 mm 0,005 mm 0,01 mm 0,02 mm 0,05 mm 0,010 mm
0,1 mm 1,0 mm 10,0 mm
0,001 mm 0,002 mm 0,005 mm 0,01 mm 0,02 mm 0,05 mm 0,010 mm % E rr o r Probe-to-surface spacing
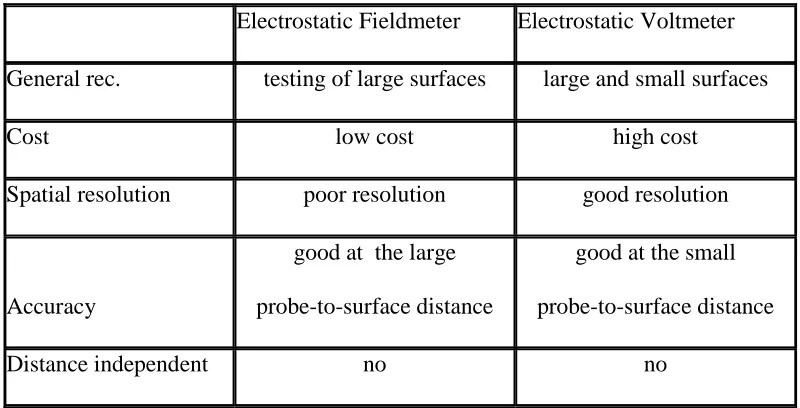
Table 2. Fieldmeter vs. Voltmeter
Electrostatic Fieldmeter Electrostatic Voltmeter
General rec. testing of large surfaces large and small surfaces
Cost low cost high cost
Spatial resolution poor resolution good resolution
Accuracy
good at the large
probe-to-surface distance
good at the small
probe-to-surface distance
Distance independent no no
Electrostatic field measuring devices that were used in this project
In this project, three different types of fieldmeters were used. Fieldmeters were selected for measuring static potential rather than voltmeters because the resolution and accuracy are good enough for our tests. The instruments used and their specifications are:
1) Simco Handheld Fieldmeter (FMX-002)
•Easy to use, small size •Range: +/- 20 KV
•Ability to make extremely high speed
measurements
• Distance between web and instrument effects the result. As it is a handheld
instrument, it is hard to keep the instrument at the same point during tests. • Need to periodically zero
• Inability to monitor [14]
2) Monroe Electronics One Probe Fieldmeter (Model SE0054) • Range: +/- 10 KV
• Distance can be kept constant • Accuracy: Better than 2% • Response: Less than 0.5 sec.
• Ability to connect to a computer [15]
3) Monroe Electronics Multi-probe Fieldmeter (Model 177)
• 4 point static meter: It is possible to use 4 fieldmeter probes at the same time.
Static electricity on a web may change with time. To see the effect of some parameters on different areas, measurements should be done at the same time. For this reason, a multi-probe fieldmeter should be used.
• Accuracy: Better than 1% • Response: 250 msec. • Range: +/- 20 KV [16] Figure 12. Probe of fieldmeter model SE0054
2.7. Charge Neutralization
The management of electrical charge is critical to the success of electronic component manufacturing. Mostly, insulating materials create problems during production. High static charge on those materials may create electrical forces and discharges. Materials may stick together; electronic devices and circuits may be damaged. Electrostatic charges can be neutralized by eliminators, which neutralize surface charges on solid materials [8, 17].
2.7.1. Types of eliminators
There are different types of methods to neutralize the charge on materials. Eliminators can be subdivided into 4 groups:
1) passive eliminators 2) active eliminators 3) air ionizers
4) radioactive eliminators 2.7.1.1. Passive eliminators
This is the simplest type of eliminator. They operate by using the charge on the surface. The intensity of the neutralizing ion current depends on the value of the static charge. If
there is no static charge there is no discharge. In figure 14, working principle of passive neutralizers is shown.
In the situation shown, negative ions will move to the emitter and become neutralized. Also, positive ions will move to the charged +
+
+ + + +
_ _
_ _ _ _ _ _
Grounded emitter
+ + + + +
+ ++ ++ ++ __
__
_ _ _ _ _ _
material and neutralize it. The system should be positioned a few centimeters from the material. For points which are 10 mm from a surface, this will be equivalent to a potential f about 5kV on the surface. This type works well with highly charged material. If charge becomes very low, neutralization stops. To neutralize all the charge on a web a passive neutralizer should be used.
These instruments work equally well with positive and negative charges. The problem is corona discharge stops at a certain charge level –charge remains on the surface-, so there is an amount of charge on surface. Other disadvantage of this approach is their tendency to overcompensate. This may be reduced by using second neutralizer [3, 18, 19].
Passive neutralizer may be made of carbon brushes which are in contact with the material. This direct contact does not increase the efficiency of the neutralization [18].
2.7.1.2. Active Neutralizers
These units are similar to passive ones but they are more complex. They can be completely effective with low or highly charged materials. They can be easily controlled
~
_
_
_
_
+
+
+
+
+
+
_
_
_
_
_
_
_
_
AC source_
_
_
_
_
+
+
+
+
+
+
+
+
+
+
+
_
_
_
_
_
_
_
_
_
Negative ionizer Positive ionizer+
~
_
_
_
_
_
_
_
_
+
+
+
+
+
+
+
+
+
+
+
+
_
_
_
_
_
_
_
_
_
AC source_
_
_
_
_
_
_
_
_
_
+
+
+
+
+
+
+
+
+
+
+
+
+
+
+
+
+
+
+
+
+
+
_
_
_
_
_
_
_
_
_
_
Negative ionizer Positive ionizerand their efficiency is higher than any of the other types [8].
These types are mostly used in the cases where passive ones do not provide sufficient neutralization during production.
Figure 15 shows AC and DC type active neutralizers. Like passive ionizers they consist of a row of points placed parallel with the charged material, but in this case the points are connected to a voltage source.
An A.C. type neutralizer produces positive and negative ions in a fraction of each half period which is determined by the voltage and the radius of the points. The frequency of the voltage must be increased at high speeds. The disadvantage of this A.C type of neutralizers is that when charged material is moving past the neutralizer, the neutralization may be incomplete.
D.C. type neutralizers are the most effective ones. They consist of two emitters –one has positive and other one has negative polarity-. They can be used where the A.C. type is insufficient. Negative output can be used when the charged material is positive, and positive output can be used when charged material is negative. To avoid overcompensation of the neutralization; a double D.C. ionizer can be used. An advantage of active neutralizers is this unit can operate as a passive neutralizer if the high voltage power supply should fail [18, 19].
2.7.1.3. Air Ionizers
air ionizers should have equal positive and negative polarities. Ionizer can be electrical (usually D.C- single or double) or radioactive.
By blowing air, it is possible to create an air stream with relatively high ion content. But because of the small distance between emitters and the grounded layer between them, the fraction of the air form will never reach the air outside the ionizer. So, the ion concentration is reduced because of repulsion, diffusion and combination process.
With the help of blowing air, this system is good for hard-to-reach surfaces. But it is very difficult to maintain high ion concentration over long periods. Also, it is hard neutralize materials at long distances.
2.7.1.4. Radioactive Neutralizers
These types are simple. Their shape and dimensions can be changed easily. They don’t require an external energy source. But because of the half life of the radioactive element, they have to be renewed systematically. The application of radioactive eliminators is advantageous in an inflammable atmosphere and places where static charging is not too
+
+ +
+
+
+
+
+
+
+
_
_ _ _ _ _ _
_ _
_
_
_
+
+
_
+
+
+
+ ++
+
+
+
+
+
+
+
+
+
+
+
+
+
+
__
__ __ __ __ __ __
__ __
__
__
__
+
+
+
low. In a radioactive neutralizer, the radioactive source is placed upon a base material and covered with an extremely thin protective layer –this can be gold-.
Radioactive neutralizers can be used for low charged or slow speed material. The advantage of this type is that they don’t require electrical installations, and they function without electrical discharges. The limitations are it can not be used for highly charged or high speed webs. Also because of the radioactive material, care has to be taken [8, 19, 20].
2.8. Charge Decay
Textile materials easily become electrostatically charged when rubbed against other materials. This kind of charge triboelectric charge is called and causes many problems in the industry. So, the ability of materials to dissipate static charges on themselves is important for avoiding a variety of problems.
The meaning of the term ‘resistivity’ in electrostatics is the difficulty of passing charge through the material. If the charge decay properties of materials are needed, information
+ _ _
+
+ + + + + + +
Charged material
Radioactive material
+ +
__ __
+ +
+ + + + + + +
Charged material
Radioactive material
from the resistivity properties of materials can be used to assume these behaviors [21, 24].
Basically, to remove the charge on a web, a low surface resistivity is required. But there are some unclear situations with the measuring of surface resistivity. First of all, the tests should be made under very ideal conditions; because:
- The resistivity depends on the field strength from the decaying charge
- The driving field from a given charge depends on the permittivity properties of environment [22]
The method that is used to measure resistivity is Federal Test Method 4046.1. The sample is clamped between the two electrodes as shown in figure 18. Charge is applied on the fabric and the dissipation time is measured.
In our tests the Electro-tech Systems static charge meter was used.
The reason for running charge decay tests in this project is to have an idea about charge decay rates of different fabrics during production. On the machine there are some grounded and ungrounded parts that the fabric contacts. During production fabric generates charge. When a grounded part of the machine (roller and/or layer) contacts the charged web, static charge on the fabric will move to it.
Sample Voltage Supply
Fieldmeter Sample Voltage Supply
Sample Voltage Supply
The amount of charge that moves to the grounded part depends on the charge decay properties of material. If it is highly resistive, that means high charge decay rate and the amount of charge that moves to machine part will be low. So, one of the aims of this project was to determine the relationship between charge decay rate and fabric behavior during production. If this kind of relationship can be proved, there is no need to run an experiment on a nonwoven production machine to see charge decay rates.
2.9. Surface Charge Density
Charge measurement by a fieldmeter can be effected by local low potential regions. This depends on the web linear velocity, on the resistivity of the web material and the whole electrostatic system.
These local changes create problems when controlling the static electrification process on moving webs. To find an approach, one assumes that the surface charge density is uniform and constant with time. But in practice, there is a difference between the web areas that are in contact with the grounded machine parts (roller, etc.) and true web
potential [25].
An ideal measuring system can be seen in figure 20. The fieldmeter is mounted a distance from the web. ‘v’ is the velocity of the web, ‘a’ is
Fieldmeter (earthed)
Moving web
v +∞
-
∞
ad
qs Fieldmeter (earthed)
Moving web
v +∞
-
∞
ad qs
Figure 20: Schematic diagram of the measuring system
the air gap thickness and qs is the charge density.
Velocity, charge and electrical properties are related by [25]: (1)
Where: k: σ/εo
Eo: qs/εo
εo and σ are the permittivity of a free space and the web surface conductivity, V is the
velocity and qs is the charge density.
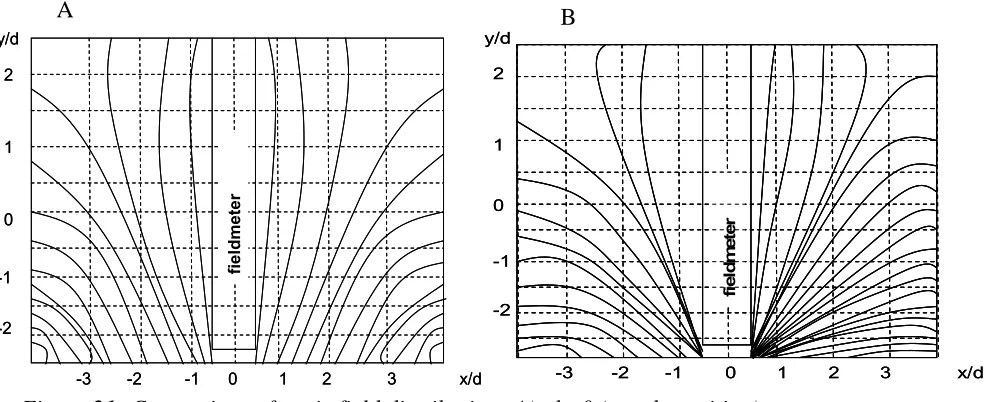
As can be seen in figure 22, if the web is not conductive the areas before and after the fieldmeter will be similar in terms of static density. But for conductive fabrics, any grounded material near the web will affect the static density distribution through the web. We can hardly talk about a constant charge value on the belt.
∂ ∂
∂ ∂
V y v k
V x Eo − = -2 -1 1 y/d
-3 -2 0 1 x/d
0 2 fi e ld meter
-1 2 3
-2 -1 1 y/d
-3 -2 0 1 x/d
0 2 fi e ld meter
-1 2 3
fi el d m et e r -2 -1 1 y/d 0 2
-3 -2 -1 0 1 2 3 x/d
fi el d m et e r fi el d m et e r -2 -1 1 y/d 0 2
-3 -2 -1 0 1 2 3 x/d
Figure 21: Comparison of static field distributions A) –k=0 (steady position) B) Moving position
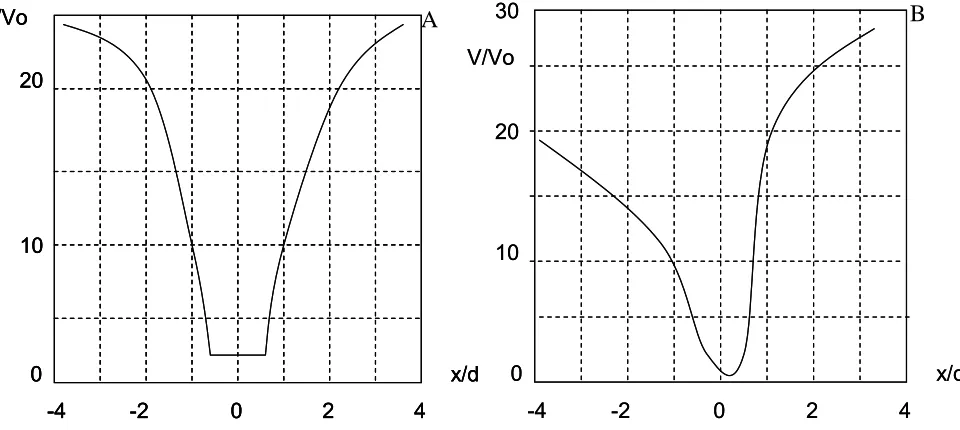
Figure 23 gives an example of a machine design to measure the static potential to see the effect of grounded near by objects (8). Linear velocity of belt (1) can be changed by a
Figure 22: Surface potential distributions obtained under the same conditions. The difference is only ‘k’ value. A) k=0 and B) k=0.75 [25]
1
2
3
4
4
4
4
5
6
7
8
8
1
2
3
4
4
4
4
5
6
7
8
8
Figure 23: Example of a machine design [25]
A B
0 10 20 V/Vo
-4 -2 0 2 4
x/d 0
10 20 V/Vo
-4 -2 0 2 4
x/d 0
10 20 V/Vo
-4 -2 0 2 4
x/d 0 10 20 V/Vo
-4 -2 0 2 4
x/d 30 0 10 20 V/Vo
-4 -2 0 2 4
motor (5). Charge on belt is generated by friction between rollers (4) and high voltage supply (7). Fieldmeter (2) gets the data and recorder (3) keeps records with time.
2.10. Charge on Both Sides
Materials that are close to a moving web, affect the charge on it. Also, for thick webs, the charge on both sides will be different. By the help of a near by object, these charges can be identified with only one fieldmeter.
During transport of an insulating web, friction between rollers generates charge also this charge dissipates by time. So, this will cause the charge differences between the two sides of the web. In figure 24 a set-up to measure the static potential on both sides is shown. The fieldmeter is located a distance‘d’ above the web and the web is located a distance ‘L’ above a uniformly charged object [26].
If:
d = Distance between the fieldmeter and the upper surface
Fieldmeter
Web
Object
d
t
L
Sensor
ε
aε
aε
wε
uσ
aσ
bσ
u ,V
uFieldmeter
Web
Object
d
t
L
Sensor
ε
aε
aε
wε
uσ
aσ
bσ
u ,V
uk1 = Constant containing charge density of both surfaces k2 = Constant containing charge density of upper surface Em = The magnitude of the electric field at the fieldmeter Em1 = Fieldmeter reading when L is at Lo+∆
Em2 = Fieldmeter reading when L is Lo Em3 = Fieldmeter reading when L is Lo-∆
L = Distance between the lower web surface and the lower ground plate Lo = Equilibrium distance of L
Vu = Potential at the plate or object below the web (set to zero in this pare)
∆ = Maximum distance moved by lower ground plate from L
εa = Permittivity of gas surrounding the web
εu = Permittivity of object under web
εw = Permittivity of the web
σa = Surface charge density on the upper web surface
σb = Surface charge density on the lower web surface
σu = Surface charge density on the object under the web
σa = εwk2 (2)
σb = εak1 – σa (3)
k
Lo d t
E E E E
k
Lo d t
t E
Lo t k
a
w
m m
m m
a
w m
1 1 3
1 3
2 2 1
2 2
=
+ +
− + +
=
+ +
−
ε ε ε ε
∆ ( )
(4)
Equations (3) and (4) allow us to compute web surface charges on the top surface and on the bottom surface with the help of k1 and k2.
By changing the position of the grounded layer a fieldmeter measures different values. In figure 25, the distance between the grounded plane and web is changed from 0 to 100 mm. As ‘L’ becomes infinite, the fieldmeter reading will be constant. If it is far away from the web, e.g. 100 mm, then a small change will produce only a small change in fieldmeter reading. But, if the ground plane is too close to web, then the same amount of change will produce much larger change in the fieldmeter reading [26].
2.11. Effect of Near By Objects
To understand the effect of near by objects what happens during generation of static electricity should be understood clearly. Let’s start with the definition of ‘volt’. When
0.35
- 0.05 0.0 + 0.05
0.1 0.15 0.2 0.25 0.3
0 20 40 60 80 100
Web-to-plane distance –L (mm)
F
ieldme
ter
r
eadi
ng
(kV
/c
m
)
0.35
- 0.05 0.0 + 0.05
0.1 0.15 0.2 0.25 0.3
0 2020 4040 6060 8080 100100
Web-to-plane distance –L (mm)
F
ieldme
ter
r
eadi
ng
(kV
/c
m
)
we must understand electrical work. Volt is potential difference against which one joule of work is done in the transfer of one coulomb of charge [27]. Work is done when opposite charges are separated. All measurements must be done by using the difference material and reference location. For electrostatics, this reference location is earth. Earth ground is defined as the zero of potential. When a spot on web has 250 volts, it means that it takes 250 volts of electrostatic work to separate charges from all the surrounding grounds [27].
During measurements the person must reduce the influence of the surrounding grounds. This is especially important doing measurement with voltmeters [27].
When the rollers are grounded, the area between web and roller can be used as the ground location with the voltmeter/fieldmeter placed over the center of the web-roller contact region.
An electrostatic fieldmeter measures the electric field between the web and the instrument. The web potential can be found from the reading of the fieldmeter and the distance between probe and the web. This works only if there are no grounded objects near the web. For this reason tests should be done on a large web, in which the distance of rollers is far, or person must know the capacitance of each grounded object [27].
When a grounded object is placed close to the web, it will effect the measurement (as shown in figure 27). A person is also a grounded object, so while doing the tests; a person shouldn’t be close to the web unless the capacitance is known [27]. If there are no grounded near-by objects, a fieldmeter is the best instrument to use. Otherwise, the electrostatic voltmeter should be used.
Industry tries to keep static potential below 5000 volts. This is also called ‘5000 volts rule’. This measurement should be done by using a fieldmeter at a distance of Fieldmeter
Floor
Volts
Distance Fieldmeter
Floor
Volts
Distance Fieldmeter
Floor Fieldmeter
Floor
Volts
Distance Volts
Distance
Fieldmeter
Floor
Volts
Distance Fieldmeter
Floor
Volts
Distance
Measurements should be done at a true span of web. This means while changing the distance between fieldmeter and web, the value should not change [27].
2.12. Problems with the measurements
One problem is approximation of the electric charge density on the web. If the web has high enough electrical resistivity the net charge density can not be affected by the fields. In this situation we can assume uniform charge density. But, webs generally do not have uniform charge. Figure 28 shows comparison between uniform and non-uniform web potentials.
The fieldmeter face might also be a problem during the calculations. The surface is a conductor and the constraint on a conductor is that the electric field must be zero within it. Calculations should be done whether the charge on the face is uniform or not [28].
One common thing that is being done is assuming the system as a capacitance. This can give correct results when having two parallel plates long enough. Generally, to have 2 parallel plates, a conductive plate that is around the fieldmeter is used. The ratio of this plate and sensing surface of the probe should be around 5:1 [28]. Some researches have noted that the electric
3. Experimental Setup and Apparatus
This experimental setup was devised to study the influence of material properties, fabric design, components of fabrics, environmental properties (temperature, humidity) and working conditions (fabric speed, tension, machine parts) on generation of static potential on moving fabrics. Developing the equipment was the primary objective of this research.
3.1. Materials
Five different kinds of fabrics were used during the tests. These were:
● 85% polyester and 15% conductive polyamide (A type of Albany International belt)
●100 % polyester woven fabric (Guardian™ – AstenJohnson)
●100 % polyester spiral fabric (SpiralTuf™SW-70 – AstenJohnson)
● 85% Polyester and 15% conductive Polyamide woven fabric (Webmaster™ F325 –
AstenJohnson)
●85% Polyester and 15% conductive Polyamide woven fabric (Webmaster™ G1340D –
AstenJohnson) It is a 1.5 layer fabric.
Conductive monofilament yarns are in both machine and cross direction of the fabric. The diameter of polyester that is used as warp yarns is 0.03556 mm (0.014 inches), and 0.04064mm (0.016 inches), 0.7112mm (0.028 inches) for weft yarns. Conductive monofilament has 0.04064 mm (0.014 inches) diameter in cross and 0.7112 mm (0.016 inches) in machine direction.
direction. Conductive monofilament has 0.020” diameter in cross and 0.031” in machine direction. It is a single layer fabric.
3.1.1. Resistivity of belts:
Resistivity property is one of the parameters that effect our tests. Overall resistivity of a fabric depends on its components. The resistivity of polyester is about 10-16Ω-1m-1, polyamide is about 10-15Ω-1m-1, and conductive polyamide is about 2*104 Ω-1m-1. The difference between normal and conductive polyamide is very large.
Polymer properties are not the only factor on fabric resistivity. The percentage of each compound is also important, especially when a conductive yarn is used. Conductive fabrics have one conductive monofilament yarn in machine and cross direction for every 8 monofilaments.
3.1.2. Structural Variables:
Two main causes for charge generation are contact and friction. Friction depends on the number of contacts between materials. As contacts increases, charge generation is greater. So, the parameters that affect this number are:
• Warp and weft yarn density • Number of layers
Our test fabrics were single layer, 1.5 layers and 2 layers. The increase in number of layers means that there will be more contact points, more friction.
Additional to these 3 fabrics; another model, which is 100% PET woven fabric, Guardian was tested.
The most different structure that was tested was SpiralTuf SW-70. It is formed by spirals. That means there are no warp yarn along the fabric and weft yarns were hold together by spirals. Figure 30 shows a detailed picture of its structure.
3.2. Machine Used for Testing
For our tests a system that allows fabric transport through the rollers was needed. The spunbond machine in NCRC Partners’ Laboratory was used.
Machine properties:
• Belt speed can be changed from 0 to 1000 feet/min. In our tests the speed range
was between 100 and 300 feet/min. The 300 feet/min is a similar to commonly used in industry.
• Tension can be adjusted by changing the position of the back roller of the
machine. As there is no digital tension device on the machine, tension is Weft yarn
Figure 30: Detailed picture of SpiralTuf™SW-70 type belt
1
2
3
4
Grounded
metal layer
1
2
3
4
Grounded
metal layer
measured by a hand-held tension device. Tension was changed 3 times at 300 feet/min for every fabric.
We found that tension across the width of the fabric was not uniform. For this reason the measurements were made for middle, left and right areas separately,
and then compared.
Figure 31 shows the points that were tested on fabrics. Additional to the 3 areas that were cross direction, 4 different areas through the machine direction were used for testing. By doing this, it is easy to see the effect of the grounded metal layer and it also illustrates charge generation properties during fabric transport.
3.3. Data Loggers
• Temperature and humidity are measured by data loggers. As four probes were
used, 4 data loggers were used during testing in front of each probe. These
save these data. It has capacity of 21,500 data sample and can measure at least in every 10 seconds.
The accuracy for humidity is +/- 2% and for temperature is 0.15 C0. These values were sufficient for our tests.
There is no control on temperature and humidity in Partners’ Laboratory. For this reason tests should be done in cold and warm weather. Humidity changes were done by spraying water on the belt.
• Measurements were made in 4 different areas along the fabric (as shown in figure
36) and 3 different areas (middle, right and left) across the fabric width. To see the effect of time, charge density was measured in different areas. As fabric moves from one place to another, without touching any machine parts, it has a tendency to generate charge according to its material structure. Also, by measuring static potential before and after machine parts, we investigated the effects of grounded and ungrounded machine parts that are in contact with the web.
3.4. Charge Decay Setup
Charge decay tests were done to find a relationship between static potential on fabrics during production and their charge decay rates. For this test the Electro-tech Systems model 406D static decay meter was used.
All materials have different resistivity properties. If materials have low resistivity that means less time is needed for the fabric to decay the charge on it.
There are two kinds of resistivity for webs, bulk and surface resistivity. The instrument that was used is for surface resistivity.
Style Mesh M.D. Diam. X.D. Diam. F.S.I. Air Perm.
1.5 Layer
WebMaster™ F325
75 X
26 0.014'' Polyester 0.016'' Polyester 57.5 660 cfm/ft²
0.014'' Conductive Polyamide 0.016'' Conductive Polyamide
0.028'' Polyester
Double Layer
WebMaster™
812 74 X 40 0.014'' Polyester 0.028'' Polyester 42.3 655 cfm/ft²
0.014'' Conductive Polyamide 0.016'' Polyester
0.016'' Conductive Polyamide
Single Layer
Taurus 200P - AS
23 X
11 0.030'' Polyester 0.031'' Polyester 22.5 820 cfm/ft²
0.030'' Conductive Polyamide 0.031'' Conductive Polyamide WebMaster™
G1340D 50 X 16 0.020'' Polyester 0.031'' Polyester 43.7 600 cfm/ft²
0.020'' Conductive Polyamide 0.031'' Conductive Polyamide
In addition to the fabrics that were used during test on the spunbond machine, 3 different fabrics were tested on the charge decay instrument to see the effect of structure on charge decay times. These fabrics were 100% woven polyester and they are not being produced. The difference is in their fabric structure. Table 3 shows some of the properties of these fabrics.
The definition of F.S.I., which is in the table, is ‘fiber support index’. This is used by the papermaking industry and describes the contact area between fabric and paper. The other differences are number of layers and the diameter of monofilaments. Charge decay time shows significance difference between different fabrics.
In charge decay tests it was assumed that there is only one value for the resistivity independent of the field applied. But we have to say that resistivity increases with decreasing field strength. The resistivities were usually determined at one field strength. Some fabrics can not be charged up to 5000 volts in the time required because of high resistivity. So, the values found for charge decay time is only the time for that specific amount of charge.
What happens during charge decay?
The problem with charge decay is the measurement system. There is a fieldmeter in the middle of fabric and it measures only the area under it. But as the charge on the fabric is not equally distributed, we can not be sure that this charge decay represents the whole of the fabric.
Another problem occurs when conductive monofilaments. Charge on a conductive fabric will be dissipated more quickly than regular fabrics. But this kind of information is only useful while using a certain amount of conductive monofilament on the structure. Otherwise during charge decay some charge will be left between conductive monofilaments. Decreasing the distance between monofilaments in the structure will help dissipation of charge because of the required space that electron should pass to move on a conductive monofilament.
3.5. Handheld Electrostatic Fieldmeter
At the beginning of this research, we wanted to test different kinds of fieldmeters to be sure about test requirements. We started from the basic fieldmeter which is a handheld electrostatic fieldmeter. The specifications of this type of instrument are:
• Easy to read and use • Lightweight and compact • Digital and bar graph displays • Can measure up to +/- 20kV
• Accuracy +/- 10% Figure 34: Handheld fieldmeter –Simco
The disadvantages of this fieldmeter are:
1. Hard to keep the distance between web and fieldmeter constant
The distance between web and fieldmeter effects the test results. Fieldmeters calculate the static potential on a web by using the distance to that web. If the web has a -15kV charge with the distance 1”, which means fieldmeter should give -7.5kV at 2” of distance. As the distance is kept by holding the instrument over the web, it is very hard to provide the same amount of distance every time during measurements. Even 0.1” difference between two tests will give different values.
2. There is no output to download data on a computer
Static charge on a web shows fluctuations. The results do change in every second. So, taking the data in a computer and calculating the averages, standard deviations is needed.
3. Sensitivity is not sufficient
Our tests required very sensitive instruments to see every little change on static charge generation. By using a handheld fieldmeter, there are some limitations about sensitivity. This will effect especially average and standard deviation values.
3.5.1. Measurements with Handheld Fieldmeter
The most important advantage of this type of instrument is that the position of the fieldmeter can be changed easily and measurements can be done very fast even in hard-to-reach areas. Using other type of fieldmeter can require much time and it is also hard to set-up the probes.
Figure 35: Spunbond machine
on charge generation at different speeds by doing measurements before the roller, on the roller and after the roller.
3.6. One-Probe Electrostatic Fieldmeter
The second step was to use a one-probe fieldmeter to see the differences between previous tests which were done by using the handheld instrument. The model that is used was Monroe Electronics SE0054. The specifications of this fieldmeter are:
• Range +/-20kV
• Sensitivity 10V/cm • Probe type: 1036-F
Grounded
metal layer
Grounded
metal layer
FRONT SIDE BACK SIDE
Figure 36: The areas that measured by using the handheld fieldmeter
After the roller On the roller
• Easy for hard-to-reach environment • Recorder output
Mounting this probe on a belt at a distance of 1 cm provided better results than the fieldmeter. Sensitivity is higher, and it is easy to see the data on instrument. There is an output device on it, so the results can be downloaded to a computer. That helps to get more accurate results.
There are two disadvantages of this instrument:
1. Basically probe measures the field on the belt under it. But the results can be affected by areas close to the measuring circle as shown in figure 38. ‘A’ shows the reason for error in results are shown when no conductive layer is used.
Figure 38-B shows more clearly the way decreases error. For this reason, using a conductive metal layer is required. Mounting the probe in the middle of conductive
Web
Probe 1036F
Web
Probe 1036F
Grounded layer
Web
Probe 1036F
Grounded layer
Web
Probe 1036F
A
B
surface decreases error rate. But it is very hard to mount as the gap between probe and metal layer is very small. These two shouldn’t touch each other during measurement.
The grounded metal layer that was used was an aluminum layer which has 1 mm thickness.
2. Static charge changes time by time because of the effects of some parameters; measurements should be done at different areas at the same time. For this reason, a multi-probe instrument should be used. The other disadvantage of using this one-probe instrument is the limits of measuring different areas.
Static potential on different areas at machine direction also tested with this instrument. As some parameters (humidity, temperature, friction, etc.) changes every time; it is a big possibility that the results had errors. Figure 39 shows the areas that one-probe instrument was used to do tests.
3.6.1. Measurements with One-probe Fieldmeter
A
B
C
D
E
Vacuum layer – grounded metal
Grounded metal
A
B
C
D
E
Vacuum layer – grounded metal
The effects of experimental parameters (separation, grounded layer which is in touch with fabric, transporting, grounding metal layer that is not in-touch with fabric) can be seen from the results. Before running the tests, these results were expected:
• Area ‘A’ (figure 39) should have the highest charge because of the separation • Area ‘B’ should have lower charge than ‘A’ because of charge dissipation to the
air
• Area ‘C’ should have the lowest charge as it is the first point after grounded metal
layer. Most of the charge on belt should move to the grounded layer.
• Area ‘D’ should have higher charge than ‘C’ because of fiber-to-fiber friction. • Area ‘E’ should have higher charge than ‘D’ because of friction.
3.7. Multi-probe Fieldmeter
This type of fieldmeter was used to overcome the limitations of the one-probe model. This instrument allowed us to see the changes at the same time for different areas, better illustrating the effects of different experimental parameters.
The probes that were connected to it were the newest model and these provide less error during measurements. Here are the specifications of this fieldmeter:
• Analog outputs: +/- 10kV • Sensor range: +/- 20kV • Accuracy better than 1% • Probe type: 1036-E • Number of probes: 4
• Probe operating environment: -30-100oC
• Speed of response: 250 ms
3.8. How Does It Work?
To use the multi-probe instrument on the spunbond machine, some mounting parts were needed. Figure 41 shows the mounting parts that were manufactured. These are:
● 4 metal probes to put sensors on. By using grounding cables the error rate was
decreased
● 4 wooden bridges to mount metal plates
● Data acquisition card to get the data from fieldmeter and download it onto a
computer
The figure above shows the connections of the system elements. 4 probes are connected to the fieldmeter and by using a data acquisition card results can be downloaded. Temperature and humidity data loggers are connected to computer to compare the results from these loggers and fieldmeter.
probes
Temperature & Humidity data loggers
Data acquisition card
computer Fieldmeter
probes
Temperature & Humidity data loggers
Data acquisition card
computer Fieldmeter
![Figure 9: A rotating-vane fieldmeter [13]](https://thumb-us.123doks.com/thumbv2/123dok_us/1570727.1193117/26.612.96.490.157.384/figure-a-rotating-vane-fieldmeter.webp)
![Figure 24: A design to measure charge on both sides of a web [26]](https://thumb-us.123doks.com/thumbv2/123dok_us/1570727.1193117/39.612.92.461.399.602/figure-design-measure-charge-sides-web.webp)
![Figure 25: Distance (L) vs. charge on web [26]](https://thumb-us.123doks.com/thumbv2/123dok_us/1570727.1193117/41.612.91.423.300.565/figure-distance-l-vs-charge-web.webp)

